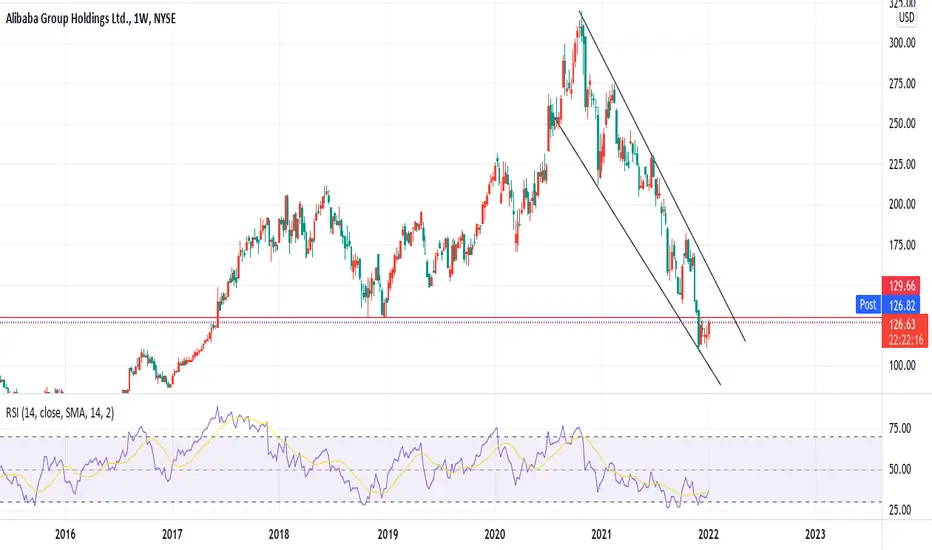
The most likely scenario on BABAbased on the price pattern has been formed in the last 3 years, the most likely scenario is what is shown by the blue line marked on the chart.
due to the last move of the price and disability to catch the Last High which is marked by the orange line, market structure hasn't changed and downtrend is still continuous.
so i'm expecting a new low and all of the mentiond fact beside the weakend downtrend show me a scenario which is marked on the chart by blue line.
Bababuy

BABA LONGHere is my target for your reference only.
Mua(Long): 81.3 Ngay(Date): 17/03/2023
TP: 105.9
SL: 73.6

Options Ahead of EarningsLooking at the BABA Alibaba Group Holding options chain ahead of earnings, i would buy the $85 strike price in the money Calls with
2022-12-16 expiration date for about
$3.79 premium.
If the options turn out to be profitable Before the earnings release, i would sell at least 50%.
Looking forward to read your opinion about it.

BABA LONG HOLD IDEALARGE MARKET CAP
BABA Discount 80% From Top
USD Extreme Bear Levels
Stock Recovery Imminent!
TARGETS:
115 EARLY PROFIT
150 RALLY TOP
200 MAJOR RESISTANCE
300 FULL RECOVERY
450 MOONSHOT!
Happy Trading!

BABA - Bullish BreakBABA has made a strong reversal
Broadening Wedge
I see this reversal continuing, letting price hit the middle dotted trend line and then forming a nice support above 0.5
Very cheap buy the dip scenario

Alibaba lift off !! Alibaba
Short Term - We look to Buy at 102.52 (stop at 92.78)
Dip buying offers good risk/reward. Trading volume is increasing. Previous support located at 100.00. Trading close to the psychological 100.00 level.
Our profit targets will be 138.58 and 164.00
Resistance: 120.00 / 138.50 / 180.00
Support: 100.00 / 83.00 / 73.51
Disclaimer – Saxo Bank Group. Please be reminded – you alone are responsible for your trading – both gains and losses. There is a very high degree of risk involved in trading. The technical analysis, like any and all indicators, strategies, columns, articles and other features accessible on/though this site (including those from Signal Centre) are for informational purposes only and should not be construed as investment advice by you. Such technical analysis are believed to be obtained from sources believed to be reliable, but not warrant their respective completeness or accuracy, or warrant any results from the use of the information. Your use of the technical analysis, as would also your use of any and all mentioned indicators, strategies, columns, articles and all other features, is entirely at your own risk and it is your sole responsibility to evaluate the accuracy, completeness and usefulness (including suitability) of the information. You should assess the risk of any trade with your financial adviser and make your own independent decision(s) regarding any tradable products which may be the subject matter of the technical analysis or any of the said indicators, strategies, columns, articles and all other features.
Please also be reminded that if despite the above, any of the said technical analysis (or any of the said indicators, strategies, columns, articles and other features accessible on/through this site) is found to be advisory or a recommendation; and not merely informational in nature, the same is in any event provided with the intention of being for general circulation and availability only. As such it is not intended to and does not form part of any offer or recommendation directed at you specifically, or have any regard to the investment objectives, financial situation or needs of yourself or any other specific person. Before committing to a trade or investment therefore, please seek advice from a financial or other professional adviser regarding the suitability of the product for you and (where available) read the relevant product offer/description documents, including the risk disclosures. If you do not wish to seek such financial advice, please still exercise your mind and consider carefully whether the product is suitable for you because you alone remain responsible for your trading – both gains and losses.

Baba Ali Baba Buy NowAccording to my chart analysis , Baba Ali Baba Show strong signal to buy , buy max as you can .

BABA - Long Term EntrySimilar drops in red, the first and the third are the most comparable
The third drop has pushed price down, right back to the first drop point
A new cycle should proceed, as this pattern sequence completes itself

BABA Price TargetThe Price Target for BABA Alibaba is $135.
All the Chinese stocks are primed for a strong recovery after China`s top administrative authority said it would work to stabilize the stock market and boost economic growth!
Traders are expecting the Chinese government would support the stock market like the FED did in the US.

ALIBABA , is gonna ready for end this correction eventually ?A three-wave ascent and then a diagonal drop indicate that we are in a larger scale in a triangle or structure.
+ Personally, my entry strategy is wait for the conflict and corrections of the indexes to end and see a confirmation of the end of the downtrend, and I confidently enter with a heavy volume ... because it has good conditions for entry !
+The analysis is based on the fact that the United States reached a trade agreement with China to prevent its enemies from uniting.

Great Long Opportunity on BABA
Great Long Opportunity on NYSE:BABA , but wait and see if VMC green buy indicator keep showing at the end of the month!
Potential 150% gains if BABA reach ATH!
**I think NYSE:BABA is a great mid-long term hold although there is "delisting risk" with the chinese stocks on NYSE**
NYSE:BABA
www.tradingview.com

Have Started Buying BABA Here.I don't see this company shutting its doors, stock down 60% and this looks like a solid weekly bottom forming. Low time frames look great also. Not advise archiving thoughts.
BABA - Alibaba Group Holding LtdBullish - Will require patience like my other trades.
( NYSE:BB NASDAQ:TLRY )
Previous Close 165.24
Open 159.99
Bid 159.56 x 800
Ask 159.57 x 800
Day's Range 158.56 - 161.74
52 Week Range 152.80 - 319.32
Volume 30,294,580
Avg. Volume 20,830,984
Market Cap 436.158B
Beta (5Y Monthly) 0.81
PE Ratio (TTM) 19.25
EPS (TTM) 8.28
Earnings Date Nov 03, 2021 - Nov 08, 2021
1y Target Est 1,788.37
NYSE:BABA
CAPITALCOM:BABA
BCBA:BABA
SIX:BABA
MOEX:BABA-RM
SWB:AHLA
CAPITALCOM:9988
BCBA:BABA
OTC:BABAF
FTX:BABAUSD
MYX:ALIBABA-C3
SWB:2RR
BITTREX:BABAUSD
BABA - POSSIBLE TRADEHello there,
As you can see in the chart BABA is holding the 0.786 FIB level and bouncing from there, also we have a bullish RSI divergence confirming our entry.
We will enter our trade in this level with a SL in the yellow line.
Our target: sky is the limit, you can chose your own percentage.
Cheers.

BABA - Strong BUY!Fibonacci Clustter
strong buy signal on BABA, 61.8% retracement plus an extension of 1.618%.

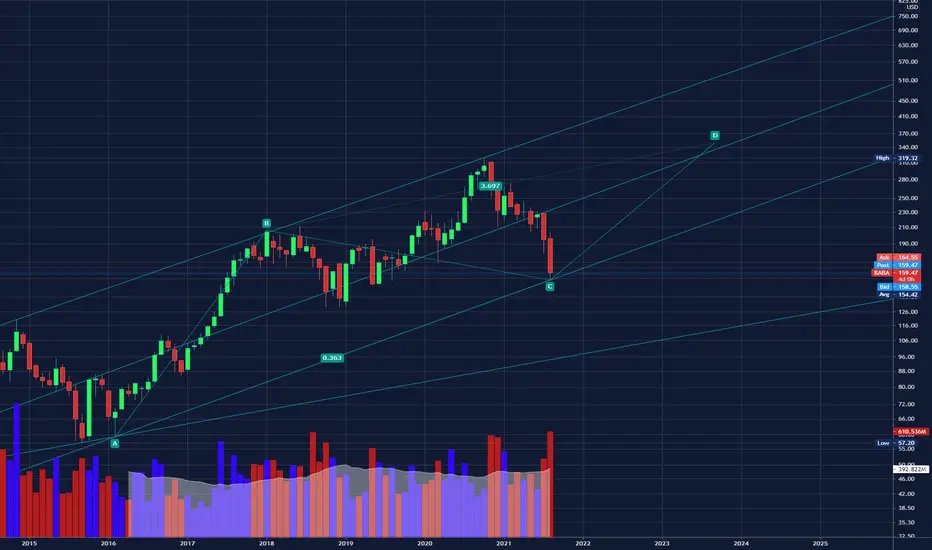
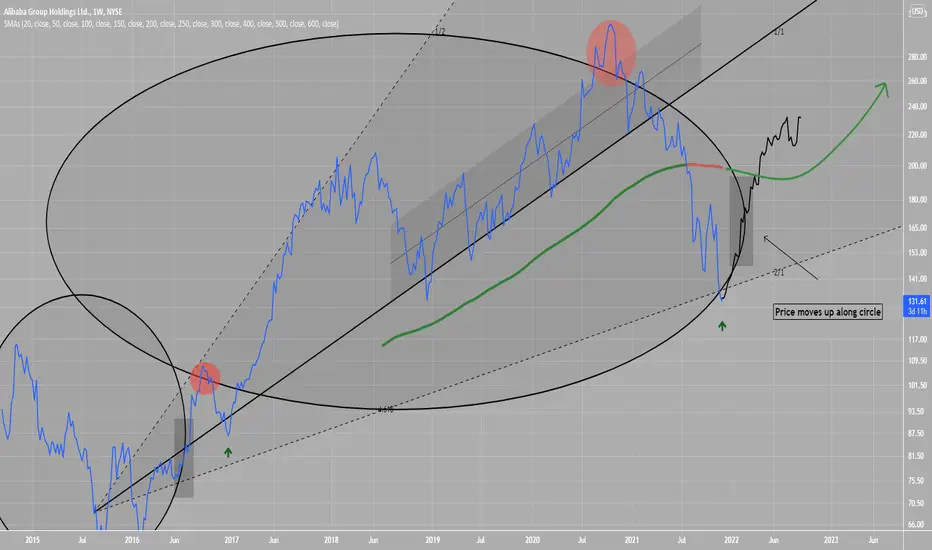
BABA Amazing Long OpportunityBABA has retraced from its all time high a lot
This is ok, as it has provided a lovely buy opportunity (buy the dip)
I expect price to move up along the 4.618 circle, and make a recovery
Attaching my thoughts about how price tends to move up along the circle.
My perception of Alibaba's weekly stock chartMy perception of Alibaba's weekly stock chart as follows !
After a five-wave with three continuous shares, it enters a correction in the form of a second wave. This is formed as a flat with a big b wave. maybe just it want to make triangle to ready for powerful third wave .. so buying and maintaining it at prices from $ 140 to $ 150 is extremely attractive
Considering the time of the second wave, , it noted that the third wave is the main continuous wave and has very high goals .. maybe above $ 1500 😁 .. so the long holding stock may not be bad .. though it does bother you a little over time

BABA: Alibaba's future looking goodBABA trying to break the resistance line! Looking to crate a higher low, so that we change the down trend! If it breaks the resistance line it will have a great upside move! Also waiting for the results coming out on the 18th which will decide its future! Positive results, will lead BABA faster to the upside move! Big investors and hedge funds are already in, its a matter of time for it to go up

BABA Daily TimeframeSNIPER STRATEGY
This magical strategy works like a clock on almost any charts
Although I have to say it can’t predict pullbacks, so I do not suggest this strategy for leverage trading.
It will not give you the whole wave like any other strategy out there but it will give you huge part of the wave.
The best timeframe for this strategy is Daily, Weekly and Monthly however it can work any timeframe above three minutes.
Start believing in this strategy because it will reward believers with huge profit.
There is a lot more about this strategy.
It can predict and also it can give you almost exact buy or sell time on the spot.
I am developing it even more so stay tuned and start to follow me for more signals and forecasts.

Alibaba Stock Analysis Using Gann AnglesAlibaba Stock Analysis Using Gann Angles
The angle ends on October 21
The expected reflection area is $150 - $130
Look for a bargain in these areas


BABA Long Term Weekly Chart Weekly Chart for ALl BABA holders
Be strong we will see all target
HOOOOLD
Regards NYSE:BABA

Alibaba Group Holding $BABA - Bullish idea 💡 This is based on 10D timeframe, the stock in the middle of the demand zone. Selected the best entries. Technical indicators still bearish except on entra day.
