BABYDOGE Bulls Step In at Historical Demand ZoneOKX:BABYDOGEUSDT is showing bullish signs on the weekly timeframe after rebounding from a strong historical demand zone. Price has respected this zone multiple times since early 2022, and once again, buyers have stepped in aggressively, leading to a solid bounce.
The current structure suggests a potential reversal if momentum continues, with the possibility of retesting previous resistance zones near 0.000000020 and higher. A clean breakout above short-term consolidation could trigger a strong move, similar to past rallies from this level. This area continues to act as a major accumulation zone for long-term holders.
Resistance 1: 0.00000002500
Resistance 2: 0.00000004100
Resistance 3: 0.00000006500
Stop Loss :0.00000000800
Babydogecoin

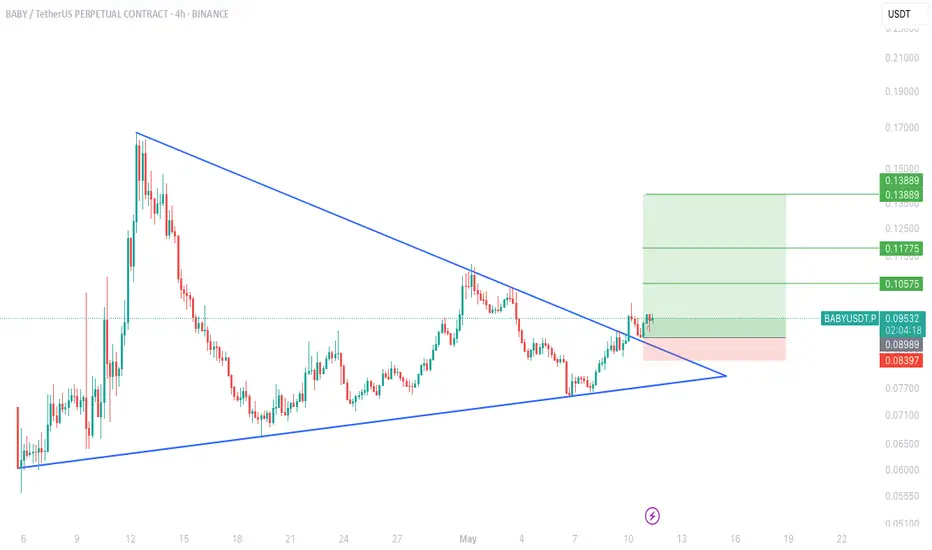
$BABY Breakout Alert!TSX:BABY chart update:
Symmetrical triangle breakout in action on the 4H chart! 📈
Price has broken above the resistance trendline with solid structure, confirming a classic bullish continuation setup!
🎯 Targets:
• TP1: $0.10575
• TP2: $0.11775
• TP3: $0.13889
📍 Risk-reward is prime with tight invalidation below $0.089.
Let’s ride the momentum — breakout traders, your moment is here!
If you find this analysis helpful, please hit the like button to support my content! Share your thoughts in the comments, and feel free to request any specific chart analysis you’d like to see.
Happy Trading!!
Baby Doge Near Support — 24% Upside to 0.000000001600!Hello and greetings to all the crypto enthusiasts, ✌
All previous targets were nailed ✅! Now, let’s dive into a full analysis of the upcoming price potential for Baby DogeCoin 🔍📈.
After an extended downtrend, Baby DogeCoin is now approaching a key support zone, hinting at a potential short-term reversal. If the support holds, a 24% upside move toward the 0.000000001600 target remains on the table. 📈
🧨 Our team's main opinion is: 🧨
Baby DogeCoin is testing strong support, eyeing a potential 24% move toward the 0.000000001600 target if momentum holds. 🔍
Give me some energy !!
✨We invest hours crafting valuable ideas, and your support means everything—feel free to ask questions in the comments! 😊💬
Cheers, Mad Whale. 🐋

Why Is Baby Doge Cryptocurrency Making This Massive Move?Baby Doge Coin ( CRYPTOCAP:BABYDOGE ) has been on a strong upward trajectory, catching the attention of traders and investors alike. But what’s driving this rally? Let’s break it down.
Strong Monthly Demand Imbalance Fuels the Rally
One of the key factors behind Baby Doge’s surge is a significant demand imbalance on the monthly chart. This means buyers are aggressively stepping in, absorbing available supply and pushing prices higher. When demand consistently outweighs supply, it creates a bullish environment—and that’s exactly what we’re seeing with Baby Doge.

Baby Doge Coin: Expecting 55% Drop, Target $0.00000000085Hello and greetings to all the crypto enthusiasts, ✌
In several of my previous analyses, I have accurately identified and hit all of the gain targets. In this analysis, I aim to provide you with a comprehensive overview of the future price potential for Baby Doge Coin , 📚💣
The price is currently within a descending channel and has breached nearly all major support levels. Given the current market dynamics, Baby Doge Coin is likely to experience an additional decline of at least 55%, with the potential to reach a price target of 0.00000000085. This ongoing bearish trend signals sustained downward pressure, and further declines may occur if the trend continues. For a clearer understanding, the critical support and resistance levels are clearly outlined on the chart. Monitoring these levels closely will be crucial for assessing potential future price movements.
🧨 Our team's main opinion is: 🧨
The price is in a downward channel, has lost key supports, and Baby Doge Coin could drop another 55% towards a target of 0.00000000085, with support and resistance levels clearly marked on the chart.
Give me some energy !!
✨We invest countless hours researching opportunities and crafting valuable ideas. Your support means the world to us! If you have any questions, feel free to drop them in the comment box.
Cheers, Mad Whale. 🐋

Baby Dogecoin: New Parallel Channel, Consolidation & DeclineHello and greetings to all the crypto enthusiasts, ✌
All previous targets were nailed ✅! Now, let’s dive into a full analysis of the upcoming price potential for Baby Doge Coin 🔍📈.
I foresee the development of a new parallel channel for Baby Dogecoin, indicating a consolidation phase in the market. Additionally, further declines are expected as the price interacts with key resistance and support levels. These critical zones have been highlighted on the chart, with corresponding percentages to better illustrate potential price movements. This analysis provides a clear roadmap for upcoming market dynamics. 📚🙌
🧨 Our team's main opinion is: 🧨
Baby Dogecoin is likely to form a new parallel channel with declines, testing key resistance and support levels, all marked with percentages on the chart. 📚🎇
Give me some energy !!
✨We invest countless hours researching opportunities and crafting valuable ideas. Your support means the world to us! If you have any questions, feel free to drop them in the comment box.
Cheers, Mad Whale. 🐋

BABYDOGECOIN USDT Following Doge, Breakout CloseBaby Doge is following Dogecoin. Doge has broken out of its downtrend and has found support on the envelope. Baby Doge lags behind Doge from what I see in the charts. So when there is a big pump in Doge, Baby Doge is not far behind. Once Baby Doge breaks out of its downtrend its going to go straight up following Doge.
This is just my opinion, none of this is financial advice. Thank you

babydoge to the mooon !#babydoge has a huge stacked volume at a range between 0.0000000018 and 0.0000000016 so then it can make make a huge rising wave after that check out our last analysis on long time frame

Babydoge Memecoin Analysis Top Memecoin 2025 Babydoge Memecoin is a top Memecoin to invest in the beginning of 2025 after reaching the weekly demand level mentioned in this crypto analysis. Expecting a decent reaction.

Maximize Your Portfolio with Baby Doge Coin for More GainHello and greetings to all the crypto enthusiasts, ✌
In several of my previous analyses, I have accurately identified and hit all of the gain targets. In this analysis, I aim to provide you with a comprehensive overview of the future price potential for Baby Doge Coin , 📚💣
The potential for Baby Doge Coin to experience significant growth is largely driven by its association with influential figures, notably Elon Musk. The strength and engagement of a coin's community directly impact its market interest and overall traction. Given recent trends in the coin’s chart and trading volume, I anticipate a price increase of at least 55% . 📚✌
Moreover, technical analysis indicates that the next support level, as identified by the Fibonacci retracement, suggests a strong foundation for continued upward momentum. This confluence of factors positions Baby Doge Coin for further growth. 📚🚀
The growing interest from both individual and institutional investors adds to its potential for long-term gains. As the market evolves, Baby Doge Coin appears well-positioned to capitalize on these dynamics. 📚🎇
🧨 Our team's main opinion is: 🧨
Baby Doge Coin's growth is driven by its connection to Elon Musk and a strong community, boosting market interest. With a projected 55% gain.
Thank you for your attention. If you have any questions or comments, I’m here to respond to you. 🐋💡

BabydogeFirst support 0.000000002927
First target 0.000000006486
Second target 0.000000008661
If you enter the selected targets on December 26 within a period of less than 20 days
If you enter at Fibonacci 0.23, it would grow by 128%

Breaking News - BABYDOGE Is Getting Listed on COINBASE MartyBoots here , I have been trading for 17 years and sharing my thoughts on BABYDOGE.
COINBASE LISTING COMING
BABYDOGE is looking beautiful , very nice chart for more upside
Very similar to MATIC which is up nearly 30% today
Do not miss out on BABYDOGE as this is a great opportunity
Watch videos for more details

Is the Baby Doge Coin the next Dogeusdt?Hello and greetings to all the crypto enthusiasts, ✌
In this analysis, I aim to provide you with a comprehensive overview of the future price potential for Baby Doge Coin , 📚💡
Although the straightforward answer to this question could be "no," I believe there is significant potential for this stock to appreciate further, with the possibility of reaching even higher price levels. Personally, I remain bullish on its prospects due to strong fundamentals and favorable market conditions. 📚✨
From a technical standpoint, the chart signals a continued upward trend, with key indicators suggesting further growth. The stock has shown resilience, and I anticipate it may continue to outperform in the coming weeks. Overall, I see a promising outlook for this stock, driven by both technical and market-driven factors. 📚🎇
🧨 Our team's main opinion is: 🧨
While the direct answer might be "no," I see strong potential for the stock to rise further, supported by positive technical indicators and market conditions. Its upward trajectory appears likely to continue in the near term.
Thank you for your attention. If you have any questions or comments, I’m here to respond to you. 🐋💡

Baby Doge CoinLike Floki, Baby Doge is another meme coin that seems to have started an uptrend wave. If we have an altseason, I think BabyDoge is the one to consider for meme coins as part of your portfolio.

Babydoge can follow main doge ? BABYDOGE / USDT
I have successfully caught all the doge bottoms recently, 3 in rows.. congratulations if you followed me
Watch the babydoge as it may follow the main doge
Price is at a support level and trying to break out of the pattern

BABYDOGE Ready to Explode!BABYDOGEUSDT Technical analysis update
BABYDOGEUSDT price is breaking out of a 1,200-day range. We can anticipate a strong bullish move once the price successfully breaks the resistance. The rise in volume near the resistance indicates increasing interest, and if the breakout is confirmed, a potential 200%-500% upward move could follow.

1mbabydoge/usdt Trading Idea1mbabydoge/usdt Trading Idea
1mbabydoge/usdt is showing potential as it tests a key resistance level. The price is consolidating within a defined range, which could be the buildup for a strong move. If a breakout occurs, it may signal a shift in momentum toward a bullish trend.
Key observations:
- Watch for a breakout above the resistance zone, confirmed by a 4H or daily candle close.
- A retest of the breakout level as support could provide a safer entry point.
- Increased trading volume during the breakout would suggest strong buying pressure.
Trading tips:
- Ensure proper risk management by setting stop-loss orders below the breakout zone.
- Look for additional confirmation from indicators like RSI or MACD trending upward.
- Avoid jumping into the trade during low-volume conditions to prevent false breakouts.
Potential targets:
- First target: Monitor the next significant resistance level.
- Second target: Aim for a larger move based on Fibonacci extensions or historical price levels.
Always remember, this is not financial advice. Conduct your own analysis before making any trading decisions.

BabayDoge VS Floki | ALTCOINS | WHICH can MOON ?Comparing B abydoge to Floki in this analysis.
Both are memecoins , and both have digits for days.
However, the one is evidently a pump-and-dump coin that showed no growth so far, whilst the other looks a little more promising ( for a memecoin at least ).
I'd still prefer DOGE and SHIB, but there are interesting trading opportunities in these two alts. First after a retracement, BabyDoge is likely to be the next one to make large increases since Floki is already trading close to its previous ATH.
More on DOGE VS SHIB here :
____________________
MEXC:BABYDOGEUSDT BINANCE:FLOKIUSDT

BABYDOGEUSDT 1000% Potential!BABYDOGEUSDT technical analysis update
BabyDoge has been consolidating for the last 1,150 days, and the price is now breaking out of a 3-year consolidation. We can expect a strong bullish move once the breakout is confirmed on the weekly chart.
Stop Loss: 1730
Take Profit: 300%-1000%

BABY DOGE COIN more gain expectedHello and greetings to all my valued followers and crypto enthusiasts. In this IDEA, I aim to provide some points and overview of the BABYDOGEUSDT’s position. 🙌🐋
As we can observe, in recent days, there has been a remarkable surge in volume for this coin, indicating heightened interest and activity in the market. This significant increase bodes well for a bullish trend, as it suggests that more traders and investors are becoming engaged, leading to an optimistic outlook characterized by green candles moving upward on the chart. 📚✔
In addition to this promising volume, I've taken the liberty of marking key points on the technical chart for your convenience. This analysis reveals two new resistance levels that are set at a higher position compared to the previous four resistance points we identified earlier. These new levels indicate a potential shift in market dynamics and further support the notion that the price of this coin may be on the verge of a substantial increase. 🎇📚
With these developments, it’s crucial to monitor the market closely, as the combination of increased volume and the establishment of higher resistance points often signals a strong upward momentum. As traders, we should remain vigilant and ready to act, as this could be an exciting opportunity for profit in the near future. 📚💡
🧨🧨🧨 Our team's main opinion is Recent volume for this coin has surged, indicating increased interest and a bullish trend. I've identified two new resistance levels higher than before, suggesting a potential price increase. Traders should stay alert for profit opportunities. 🧨🧨🧨
Thank you for your attention. If you have any questions or comments, I’m here to respond to you. 🐋💡

Exploring BabyDoge Coin: Is It Worth Buying?BabyDoge Coin ($BABYDOGE) has carved out a unique niche for itself in the world of meme coins. Initially launched as a playful homage to Dogecoin with a heartfelt mission of raising awareness for animal adoption, the token has evolved into a full-fledged ecosystem. With strong community backing, multiple features, and strategic utility integrations, BabyDoge has managed to capture the attention of crypto enthusiasts and animal lovers alike.
What Sets BabyDoge Apart?
At its core, BabyDoge Coin ($BABYDOGE) aims to be more than just a meme token. It serves as a symbol of community-driven efforts to promote animal welfare. In fact, BabyDoge has an official world record, having donated over 81,000 pounds of dog food to animal shelters. The initiative has reinforced its commitment to making a tangible impact in the real world, setting it apart from other meme tokens.
The project has gained significant attention, partly due to high-profile endorsements. A notable example is a tweet from Elon Musk, which propelled BabyDoge into the crypto spotlight. Since then, BabyDoge ($BABYDOGE) has been more than a meme; it has become an icon in pop culture.
Moreover, BabyDoge offers practical tools that empower its community. The BabyDoge AI Image Generator allows users to create AI-powered images, characters, and memes effortlessly. These can be minted as NFTs using $BABYDOGE, enhancing the token’s utility and incentivizing community engagement. BabyDoge’s multifaceted offerings also include BabyDogeSwap.com, an all-in-one decentralized platform featuring an Automated Market Maker (AMM), token farming, free token locking, a burn portal, NFTs, and more.
Where to Buy BabyDoge Coin
BabyDoge Coin has widespread availability across multiple crypto exchanges. The most active trading occurs on Gate.io, with the BABYDOGE/USDT pair recording a trading volume of $8.99 million in the last 24 hours. Other popular exchanges include OKX and Bybit, providing investors with ample opportunities to engage with this meme-driven market.
### Technical Performance and Market Metrics
As of the latest analysis, BabyDoge Coin ($BABYDOGE) has witnessed a significant 53.10% increase in trading volume, hitting $21.38 million over the last 24 hours. This uptick indicates renewed market interest but could also reflect the high volatility typical of meme tokens. Currently, the market capitalization of BabyDoge Coin stands at approximately $357.93 million, ranking it #189 on CoinGecko and #147 on CoinMarketCap.
The token's all-time high of $0.000000006345, reached on January 16, 2022, remains a distant milestone, with the current price down 64.25% from that peak. On the flip side, the all-time low was $0.000000000109477, recorded on June 9, 2021. Impressively, the token is now 2,293.55% higher than that low.
Price Trajectory and Key Support Levels
From a technical standpoint, BabyDoge Coin ($BABYDOGE) appears to be in a bearish phase. The token has experienced an 8.32% decline recently and is approaching a critical support level at $0.0000000178, which aligns with a 1-month support trend. Market analysts and traders are closely watching this level, as a potential breakdown could lead to further downside, while a bounce might drive the price toward $0.00000000290.
Concerns about the project's transparency have also affected sentiment. Critics point to the opaque management of vesting tokens and the lack of a clear roadmap. Influencers like Marsellis, who once advocated investing heavily in BabyDoge ($BABYDOGE), have begun to express skepticism. On social platforms like CoinMarketCap and Telegram, some community members have voiced frustration over restricted discussions and moderator actions that stifle transparency.
Community Engagement and New Developments
Despite these concerns, BabyDoge ($BABYDOGE) remains a community powerhouse. The introduction of a new Telegram mini-game has stirred excitement. This Play-to-Earn (P2E) game rewards participants with BabyDoge Coin ($BABYDOGE), offering a fun and engaging way to earn tokens. Additionally, the project’s robust integration of NFTs, AI tools, and a DeFi suite on BabyDogeSwap makes it a multifaceted ecosystem worth exploring.
Final Thoughts: Is BabyDoge Worth Considering?
While BabyDoge Coin has faced criticism for its lack of transparency, it continues to attract a devoted following. Its focus on animal welfare, coupled with innovative offerings like AI-driven image generation and decentralized finance tools, keeps it relevant. The token's listing on almost all major exchanges (excluding Binance) adds to its accessibility and trading appeal.
However, potential investors should tread cautiously. The token's history of pump-and-dump cycles and concerns about governance make it a speculative investment. Nonetheless, the combination of strong community backing, unique utility features, and a mission-driven approach keeps BabyDoge in the conversation as a notable meme coin on the BNB Chain.
For those intrigued by meme culture and the power of community, BabyDoge Coin presents both risks and rewards, making it a fascinating player in the ever-evolving crypto landscape.

BABYDOGE is testing historical resistance !BABYDOGE / USDT
Price is inside big accumulation phase for 3 years and now is trying to break the historical resistance which rejected the price HARD 3 times before !
With current meme coins surge babydoge becomes interesting 👀 Because if breakout is done The result of +1000 days accumulation could be very big
Note : strong volatility coin
DYOR

BabyDoge - WeeklyThis super consolidation of OKX:BABYDOGEUSDT can break and go up to the moon in the next alt season. 🚀
I expect more correction for now. 📉
