BAC

BAC: Potential shortWe can enter shorts in BAC at market, to diversify and avoid being 100% net long, and also, to fade this over loved and over owned stock's rally, as it moves back down to the triple key earnings support zone below.
I'd like to hold some shorts, since I expect the markets to chop sideways for the most part, and also to minimize my long exposure. This trade is fighting the recent trend and RgMov direction, so don't risk too big on it. Maximum of 0.5% is ok.
Good luck,
Ivan Labrie.

BAC Breakout playA lot of option activity in Bac the last couple of weeks. Looks like a very good opportunity for a break here based on the interest Hike "hope".

GNW bullish signals. Reversal started?GNW has had consistently bad earnings since 2014 until about Q1 of this year where the distressed financial company posted profits and shedding of toxic assets. MACD bullish divergence, Ichimoku crossed above kumo on the daily chart, we might see a turn around and long term climb to 6+. Keep in mind this is a fortune 500 company trading for $3.

The beginning of BAC uptrend?Signals:
double bottom
oncoming breakout of current channel
local flag formation
Buy 15.20 (local flag breakout)
Stop loss 14.69 (-1 tic of current fractal/ flag's low)
Target 18.00 (top line of monthly channel) 21.50 (strong inclined resistance)

BAC - EXPECTING THE BIG DROP ON DAILYBAC seems near to the completion of this corrective structure pointing to the downward trendline or to the dotted horizontal line. I'm expecting a drop to the lower trendline or to the 11$ low.


Bank of America still heading into resistance Still looking weak coming into this area..with a lower high. Watching this weeks close

BAC uptrend forming, but i think a correction is due hereI marked the range at which it may trade with blue trend lines and i set up my short idea as well. Nice risk vs reward ratio. NOTE The market is not open as the time of writing so i will wait to see what happens when the market opens, before making a decision.

Bearish Bac Breakout TradeSo the brexit aftermath might bring us a bear trend in bac, especially since rate hike is pretty much off the table now. So Entry 12.70 after a break down of support here would be a pretty good entry, and can ride it to around 12

WFC and other Financials Looking Grim WFC has been unable to gain 50.5-51 resistance for months now, and the chart may indicate that it is time to retest lower. the last weekly level retest was 44.59, which bounced strongly and reversed. if 46.6 is lost, we should look towards 43.2 for next support test.
Lower still is 41.65 and 38.03 as well as others, but these levels may not apply for some time

BAC TO MAKE NEW YEARLY LOWS?= Great R/R for SHORTTechnical analysis of BAC's chart indicates strong levels of resistance at 18, and 15.25, the latter of which has just seen a completed double top in the past few weeks
This indicates that we should break lows and test lower, 9.9 and 8.27 (more significant) supports are supports we could test.
let me know what you think

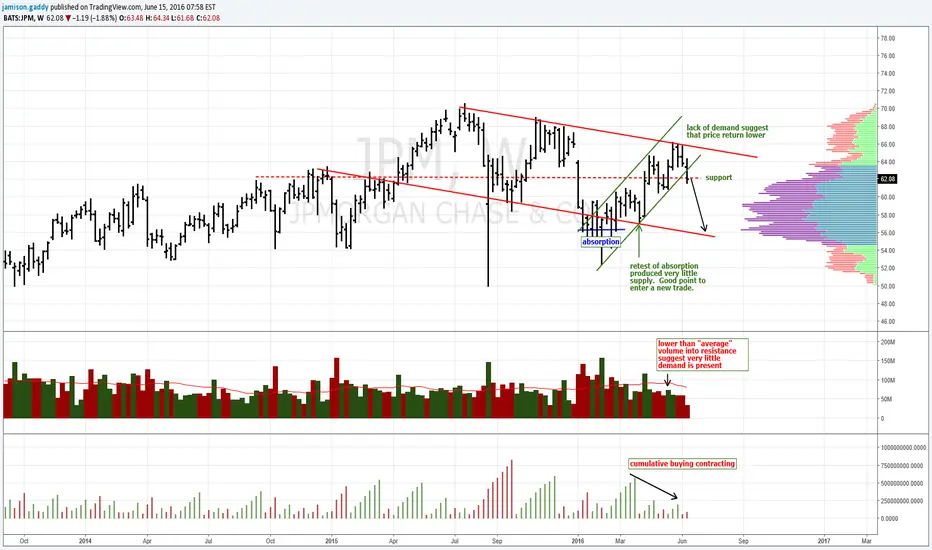
10% downside if $62 is lostGS was clear signs of buying or bullish absorption earlier this year. Early April GS pullback to test and define the number of "weak hands" that were remaining. The test produced very little selling and resulting in price finding bids into resistance.
Now that the "gap" is closed there appear to be very little demand and a weak close for the week would imply that we trade lower to retest the conviction of previously identified bulls. If so longs could be exposed to 10% risk.
Good Luck
signs of accumulation. bullish above $13.00BAC is showing signs of Accumulation. We can first reference the "preliminary supply" (PSY) in the end of 2015 followed by a "selling climax" (SCLX). The SCLX is a sign of a stopping actions and marks the beginning of possible accumulation. The "automatic rally" is the "dead cat bounce" that allows us to identify future resistance. This was followed by several test and re-test.
This April BAC broke out of the range created a "sign of strength" (SOS) and "jump across creek" (JAC). Now we are seeing prices retreat on contracting volume. This suggest that supply remain in strong hands. If volume remains weak; we have confirmation that price are very likely to begin the next phase: MARKUP.
Look for prices to confirm support while "backing up to the edge of the creek" (BEUC). Coincidentl, BEUC is very near the 50% Fibonacci retracement. I'm a buyer at $12.70
Good Luck!


Key Hidden Levels: A few trades we sharedThese are a few trades we shared at the KHL chatroom, I have shared the link in my previous posts.
If you're interested in learning more about the methods used by Tim West, which I learned and apply in my own trading, contact me privately. I also offer a signals service, with more setups, for FX, equities, metals and oil for the most part.
It's clear the market is in an uptrend for now. There is an uptrend signal in SPY, which indicates we might see a reaction by the 14-15th, which happens to match the FOMC meeting date. I reccomend monitoring equity longs closely by then. I'm in these and a few other trades, and I'll be looking to book profits safely. I'll update this publication if needed.
Check out my updated track record here: pastebin.com
Cheers!
Ivan Labrie
Link to Tim West's chatroom: www.tradingview.com
We discuss setups like this often there. Feel free to stop by and subscribe to his indicator pack. If you have any questions ask.
Risk disclaimer: My analysis is provided as general market commentary and does not constitute investment advice. I will not accept liability for any loss or damage including, without limitation, to any loss of profit which may arise directly or indirectly from use of or reliance on such information.

Banks are Bullish in near terms I am seeing bullish ascending/asymmetrical triangles forming on BAC and C, and rising wedges on WFC and JPM's hourly charts. Predicting positive reactions to economic data and interest rates in the upcoming weeks.

DFS: Post-FOMC longDFS is offering an interesting setup in the monthly, daily and 65 min charts. We can clearly see the reaction to the news has been positive and can expect continuation into the highs. Target on chart is derived from monthly price action, the stop from the daily, and we use the 65 min timeframe to get a clear picture of the price action around the news. All 3 timeframes support the idea that going long at market open is wise.
Risk is a drop to 53.74, but upside is as high as 58.10 within 3 months or less.
If interested in my trading signals, or in personal tuition, contact me privately. I'm offering a considerable discount on a packaged course which includes access to my private trading signals list for a year.
Cheers,
Link to Tim West's chatroom: www.tradingview.com
We discuss setups like this often there. Feel free to stop by and subscribe to his indicator pack. If you have any questions ask.

BACBDC Bank of America, is trading within two parallel lines. Could retest the bottom line or move higher to the upper channel line. MACD above 50% is good. Look for resistance at the 200sma


