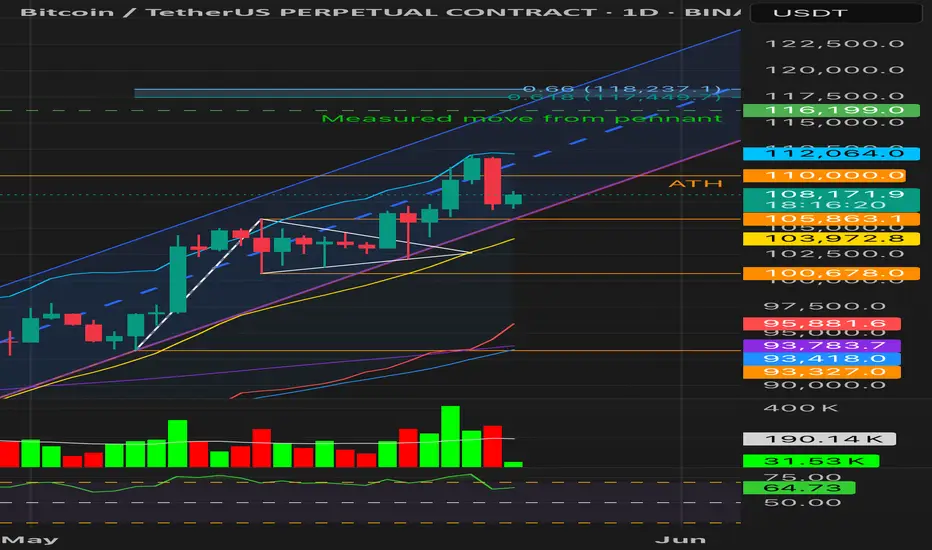
Bitcoin Breakout Under Threat or Bullish Retest?1D Chart
• Price broke above ATH (~110K) on May 22 with a +1.87% gain, backed by strong volume (~413K vs 190K avg) — signaling legitimate breakout intent.
• May 23 followed with a -3.93% bearish engulfing candle, closing back below ATH on elevated sell volume (~279K).
• Despite the rejection, the breakout bar showed no upper wick exhaustion, so not a blow-off.
• RSI = 63.26 — still bullish but curling down.
• Price is testing the channel midline; Fib extensions (117.4K–118.2K) remain unmet.
Conclusion: Initial breakout was technically valid and volume-confirmed, but price is now under threat.
Loss of 103.9K would invalidate the structure and raise distribution risks.
⸻
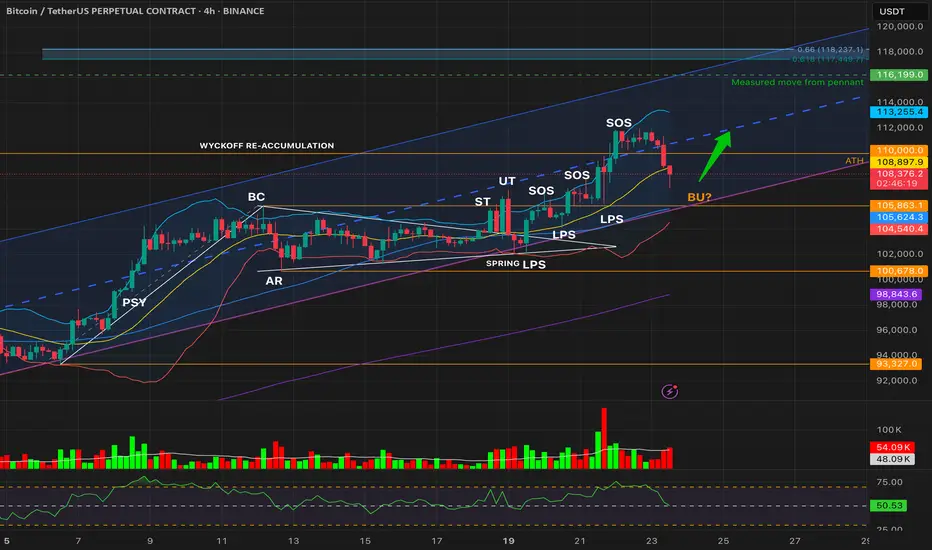
4H Chart
• Price closed 4 times below mid-Bollinger Band — short-term momentum has weakened.
• RSI bounced back above 50, avoiding breakdown territory.
• Volume is tapering (weekend), and price is hovering just above the previous LPS zone.
• Watching for resolution from a potential Backup (BU) retest.
⸻
Wyckoff View
• Still within Phase E of re-accumulation — unless 103–105K breaks decisively.
• Valid structure: Spring → LPS → SOS → BU(?)
• A break below structure = possible UTAD scenario
⸻
Key Levels
• Support: 105,863 / 103,986 / 100,678
• Resistance: 110,000 / 112,100 / 116,199
• Target Extension Zone: 117,449 – 118,237
Backup
BTCUSDT 4H — Re-Accumulation in Play or Breakdown Brewing?Bitcoin is currently testing a critical confluence zone just below the prior ATH breakout (110k). After a clear Sign of Strength (SOS) breakout, price has retraced to retest the:
🔸 Mid Bollinger Band (108.9k)
🔸 Previous ATH breakout zone
🔸 Local channel support & uptrend line
RSI is neutral at 50.76 and volume remains slightly elevated — suggesting a potential BU/LPS retest phase in this Wyckoff re-accumulation.
📉 Breakdown Risk?
So far, no breakdown triggers confirmed per our risk model:
⛔ Price > lower BB (104.5k)
⛔ RSI > 45, not in weak momentum
⛔ No pattern breakdown with RSI < 40
That means no short hedge activated yet — but caution is warranted. A close below 104.5k with weak RSI & volume spike would invalidate the bullish structure.
🎯 Upside Targets if BU Holds:
Resistance: 113.2k (Upper BB)
Measured move from the pennant: 116.2k
Further confluence at 118.2k (Fib 0.66 extension)
🧠 Weekend Watchlist:
Do not trade based on 4H chart to avoid fakeouts and traps. Use it as early signal and confirm with daily close!
🔹 Hold above mid-BB keeps re-accumulation valid
🔹 Breakdown below lower-BB = structural failure
🔹 Volatility likely to spike — stay risk-managed
📚 Still within Wyckoff markup logic unless proven otherwise.
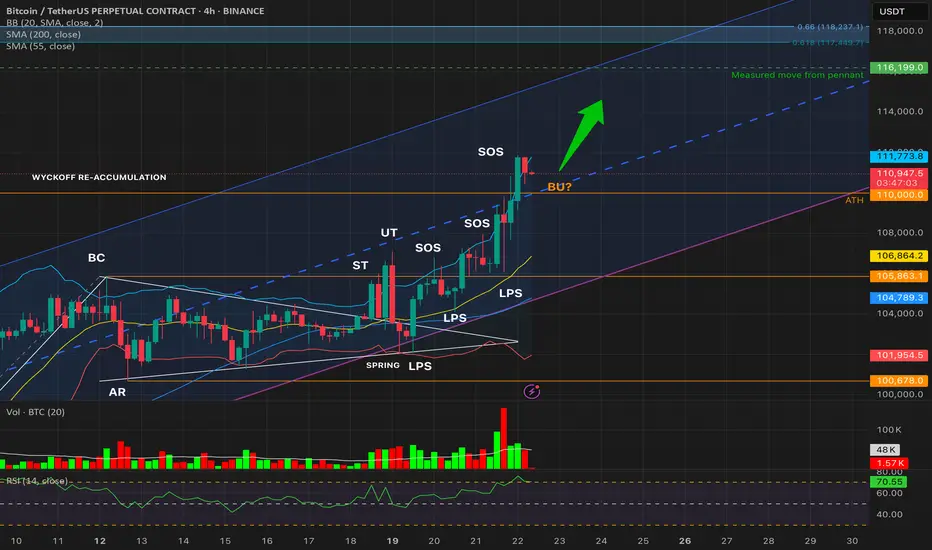
BTCUSDT – Wyckoff Re-Accumulation Breakout ContinuesBitcoin is advancing through a textbook Wyckoff Re-Accumulation structure on the 4H chart. After the Spring and multiple LPS confirmations, price surged above the previous range high (~110k), entering a strong Sign of Strength (SOS) rally.
We now observe:
✅ Second 4H candle close above ATH (110,000)
✅ RSI: 70.9 → Strong bullish momentum
✅ Volume: Above MA during breakout, healthy but slightly declining
✅ Bollinger Bands: Price hugging upper BB (111,227)
✅ Structure forming a Backup (BU?) test near ATH
The current move targets a measured pennant breakout projection:
🎯 TP1: 115,224
🎯 TP2: 116,199
🎯 TP3: 117,449 – 118,237 (Fib extension confluence)
This aligns with Wyckoff Phase E and continuation of the markup cycle.
No short setups valid — trend remains firmly bullish. Pullbacks to 110k could offer high-conviction long entries as BU confirmation.
#Bitcoin #BTCUSDT #Wyckoff #CryptoTA #BTCAnalysis #Reaccumulation #TradingView
GBPJPY will backup, and give us buy signalHey there traders,
Last day GBPJPY fall from 181.3 at 02:00pm (UTC)
It was a sudden fall. No one expect that, that means market will take backup of this fall.....
that could be an awesome buy signal......
Follow us for trading idea's
Be happy......
