BADGER/USDTNew bagholder special. If price closes above the diagonal trendline on a daily basis that would give the green light to start accumulating for a longer term hold. After the break anything near the trendline is a buying opportunity. Targeting around $150 as a final take profit. Will update idea.
Badger


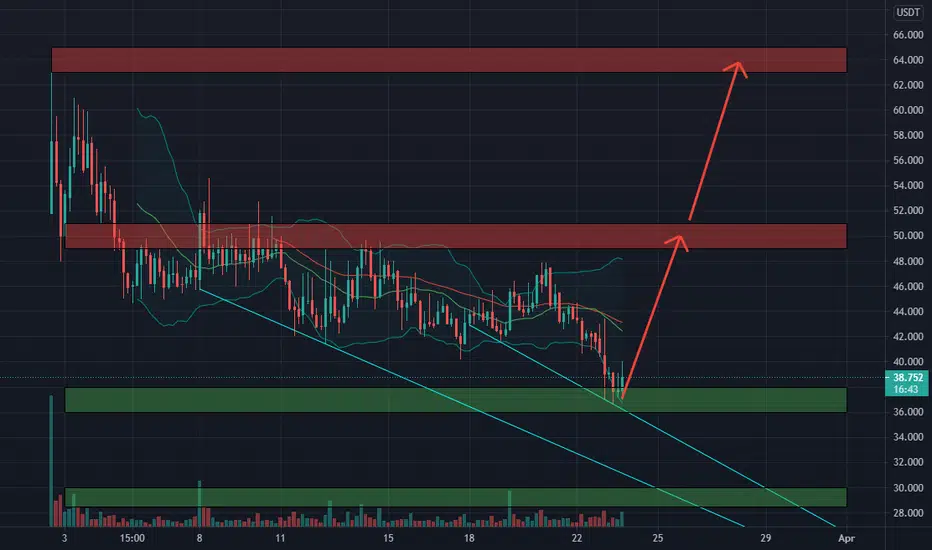
🆓Badger DAO/USDT Analysis (23/3) #BADGER $BADGERThe buying force has appeared at the 36-38$ zone, we can take risk to catch it here for targets : 50$ and 64$ in the next few days
Actually it still can keep dumping to 30$ zone so you should pay attention to this 36-38$ zone
📅EVENTS
👉Mar 24 : NFT Drop
👉Mar 31 : Badger Jersey NFT
📈BUY
-Buy: 36-38$. SL if B
📉SELL
-Sell: 49-51$. SL if A
-Sell: 63-65$. SL if A
♻️BACK-UP
-Buy: 28.5-30$ if A. SL if B
❓Details
Condition A : "If 4H candle closes ABOVE this zone"
Condition B : "If 4H candle closes BELOW this zone"
🔥BADGER divergence#BADGER/USD
📌BADGER divergence
🔹Analytics: the indicators show a completely different picture, bullish divergence on the indicators, I expect good growth soon, just as if you have been trading for a long time, you can see the trend reversal by eye.


BADGER usdt - has it finally broken it's downtrend?Good growth with badger, working it's way from the bottom of the downtrend line.
EMA is trending upwards and candles holding above EMA trendline.
Good trading volumes.
Expect to see it go to the $50 levels soon, so good buying here.

BADGER usdt - still working it's way into a wedgeI don't think it'll break to the upside.
The EMA is downturning on the 1h chart.
Prepare for a slide if you're a badger holder.

BADGER BUYING THE DIPMake suffer once again all of the buyers between 44 and 50 and you will get nice rise up wave only on quick change sentimments

BADGERUSDT (BADGER) - POTENTIAL BUY ENTRY ANALYSIS 🔎
- BADGERUSDT was bounded in the falling wedge pattern.
- A falling wedge pattern is a bullish reversal pattern
- Price brokeout above the falling wedge's resistance as expected.
- The market then retraced for a retest.
- Price is retesting the falling wedge's resistance, ascending trendline support (ATS) and key fibonacci retracement zone (0.5 - 0.618 - 0.786).
- There's a relatively high concentration of buyers at this retest zone.
- The retracement is resisted by the descending trendline resistance (DTR).
- Breakout above this trendline resistance could be a bullish signal.
BUY ENTRY ⬆️
- Breakout above the descending trendline resistance (DTR).
TARGETS 🎯
- Horizontal resistance level (R1).
- Fibonacci extension levels.
- Horizontal resistance level (R2).
SETUP INVALIDATION ❌
- Breakdown below the 0.786 fibonacci retracement level and the ascending trendline support (ATS)

BADGER usdt - To push past 1h resistanceRising EMA from the bottom of market support after a sharp decline since opening on Binance.
Good trading levels.
Expect to see Badger climb to the $50 mark again.


BTC - Following the plan$BTC - Was it really that simple? A few basic lines on a chart? I think so. Let it play out.

BADGER impossible LONGWeekend pump on low volume doesnt allow to go through 50$ and reject price.
Relative strangth is bit oersold, but its nothing if bitcoin continue its journey to 30000$
BADGER fills BAD like other crypto
I am on denial level and very upset about my 49$ long, so this idea fiils sick
Maximum pain levels are 10-20$


$BTC Draining the Excess LeverageMy $BTC prediction. Pain for 1-2 weeks, recovery, pullback, resume uptrend. Too much euphoria on CT.

$BTC UpdateIf you're bullish on $BTC, you would want it to play out something like this. A washout to $38-$42k is preferred for the next leg up. Get rid of the paper hands, while diamond hands add to their sat stack.

Badger hold the line and send it to the MOONWe are holding on to the 100 ema tightly on BADGER/USDT. A strong bounce will take us to new highs HODL


Bearish on BadgerSeeing a head and shoulder pattern. Feel like going to be very bearish and see a decline. Bitcoin speculation to also hit $45k before a bounce back. So makes sense.

Bullish outlook for ETH/BTC and AltsI'm seeing pretty heavy support here on the ETH/BTC pairing at these two levels. Lots of bearish tweets on Ethereum makes me think capitulation comes next and then a rocket. Another BTC.D dip while the bitcoin price stays steady or makes a slow move above 50k would be glorious for other large and midcaps. I have my eyes on Link and Badger, especially from the fundamental sides.
