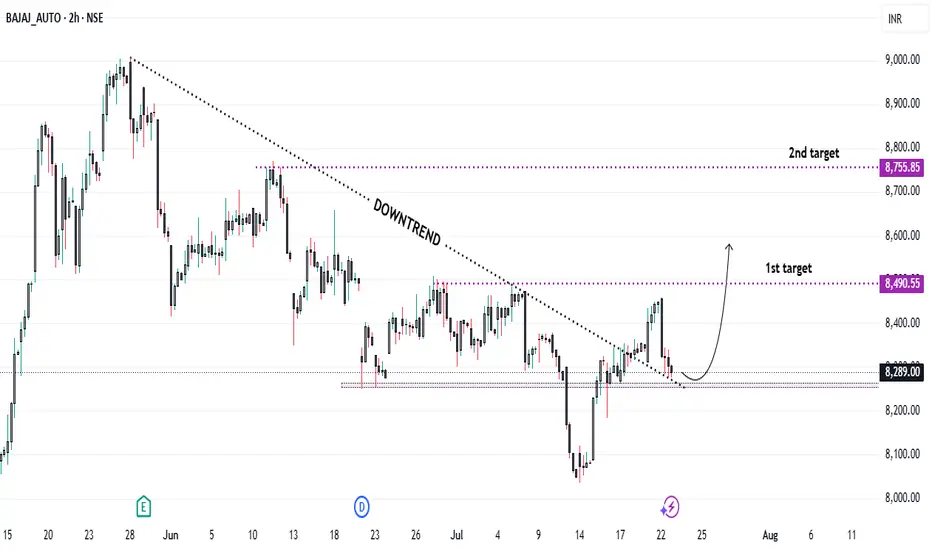
Trendline Breakout in Bajaj Auto: Buy Opportunity...?* Trend Overview:
* The stock has been in a downtrend over the past 2 months.
* Recently, it has broken the downward trendline and successfully retested the breakout, indicating a potential reversal.
* Current Price Action:
* Breakout above trendline confirms bullish momentum.
* The retest held above the trendline, adding further confidence for long positions.
* Support & Stop-Loss:
* Key support level identified at ₹8,250 – has acted as a demand zone in recent sessions.
* A stop-loss should be placed just below ₹8,250 to manage risk effectively.
* Target Levels:
* 🎯 Target 1: ₹8,490
* 🎯 Target 2: ₹8,755
* Important Note:
* ⚠️ Due to ongoing global geopolitical tensions, the overall market may remain volatile.
* Trade with proper risk management and position sizing.
Bajajauto
BAJAJ AUTO LTD – Trendline Breakout with Upside Potential NSE:BAJAJ_AUTO – Trendline Breakout (The setup offers a favorable risk-reward ratio, with potential for ~500+ points upside from the breakout zone.)
Chart Type: Daily (1D)
Current Price: ₹8,455
Structure: Falling wedge breakout with defined targets
Falling Wedge Formation:
The price has been consolidating within a falling wedge pattern, indicating a potential bullish reversal.
Both upper and lower trendlines (labeled as "small down trend") have been respected multiple times, validating the structure.
Breakout Confirmation:
A breakout above the descending trendline has occurred, accompanied by a bullish candle closing above the immediate resistance zone around ₹8,407.
This marks the breakout point and indicates a shift in momentum.
Support Zone:
Strong support has been established near ₹8,225.55, as marked on the chart.
This level can serve as a stop-loss for bullish positions.
-----
BUY: above 8410-8450
SUPPORT ( SL ) : 8220
RESISTANCE ( TGT) :8640-8780-9000+++


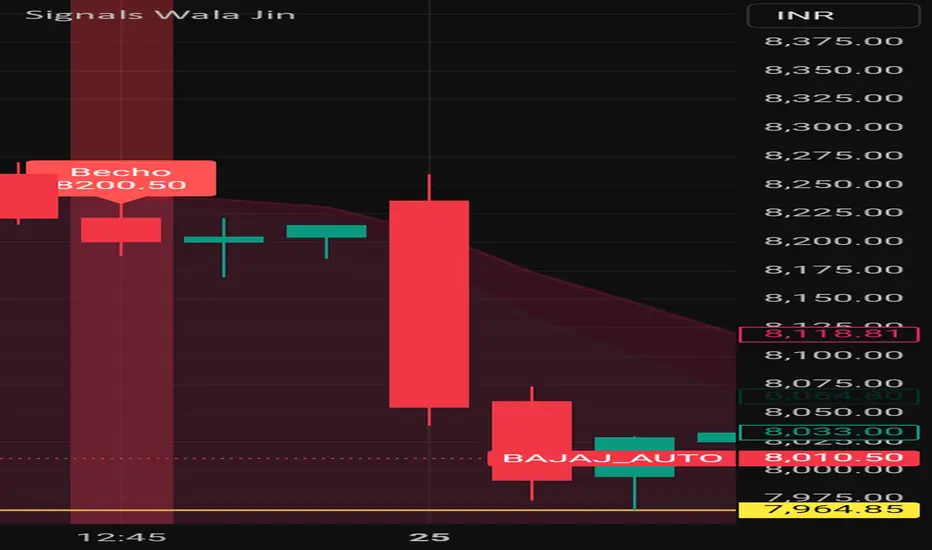
235 rupees dropped #BajajAuto share after signal 235 points dropped #BajajAuto share after generation of Signal "Becho" means sell by my custom designed indicator named SignalsWalaJin
Note: This is not a buy sell trade call. Trade at your own will. Use stop loss too.
$BAJAJAUTO: Bajaj Auto – Wheeling to Wealth or Spinning Out?(1/9)
Good afternoon, everyone! ☀️ $BAJAJAUTO: Bajaj Auto – Wheeling to Wealth or Spinning Out?
With BAJAJAUTO at ₹7,711.25 post-CEO nod and ₹1,500 crore boost, is this two-wheeler titan revving up or stalling? Let’s ride into it! 🔍
(2/9) – PRICE PERFORMANCE 📊
• Current Price: $ 7,711.25 as of Mar 19, 2025 💰
• Recent Move: Up 1.64% on news, below $12,774 high, per data 📏
• Sector Trend: Auto sector steady, with two-wheeler demand in focus 🌟
It’s a smooth ride—value might be in gear! ⚙️
(3/9) – MARKET POSITION 📈
• Market Cap: Approx ₹2.12 lakh crore (web ID: 6) 🏆
• Operations: Two-wheelers, financing via subsidiary ⏰
• Trend: Leadership stability, credit growth, per data 🎯
Firm in its lane, with expansion in sight! 🚴♂️
(4/9) – KEY DEVELOPMENTS 🔑
• CEO Re-appointment: Rajiv Bajaj for 5 yrs from Apr 1, per data 🌍
• Investment: ₹1,500 crore into Bajaj Auto Credit Ltd., per data 📋
• Market Reaction: Stock up, signaling confidence 💡
Revving up leadership and capital! 🛵
(5/9) – RISKS IN FOCUS ⚡
• Market Volatility: Trade tensions, economic shifts 🔍
• Competition: Hero MotoCorp, TVS pressure sales 📉
• Rates: Rising costs could hit demand ❄️
It’s a twisty road—watch the turns! 🛑
(6/9) – SWOT: STRENGTHS 💪
• Brand Power: Two-wheeler leader in India 🥇
• Subsidiary Growth: Credit arm expansion, per data 📊
• Dividend: Steady payouts attract income fans 🔧
Got horsepower to spare! 🏍️
(7/9) – SWOT: WEAKNESSES & OPPORTUNITIES ⚖️
• Weaknesses: Below peak, macro risks 📉
• Opportunities: Two-wheeler demand, financing growth 📈
Can it accelerate or hit a bump? 🤔
(8/9) – POLL TIME! 📢
BAJAJAUTO at ₹7,711.25—your take? 🗳️
• Bullish: ₹9,000+ soon, growth kicks in 🐂
• Neutral: Steady, risks balance out ⚖️
• Bearish: ₹7,000 looms, market stalls 🐻
Chime in below! 👇
(9/9) – FINAL TAKEAWAY 🎯
BAJAJAUTO’s ₹7,711.25 price reflects confidence 📈, but volatility’s in the air 🌿. Dips are our DCA fuel 💰—buy low, ride high! Gem or bust?

BAJAJ AUTO Shortterm VIEW BEARISHAfter a good run from Rs.4,000 (in APRIL 2023) Stock has doubled and more to Rs.10,000.
Along the journey We have seen small consolidations at Rs.8,500-9,300 and stock reached Rs.10k After that we have seen a small dip towards 8,800.
Now its forming a HNS Pattern in Weekly TF.
I expect a Downside correction to 7,000-7,300 Zone.
I also believe Automobile Sector will go through some consolidation.

BAJAJ FINANCE Bullish PatternBajaj finance
weekly Breakout
buying level 7440
target as show in chart
stoploss follow

Buy Bajaj Auto Short Term Trading Advice by Goodluck Capital
Buy Bajaj Auto
Buy Range- 9400 - 9600
Target- 10200 - 10400
StopLoss- below 9000
Potential Return- 7-9%
Approx trade duration 14 - 15 days

BAJAJ AUTO LTD - NSE (BAJAJ-AUTO) ForecastThe stock chart for BAJAJ AUTO LTD - NSE (BAJAJ-AUTO) reveals interesting patterns and potential trading strategies:
1. Symmetrical Triangle Pattern:
- The chart displays a symmetrical triangle formed by converging trend lines.
- This pattern suggests a continuation of the existing trend.
- Traders should wait for a breakout from this triangle before making any moves.
2. Trading Strategies:
- Long Position:
- Consider buying if the price moves above a certain level.
- Target price for a long position: 3900.
- Short Position:
- Sell short if the price falls below a specific level.
- Target price for a short position: 3500.
3. Current Price:
- BAJAJ AUTO LTD is currently trading at 8948.20.
Remember, this analysis is based on technical patterns, and actual market behavior may vary. Always use additional indicators and risk management techniques when trading stocks.


BAJAJ AUTOBelow are some support and resistance levels for BAJAJ AUTO stock. Currently, it is moving within a range.

Is Bajaj Auto Going to crash ?Bajaj Auto is At All Time High !!
Stock is in a Rising Channel and Prices are around the resistance
Resistance level is around 8500-8600
Previously we can observe that prices showed correction around 40% from the Resistance of the Channel
So can we expect the same fall ??
Lets see !!
WE ARE ATLEAST NOT BULLISH AT THIS TIME !!

BAJAJAUTO
NSE:BAJAJ_AUTO
One Can Enter Now ! Or Wait for Retest of the Trendline (BO) Or wait For better R:R ratio
Note :
1.One Can Go long with a Strict SL below the Trendline or Swing Low of Daily Candle.
2. Close, should be good and Clean.
3. R:R ratio should be 1 :2 minimum
4. Plan as per your RISK appetite
Disclaimer : You are responsible for your Profits and loss, Shared for Educational purpose

BAJAJAUTONSE:BAJAJ_AUTO
One Can Enter Now ! Or Wait for Retest of the Trendline (BO) Or wait For better R:R ratio
Note :
1.One Can Go long with a Strict SL below the Trendline or Swing Low of Daily Candle.
2. Close, should be good and Clean.
3. R:R ratio should be 1 :2 minimum
4. Plan as per your RISK appetite
Disclaimer : You are responsible for your Profits and loss, Shared for Educational purpose

BAJAJ AUTO 1 HOUR SHORTBajaj Auto
1 hour : Price has tapped on Decisional supply zone.
watch for confirmation on 5 min timeframe and we can see short term downside momemtum.
Watch for an intraday opportunity..
Thank You....!

Bearish on Bajaj AutoBajaj Auto (NSE Ticker: BAJAJ_AUTO) is forming two back to back bearish patterns on the hourly chart.
First bearish pattern: Broadening formation
Second bearish pattern: Head & Shoulders
We see high probability of fall in price in the coming days toward measured move and 200SMA target of 4410.

BAJAJAUTO MAKE OR BREAK LEVEL👉Make or Break level
👉Price near the resistance Zone 4255--4360
👉If price respects resistance than good fall possible
👉If breaks resistance good move towards upside possible
👉Keep it on radar 👍


BAJAJ AUTO - Bullish Consolidation Breakout with VolumesNSE: BAJAJ AUTO is closing with a bullish consolidation breakout candle supported with volumes.
Today's volumes and candlestick formation indicates strong demand and stock should move to previous swing highs in the coming days.
The stock has been moving along the trendline support for the past few days which is indicating demand.
One can look for a 8% to 11% gain on deployed capital in this swing trade.
The view is to be discarded in the event of the stock breaking previous swing low.
#NSEindia #Trading #StockMarketindia #Tradingview #SwingTrade
Disclaimer:
This is for educational purposes only.

BAJAJAUTO bullish move possible..
BAJAJAUTO bullish move continuation possible..
Multiple Confluence Points:
1. Demand Zone Reversal
2. Channel Continuation
3. Double Bottom Breakout & Retest Done
4. Break of Market Structure (Trend Changed)

Bajaj Auto Focus on Bajaj Auto.
1st Target ₹3998
2nd Target ₹4123
Note : This is just for Backtesting and Educational Purpose Only.

EMA200 +Supertrend crossover for Bajaj Auto - 15 Minutes chart
EMA200 +Supertrend crossover for Bajaj Auto - 15 Minutes chart

BAJAJ-AUTO - Supply emerged at 4100 in Sep'22This was after being range bound in 3000-4000 for 2 years
Plan ahead => could consider to Buy above 4000
- and/ or Rejections near 3000
PB 4x
PE 18x
ROCE 23
DivYld 4%
