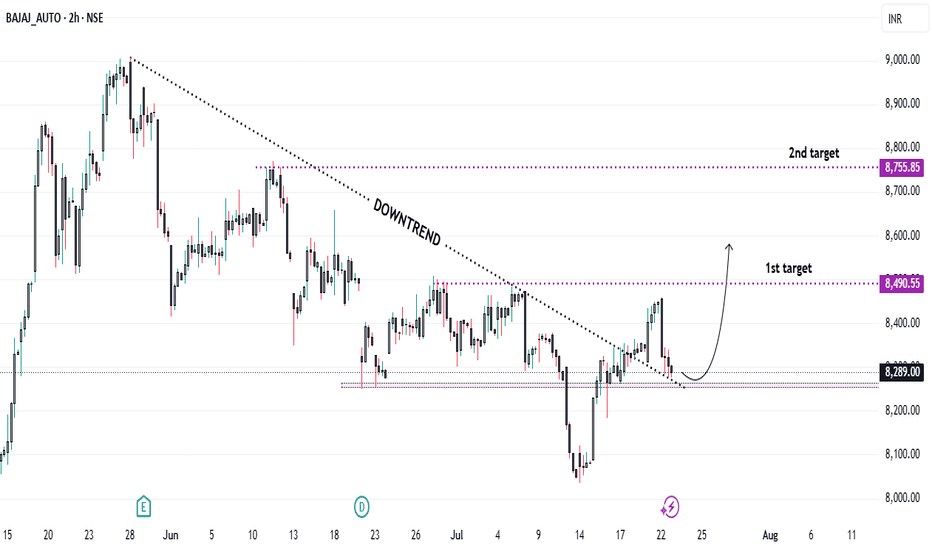
Trendline Breakout in Bajaj Auto: Buy Opportunity...?* Trend Overview:
* The stock has been in a downtrend over the past 2 months.
* Recently, it has broken the downward trendline and successfully retested the breakout, indicating a potential reversal.
* Current Price Action:
* Breakout above trendline confirms bullish momentum.
* The retest held above the trendline, adding further confidence for long positions.
* Support & Stop-Loss:
* Key support level identified at ₹8,250 – has acted as a demand zone in recent sessions.
* A stop-loss should be placed just below ₹8,250 to manage risk effectively.
* Target Levels:
* 🎯 Target 1: ₹8,490
* 🎯 Target 2: ₹8,755
* Important Note:
* ⚠️ Due to ongoing global geopolitical tensions, the overall market may remain volatile.
* Trade with proper risk management and position sizing.
Bajajautoanalysis
BAJAJ AUTO LTD - NSE (BAJAJ-AUTO) ForecastThe stock chart for BAJAJ AUTO LTD - NSE (BAJAJ-AUTO) reveals interesting patterns and potential trading strategies:
1. Symmetrical Triangle Pattern:
- The chart displays a symmetrical triangle formed by converging trend lines.
- This pattern suggests a continuation of the existing trend.
- Traders should wait for a breakout from this triangle before making any moves.
2. Trading Strategies:
- Long Position:
- Consider buying if the price moves above a certain level.
- Target price for a long position: 3900.
- Short Position:
- Sell short if the price falls below a specific level.
- Target price for a short position: 3500.
3. Current Price:
- BAJAJ AUTO LTD is currently trading at 8948.20.
Remember, this analysis is based on technical patterns, and actual market behavior may vary. Always use additional indicators and risk management techniques when trading stocks.
BAJAJ AUTO | Use the Buy Opportunity.When it comes to the technical analysis of BAJAJ AUTO LTD, you might get an impulse to the downside. Based on my technical analysis, it is still in uptrend. If you are going in, better find a pullback. I have marked a good entry area on the chart; you may use it as an entry area. And also don't forget to place the stop just below the entry area.
What do you think is more likely to happen? Please share your thoughts in comment section. And also give a thumbs up if you find this idea helpful. Any feedback & suggestions would help in further improving the analysis.
If you find this technical analysis useful, please like & share our ideas with the community.
Good Luck!
Disclaimer!
This post does not provide financial advice. It is for educational purposes only! You can use the information from the post to make your own trading plan for the market. But you must do your own research and use it as the priority. Trading is risky, and it is not suitable for everyone. Only you can be responsible for your trading.


