Band

BANDUSDTCup and handle pattern looking bullish
Personally waiting for breakout to enter
###NOT FINANCIAL ADVICE###

Band Protocal (BAND) Break Out Retesting All Time Highs SoonIn the oracle realm of the cryptocurrencies Band Protocol is the second largest oracle coin right under the leader Chainlink (LINK) that is bound to be picked up and re-test those all time highs. Band Protocol has approached a very important level today as it has slightly broken out of $11.50 resistance zone that has held strong since September 4th 2020. We traded for at a high of $11.80 before coming back down to current levels.
Today we hit the 0.5 Fibonacci Retracement level and now we're trekking towards the 0.618 Fibonacci level putting us at around $12.25 for our next target. We also hit a daily bullish divergence on the MACD as well indicating we may be positioned for a strong breakout within the next week or two.
Band Protocol only has a market capitalization of around 230 million dollars while Chainlink's is around 8.9 billion dollars. As being the second biggest leader in the oracle space Band Protocol will be poised for a lot of growth this year especially as the use case for oracles continues to accelerate. Oracles allow ways for a blockchains and smart contracts to interact with external data.
Oracles will be an essential part of the evolution of cryptocurrencies and growth of Decentralized Finance (DeFi). Band Protocol is the second biggest Oracle, still well under a 1 billion dollar market capitalization, and has a Coinbase listing. Keep Band Protocol on your radar for 2021.
Current Support Level: $9.00
Current Resistance Level: $11.80
Cheers! Much peace and love!

BANDBTC on it's way upVery simple TA, broke out of descending trendline, moving up to the next ranges. Retested the trendline and the channel support with a wicked scam wick which I imagine whipped out a lot of longs.
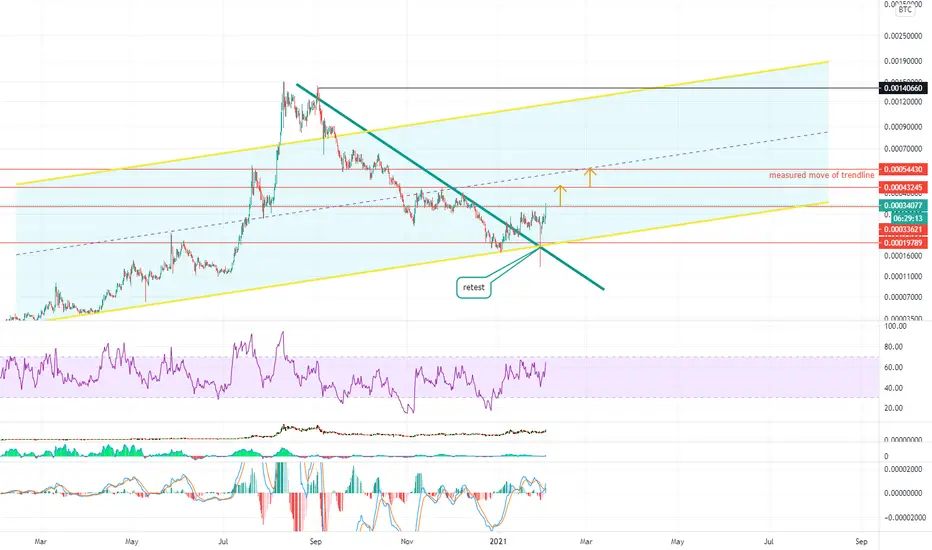


$BAND - Uber Bullish??$Band broke the pennant and with the next candle retested and closed above
IMO, good for $12.5, with measurement method taking us to $14 let' see!


BANDUSDT (BAND) - POTENTIAL BUY ENTRY ANALYSIS 🔎
- BANDUSDT is printing an ascending triangle pattern.
- This is a bullish build up pattern.
- There's an upward breakout potential.
BUY ENTRY ⬆️
- Breakout above the ascending triangle's horizontal resistance.
TARGETS 🎯
- Fibonacci extension levels.
SETUP INVALIDATION ❌
- Breakdown below the ascending triangle's inclined support.

BAND Possible targets for 2021BAND Possible targets for 2021
TARGET1: 28$
TARGET2: 48$
TARGET3: 98$
TARGET4: 270$
STOP LOSS: UNDER 4.8$


BANDUSDT (BAND) - POSSIBLE PRICE ACTIONSANALYSIS 🔎
- BANDUSDT is consolidating in a symmetrical triangle pattern .
- A relatively big move is imminent.
- There's a breakout potential.
POSSIBLE PRICE ACTIONS
- Uptrend ⬆️: breakout above the symmetrical triangle's inclined resistance.
- Downtrend ⬇️: breakdown below the symmetrical triangle's inclined support.
TARGETS 🎯
- Uptrend ⬆️: Horizontal resistance levels (R1, R2).
- Downtrend ⬇️: Horizontal support levels (S1, S2).

Trading a Ranging MarketBAND has broken its previous consolidation range only to enter another range. Let’s take a look at how you can take advantage of a ranging market!
BAND Price Action
BAND was one of the best performing cryptocurrencies in the first half of 2020. However, after its crash in September, the cryptocurrency has yet to regain its strong momentum. The token has ranged between $5 and $7.5 for almost four months. On January 6th, it finally broke this range, only to enter another one, this time between $7.5 and $11.5. Let’s now take a look at a strategy you can use to take advantage of this.
Ranging Market Strategy
You can use Williams %R on the 4h chart to find oversold zones and then use the MACD on the 1h chart to enter when the reversal is taking place. In short, the strategy works like this: when the Williams %R shows overbought on the 4h chart, take the next MACD buy signal on the 1h chart.
As displayed in the chart above, this strategy can identify some great reversals. When it does identify reversals, the strategy can make significant gains. On the other hand, you may also get some “fake signals” that are too early and bring about large losses. Therefore, it is probably best to go with a tight stop loss to minimize losses, and a wide profit target and trailing stop loss to take full advantage of reversals.
Disclaimer: This is just one example of a strategy that you can use to trade a ranging market, and is not a recommendation. Using this strategy in a bearish market will probably lead to more losses than gains. Suppose you want to use it in a bullish market instead. In that case, you can add the MESA or any other trend-following indicator on the daily chart, to make sure you only take trades in the direction of the trend.

Band Protocol accumulating. 70% move to upside. $BANDBand Protocol accumulating. 70% move to upside.
Above resistance first target around $18
$BAND COINBASE:BANDUSD

#BAND/USDT
🔶 #BAND/USDT 🔶
Long/Buy
Entry Zone:
6.97 - 7.77
🎯 Take-Profit Targets:
1) 8.34 - 40%
2) 9.54 - 30%
3) 10.99 - 30%
⛔️ Stop : 5.90
🔴 High Risk
@crypto_Grifin

Band 2021 price targets With a current circulating supply of 20,494,033 Band tokens and a max of 100,000,000 Band tokens, it will be very interesting to see Band, which Is also in the Oracle tech space as Chainlink, compete and carve out its own market share. Chainlink has 405 million tokens in circulation with a max of 1 Billion. I believe that Band is on the Cosmos platform and also rewarding its users with a handsome staking reward which is an incredible incentive for long-term holding. Right now Band is in a similar channel as many other Altcoins and several price targets are a possibility given the scarcity, the backing of Band by well-known investors, and the growing Oracle/Dataspace.
Could Band achieve between $250 and $1,000 on this next Bitcoin bull run? We will see.

$BAND/USDT 3h (Binance Fut.) Parallel channel facing resistanceBand Protocol lost its support, I believe it will retrace down further to lower-line or near after a last impulse.
Current Price= 8.7404
Buy Entry= 8.7397 - 8.9909
Take Profit= 8.2719 | 7.7735 | 7.1819
Stop Loss= 9.3710
Risk/Reward= 1:1.2 | 1:2.19 | 1:3.37
Expected Profit= +13.50% | +24.72% | +38.06%
Possible Loss= -11.28%
Fib. Retracement= 0.618 | 0.786 | 1
Margin Leverage= 2x
Estimated Gain-time= 240h

BAND/USDT Bearish Triangle In The MakingWith the recent plunge of Bitcoin, BAND/USDT has failed to reach the previous swing highs around $11.50, sending the price back down.
With this recent fall of BAND, we can see the early signs of a bearish triangle in development. The target for this trade setup is the support line marked on the chart, since it's the bottom of the bearish triangle.
Happy trading!

BAND/BTC Bullish Channel From All Time LowLike a lot of other X/BTC pairs, BAND/BTC is seeing some amazing movement in the last couple of weeks. Since the start of 2021, it has formed a nice bullish channel in which it's trading. Today, we see some good price action going on, indicating that there's much more to come for this pair.
Since it's difficult to predict where the price will hit the upper trend line of the channel, I've marked two resistance areas of interest, based on previous highs, R1 and R2. Feel free to place your own targets.
Happy trading!

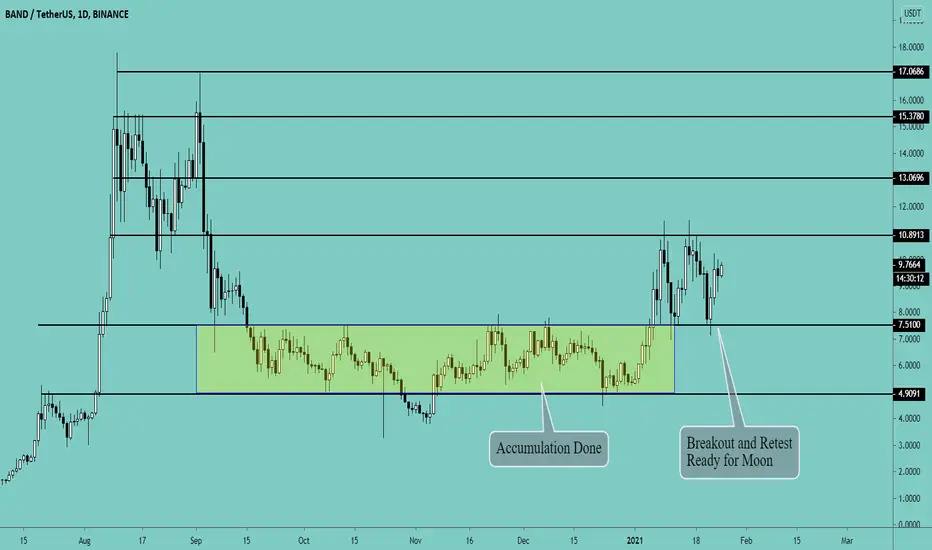
Band Protocol Ready for New All-time highBand Protocol is an Oracle + DeFi coin. Oracle coins are pumping hard with LINK and DeFi is still in trend. We expect BAND will follow LINK and DOT. There is a lot of accumulation done on BAND and now it is breaking out. The breakout is confirmed and retested in the support zone. There is only one way to go now... Moon
Buy Zone: $9.5 - $9.7 (Add more if drops to $7.5)
Target: $10.88- $12.3 - $13.06- $15.35 - $17
BAND waiting for trendline breakout BAND / USDT
Just wait for trendline breakout before buy
1daily candel close above can add more confirmations
Good luck

