BANDUSDT formed bullish BAT | Upto 44% expectedIn my previous post of BAND with US dollar pair we have seen that on short term hourly based chart the BAND formed bullish Cypher pattern and as per prediction the priceline took a powerful bullish divergence from buying zone and produced more than 10% profit on this very short term chart.
Formation of new BAT pattern:
Now again on short term 6 hour chart the price action of BAND has formed bullish harmonic BAT pattern and entered in potential reversal zone.
Buying And Sell Targets:
The buying and sell targets according to harmonic BAT pattern should be:
Buy between: $0.8835 to $0.8309
Sell between: $1.0088 to $1.1982
Stop Loss:
The potential reversal zone area that is up to $0.8309 can be used as stop loss in case of complete candle stick closes below this level.
Possible profit and loss ratio:
As per above targets this trade has the profit possibility of 44% and as per above mentioned stop loss, the loss possibility is 6%.
Note: This idea is education purpose only and not intended to be investment advice, please seek a duly licensed professional and do you own research before any investment.
Band

BANDBTC Just Bounced From a Very Strong Support ZoneHey all, here’s another entry on my tradingview series called 'Quick Updates'.
BAND Just hit this very strong support zone for the fourth time. We can go in for a nice support and resistance trade set-up. I used a trendline this time as resistance instead of a horizontal resistance zone that I normally use, because the bulls has been facing more difficulties recently. There is slowly a descending triangle pattern forming, to create the maximum chance of getting a successful trade out of this I decided to place the take profit slightly more conservatively.
--- What is The Quick Update Series All About? ---
I have started a new tag (quickupdates) where I quickly share great opportunities based on TA for shorter timeframes, such as 4h, 1h, and 15m. It will contain a brief explanation with clear and clean charts in order to keep the velocity up and make sure you get to see the opportunities as fast as possible.
Follow me for consistent high quality updates, with clear explanations and charts.
Please like this post to support me.
- Trading Guru
--------------------------------------------------------------
Disclaimer!
This post does not provide financial advice. It is for educational purposes only!


BAND / BTC Short to Mid Term Hold IdeaBAND In Search Of New Highs Riding on a Parabolic Curve Pattern Short to Mid Term Hold Idea

BAND Indicators Analysis (Target Mapped With Support Levels)My fellow supporters, here we have the chart for BANDBTC... Looks like the retrace is complete and the candles are back to going GREEN.
The MACD for BANDBTC looks really bullish on the daily timeframe, let's take a closer look:
We have a widening ascending channel.
The histogram is green.
There is a bullish cross on the MACD.
Signal and MACD are gaining momentum while trending higher.
The RSI is also strong:
Here we have a long-term uptrend... Higher highs and higher lows.
Thanks a lot for your continued support.
Namaste.

Double Bottom on the way!!!A good double bottom pattern is going to form on 4H chart of BANDBTC.
Bottoms are on 6930 area which has overlap with 0.5 fibo. level So it assumed to be a strong support.
Neckline is around 7200 sat, if the price break the neckline then the target will be achieved easily.
target of the double bottom is around 7520 area as depicted on the chart.
one can open the position at the moment or wait for neckline breakout. trade on your own risk.
Happy Hunting!!!

BANDBTC With a 30% Opportunity On The 60m! [QUICK UPDATES]Hey all, here’s another entry on my tradingview series called 'Quick Updates'.
The price of the extremely volatile BAND coin is currently moving between the areas of resistance (0.0000600) and support (0.0000415). Since we've seen the price bouncing off this support zone multiple times before, and we also observe a confirmatory bounce on the current hit of the resistance zone, this seems like a good entry for a bullish scenario.
Since the price is so volatile at the moment, fantastic gains are to be made here. But also big losses, you know how it goes. Be careful out there peeps!
Some quick words about BAND:
Band Protocol is a data governance framework for Web3.0 applications operating as an open-source standard for the decentralized management of data. They aim to band communities together with open and reliable data source through decentralized curation protocol.
--- What is The Quick Update Series All About? ---
I have started a new tag (quickupdates) where I quickly share great opportunities based on TA for shorter timeframes, such as 4h, 1h, and 15m. It will contain a brief explanation with clear and clean charts in order to keep the velocity up and make sure you get to see the opportunities as fast as possible.
Follow me for consistent high quality updates, with clear explanations and charts.
Please like this post to support me.
- Trading Guru
--------------------------------------------------------------
Disclaimer!
This post does not provide financial advice. It is for educational purposes only!
About the links below:
20% Discount on Binance: Did you know that Binance introduced a new system where you can get 20% discount on your fees? Find the step-by-step guide on how to add it to your account on the website of 100eyes
Forex & Crypto Scanner: Nobody can keep track of all the pairs on all timeframes. This scanner works on Telegram and sends an automated message including a chart every time something happens to a coin. E.g. it can automatically detect areas of support and resistance, RSI Divergences, Fib Retracements, and more.
Recent success stories:

BAND Vs TetherUS Chart Mapped (333%+ Target)Band Protocol (BAND) Overview
About Band Protocol
Band Protocol offers a decentralized data oracle by making data readily available to be queried on-chain, using delegated proof of stake ("dPoS") to ensure data integrity. It aims to be the go-to data infrastructure layer for Web 3.0 applications by providing decentralized, curated off-chain data to smart contracts through oracles managed by its dPoS consensus mechanism.
------
BANDUSDT (Band Protocol) is looking pretty strong with prices trading above all EMAs on high volume.
This altcoin pair can easily continue to grow.
On a drop, the first support is found at EMA10 or $0.4167.
A bounce can happen at this level.
If prices go lower, the next support is marked where you see EMA50 and all the other EMAs ($0.3533 - $0.3212).
Our targets are marked on the chart.
If you zoom out you can find additional targets or check the chart below.
BAND / TetherUS Weekly (W) |
Here we have a strongly bullish chart.
Last week printed the biggest volume bar ever for BANDUSDT.
The TD Sequential is bullish. The MACD and RSI as well.
I've also marked 333% potential profits from current to the 3.618 Fib. extension level.
Thanks a lot for reading.
Namaste.


$BAND, Falling below ~4900 sats support level$BAND
Falling below ~4900 sats support level (potential S/R Flip) w/ UCTS Sell signal on the 6H
If continuation happens from here, Aiming for ~4000 sats as next support..
#BAND

$BAND, Currently reaching High from December '19..$BAND
50% since our setup on Feb 18
Currently reaching High from December '19 & trying to cross above it..
RSI reaching overbought / UCTS buy signals on 1/2D
Buying against resistance looks risky, but looking for potential breakout/flip as entry
#BAND


$BAND,Sitting over support at ~3050sats matching EMA50 on the 1D$BAND
Sitting over support at ~3050sats matching EMA50 on the 1D
UCTS Buy signals on the 1/2D
On lower TFs seeing bullish divergences around RSI & MACD
Previous iterations with this level lead to a bounce back to ~4k (20%+)
Due to #BTC activity I will use a tight SL
#BAND

BAND ANALYSIS (RETRACE IN PROGRESS!)BAND ANALYSIS:
BAND has been rejected since hitting a top at over 3870 sats! BAND is now struggling to maintain above the 50MA after one small bounce. I expect BAND to retrace a bit further down to a potential buy zone and what could be a short term support line at 3000-3150 sats. This is a great entry point, as a double top would then be expect at T1 of 3602 sats, and lastly T2 at 3710 sats. The volume saw a major sell wick and has been decreasing along side the retrace. The current relief rally should give out and fall further into the buy zone. Stagger long bids inside this zone!
Potential buy zone: 3000-3150 sats

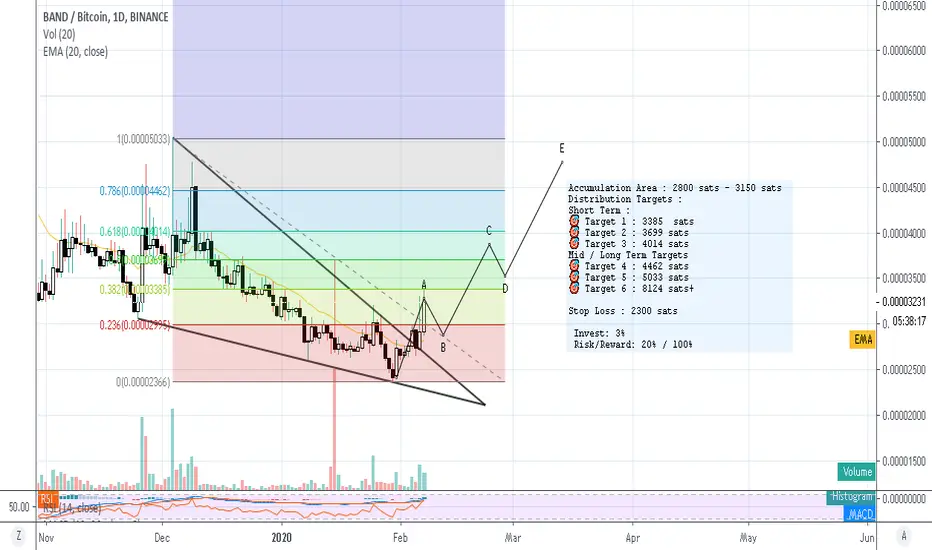
BAND : Upto 75% Profits Opportunity In The Mid TermAccumulation Area : 2800 sats - 3150 sats
Distribution Targets :
Short Term :
🎯 Target 1 : 3385 sats
🎯 Target 2 : 3699 sats
🎯 Target 3 : 4014 sats
Mid / Long Term Targets
🎯 Target 4 : 4462 sats
🎯 Target 5 : 5033 sats
🎯 Target 6 : 8124 sats+
Stop Loss : 2300 sats
Invest: 3%
Risk/Reward: 20% / 100%
$BAND, Crossing over ~3000 sats resistance$BAND
Crossing over ~3000 sats resistance on a volume spike, reaching to EMA50 on the 1D
UCTS Slowly showing buy signals on LTFs...
Holding this level or R/S Flip as potential entry
Breaking above descending trendline could be also a trigger
~4k sats as target (30%)
#BAND

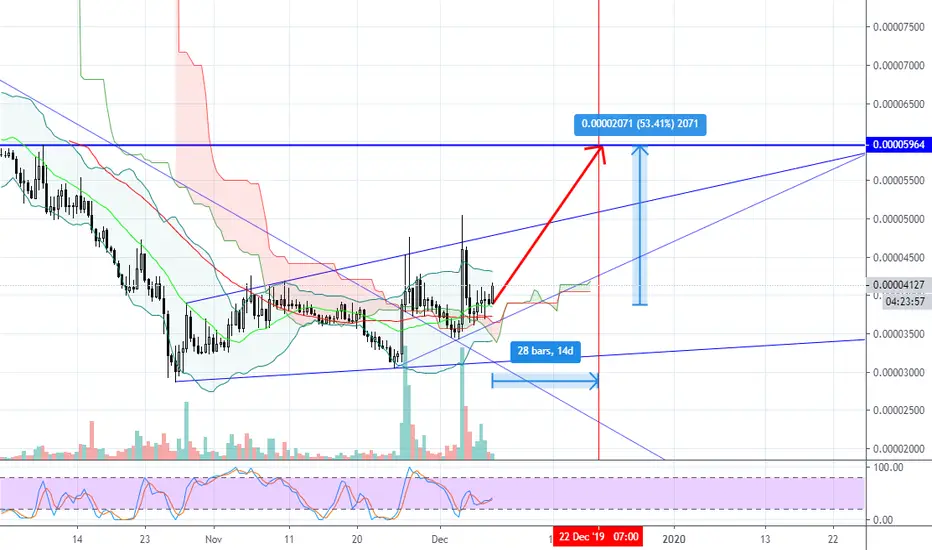
BAND (Dec 34) - 30% in 6 Days, Max 77%#BAND/BTC (Binance)
Entry Zone: 3300 - 3400
Take Profits: 3600 - 3900 - 4200 - 4500 - 5000 - 5500 - 6000
Stop Loss: 2850
BAND / Bitcoin | Channel for ProfitsDirection: Long
Duration: Mid
Risk: Medium
I will try to buy near 3600 (gray zone)
Selling targets
3722 (20% position)
3860 (25% position)
4000 (15% position)
Mid term Sell
4200 (30% positon)
4500 (10% position)
Stop loss under 3400 daily closing price.


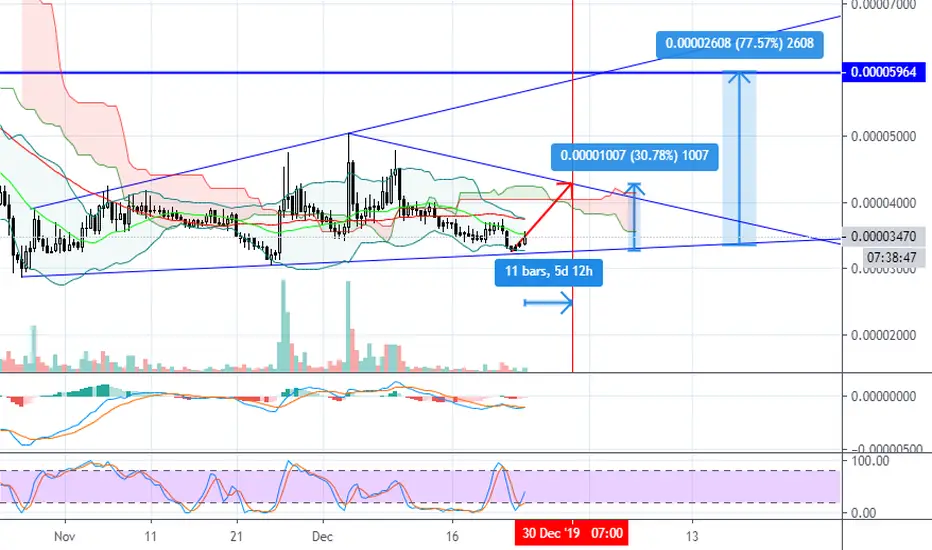
BAND (Dec 08) 53% PProfit in 14 Days#BAND/BTC (Binance)
Entry Zone: 4000 - 4100
Take Profits: 4500 - 5000 - 5500 - 6000
Stop Loss: 3650
BAND Starts To Move | Great Potential Long-Term (160%+)BAND (BANDBTC) just broke above EMA10 on high volume.
Here we can see the potential path mid-term and also the next short-term move.
BANDBTC can climb up straight and 0.00004792 or even 0.00005969 before retracing.
After breaking above EMA10, there is also the possibility of a short retrace, multiple days long, before the next strong bullish move.
The early signals though are telling us that December can be a really good month for BANDBTC.
Stay tuned, as this will grow a lot like the other altcoins that are going full green.
Namaste.

