BANDUSD


$BAND - Uber Bullish??$Band broke the pennant and with the next candle retested and closed above
IMO, good for $12.5, with measurement method taking us to $14 let' see!

BANDUSDT (BAND) - POTENTIAL BUY ENTRY ANALYSIS 🔎
- BANDUSDT is printing an ascending triangle pattern.
- This is a bullish build up pattern.
- There's an upward breakout potential.
BUY ENTRY ⬆️
- Breakout above the ascending triangle's horizontal resistance.
TARGETS 🎯
- Fibonacci extension levels.
SETUP INVALIDATION ❌
- Breakdown below the ascending triangle's inclined support.

BAND Possible targets for 2021BAND Possible targets for 2021
TARGET1: 28$
TARGET2: 48$
TARGET3: 98$
TARGET4: 270$
STOP LOSS: UNDER 4.8$


BANDUSDT (BAND) - POSSIBLE PRICE ACTIONSANALYSIS 🔎
- BANDUSDT is consolidating in a symmetrical triangle pattern .
- A relatively big move is imminent.
- There's a breakout potential.
POSSIBLE PRICE ACTIONS
- Uptrend ⬆️: breakout above the symmetrical triangle's inclined resistance.
- Downtrend ⬇️: breakdown below the symmetrical triangle's inclined support.
TARGETS 🎯
- Uptrend ⬆️: Horizontal resistance levels (R1, R2).
- Downtrend ⬇️: Horizontal support levels (S1, S2).

Band Protocol accumulating. 70% move to upside. $BANDBand Protocol accumulating. 70% move to upside.
Above resistance first target around $18
$BAND COINBASE:BANDUSD

Band has a Buy Opportunity 🔥Band/USDT is one of the good Defi currencies and I think it has good potential and we will see it above $ 10 soon.
We have two important levels of support, one on the floor and one in the 50% Fibonacci zone.
The first level is a good area to buy and I think with the Defi Hype we have now it can move towards its ATH.
Buy Zone : 8.6 - 7.2
TP : 10.8 - 12.7 - 14.60 - 17.1
SL : Daily Close Below 5.2 $

BAND/USD - yolo!looking and hoping for the prior parabolic fractal on BAND to repeat. something to keep an eye on this spring
not trading advice
tg

Band - a promising R set upAnother one of my favourite risk reward set ups in crypto right now - will band follow in the footsteps of link?

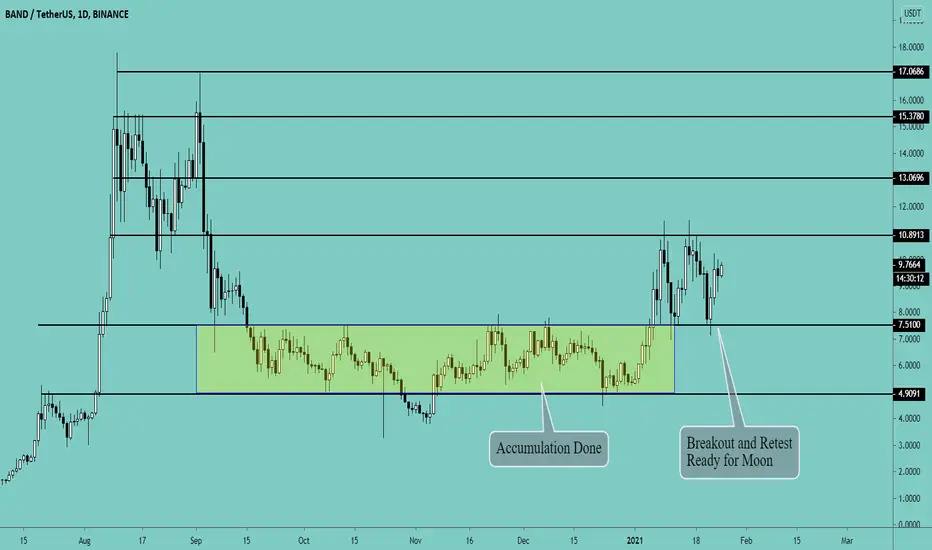
Band Protocol Ready for New All-time highBand Protocol is an Oracle + DeFi coin. Oracle coins are pumping hard with LINK and DeFi is still in trend. We expect BAND will follow LINK and DOT. There is a lot of accumulation done on BAND and now it is breaking out. The breakout is confirmed and retested in the support zone. There is only one way to go now... Moon
Buy Zone: $9.5 - $9.7 (Add more if drops to $7.5)
Target: $10.88- $12.3 - $13.06- $15.35 - $17
BAND waiting for trendline breakout BAND / USDT
Just wait for trendline breakout before buy
1daily candel close above can add more confirmations
Good luck


BAND Protocol breaking out above trendlineI don't know what I'm doing, I just see the candle break above the triangle and pray we're going to the moon. Please spare some rep for a lowly commoner who can't even type in chat yet.


What a good BAND!not many details on the chart. just read it, take profits, and stay tuned... be conservative on this chart.
comment down below to share opinions and to support us

wave 1 before will bonus LTC goldgo or no go, LTC Faster BTC, but LTC is evolution at good develop LTC pay mining pool stay, but ETH no pay you

