BAND/USDT – Massive Trendline Breakout! Reversal Play!📌 Chart Overview:
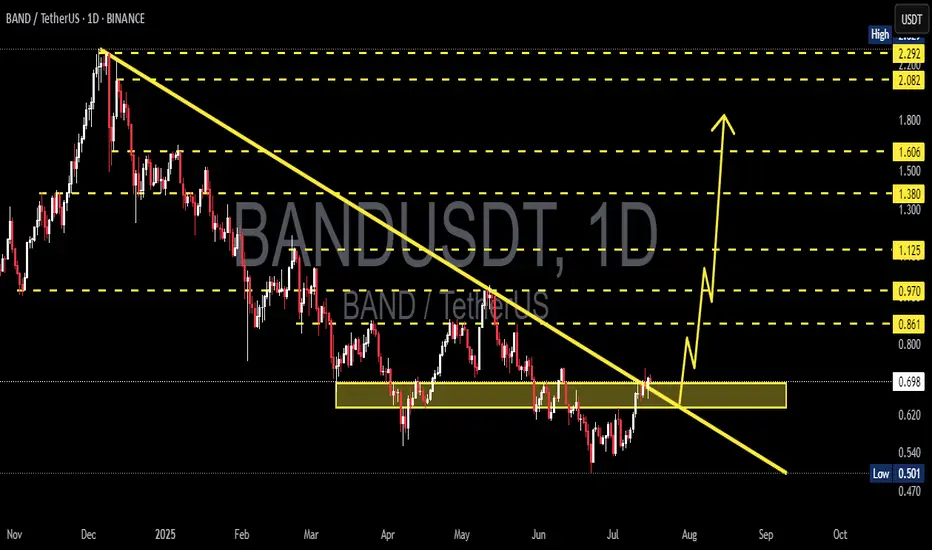
BAND/USDT has officially broken out from a long-term descending trendline that has suppressed price action for over 7 months. This breakout, confirmed with a bullish daily close above a key horizontal resistance zone ($0.68–$0.70), opens the door for a powerful trend reversal.
The structure signals the end of accumulation and the beginning of a potential markup phase, where volatility and volume often expand rapidly.
🔍 Technical Pattern Breakdown:
Falling Wedge Formation: A classic bullish reversal pattern formed after a prolonged downtrend. The wedge narrowed price volatility and concluded with a clean breakout to the upside.
Descending Trendline Breakout: The break of the major trendline marks a shift in control from bears to bulls. Historically, this is one of the strongest technical signals for a trend reversal.
Demand Zone Validation: The $0.60–$0.70 range has acted as a multi-month accumulation zone, with repeated rejections from the downside showing strong buyer presence.
✅ Bullish Scenario:
If BAND holds above the $0.68–$0.70 breakout zone, a strong bullish rally could unfold with the following upside targets:
1. TP1: $0.861 – Minor resistance, potential retest level.
2. TP2: $0.970 – Psychological resistance and historical flip zone.
3. TP3: $1.125 – Major horizontal resistance; a breakout from here could trigger FOMO buying.
4. TP4: $1.380–$1.606 – High-confluence zone from previous consolidation.
5. TP5: $2.08–$2.29 – Ultimate extension target aligned with macro resistance from November 2024 highs.
Each breakout above the target levels could lead to a short squeeze scenario, accelerating momentum.
⚠️ Bearish Scenario:
A failure to sustain above the $0.68–$0.70 level would invalidate the breakout and trap late buyers.
Breakdown back below the yellow zone could push price towards:
$0.60 – Key mid-support
$0.501 – The lowest support on chart; a break here would resume the downtrend.
Watch for volume divergence or fake-out signals on lower timeframes.
🧠 Market Psychology Insight:
This setup reflects a shift in sentiment. After a prolonged phase of apathy and seller exhaustion, smart money appears to be stepping in. The strong rejection from lows and breakout suggests early-stage bullish accumulation transitioning into public participation.
If volume increases along with upward price movement, it may confirm Phase C-D of a Wyckoff Accumulation, suggesting much higher upside.
📆 Timing Note:
Historically, July–September has offered volatility surges across mid-cap altcoins. With BAND breaking structure at this critical timing, early positioning could offer asymmetrical risk-reward.
#BANDUSDT #CryptoBreakout #AltcoinSeason #TrendlineBreak #BullishReversal #TechnicalAnalysis #FallingWedge #CryptoSignals #BANDToken #CryptoTA
Bandusdtidea
BANDUSDT 1D AnalysisBAND ~ 1D Analysis
#BAND Buy when re -testing this support block with a short -term target of at least 15%+ from here.

BANDUSDT 1DBAND ~ 1D Analysis
#BAND Buy after successfully penetrating this resistant line with a short -term target of at least 10%+.
BANDUSDT 1WBAND ~ 1W Analysis
#BAND If you still have a Conviction on this coin. This support block will be a very good place of buy for now.

BANDUSDT 1WBAND ~ 1W Analysis
#BAND In Time Frame 1W continues to maintain this support block, buy from here if you still have a Conviction on this Coin with a minimum target of 20%+

BANDUSDT 1WBAND Update ~ 1W
#BAND If you still have Conviction on this coin. buy in stages from here. with a minimum target of 20%++, it is only a matter of time until this resistance line is successfully penetrated.

Band/USDT is showing promising potential for its next leg up.Band/USDT is showing promising potential for its next leg up. Currently, it's trading under the box on a higher time frame and looks very bullish. However, this is not a buying signal just yet.
I prefer to wait for a confirmed breakout before taking any action. Many altcoins are looking strong right now, leading traders to enter buy positions. However, I anticipate a possible shakeout by market makers before we see a solid bullish move.
Always do your own research and manage risks effectively—this is not financial advice.

BANDUSDTBAND ~ 1W
#BAND This is an important support block that needs to be maintained.
If you have Conviction on this coin,. This support block would be a very good buy for now.

BANDUSDT 1WBAND ~ 1W
#BAND Must defend this support block, To stop the price decline.
Defending this support block, Bulls will be in control. losing this support Price will visit the nearest support that we have marked

BANDUSD 1WBAND ~ 1W
NASDAQ:BAND Make purchases gradually on this support block. with a minimum target of 15%+. So far this support has been able to hold the price of $BAND.

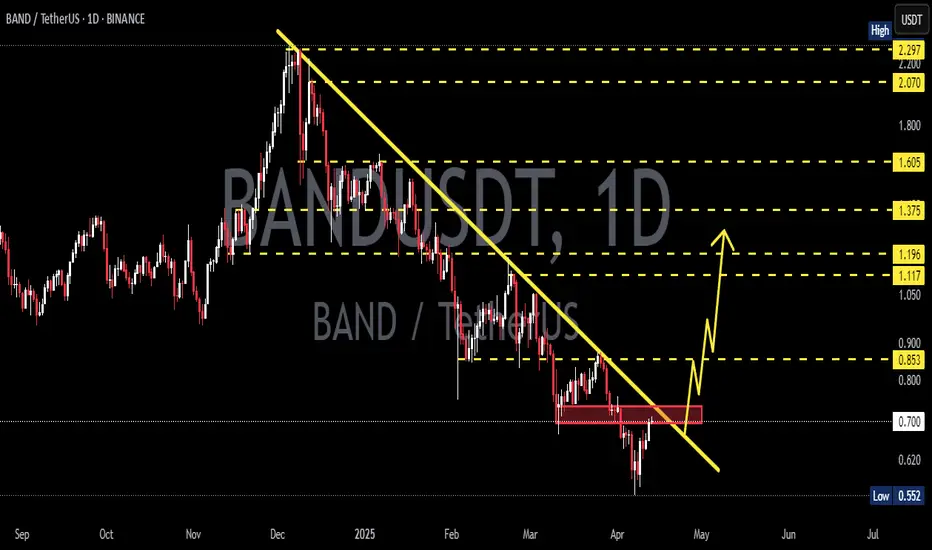
BAND/USDT Bullish Flag formation, Break out the pattern or down?💎 BAND has been capturing a lot of attention in the market lately. It's currently navigating within a Bullish Flag formation, facing challenges in achieving a breakout from this pattern. Historically, BAND has formed similar bullish flags, only to be rejected and fall sharply back to the strong support level.
💎 Should BAND now manage to successfully break out of this current pattern, the probability its next target lies in a significant resistance area. To reach our set target, BAND needs to overcome the substantial resistance level at $1.68.
💎 However, if BAND is unable to break out from this Bullish Flag formation, there's a likelihood of it retreating to retest the strong support area around $1.31.
💎 The strong support area at $1.31 is a critical level for BAND. Here, BAND needs to show a robust rebound or risk breaking down below this key support area. If BAND fails to bounce back and instead breaks down, it may continue on a downward trajectory, potentially moving to even lower levels.

BAND/USDT Breakout and Accumulation Zone BreakoutBINANCE:BANDUSDT
BAND/USDT breakout and accumulation zone breakout
BAND/USDT has broken out of the downtrend line and the accumulation zone, signaling a potential bullish reversal. The price has shown good strength over the past 40 days, trading within a range of 0.95 to 1.17.
This breakout suggests that buyers are gaining control and that the price could move higher in the coming weeks. The immediate targets are 1.27 and 1.40, with a stop loss below 0.96.
However, it is important to note that the cryptocurrency market is volatile and that prices can move quickly in either direction. It is always advisable to do your own research and to trade within your risk tolerance.
Disclaimer: This is not financial advice. Please do your own research before making any investment decisions.

Band 100% Bullish Move Loading Bandusdt
Band Usdt Symmetrical Triangle Pattern Breakout Already Confirmed on 4h timeframe
Higher time-frame descending channel breakout & retest already done
Expecting 100-300% Bullish Move Incoming Days
Manage risk & do your own research
If you are satisfied with our work join

Band USDT Double Bottom After Bearish Trend end in 4 hr ChartBINANCE:BANDUSDT Band USDT Double Bottom After Bearish Trend end in 4 hr Chart. Long Trade Setup After Break of L.H.

BANDUSDT - Falling Wedge PatternBANDUSDT (1D Chart) Technical analysis
BANDUSDT (1D Chart) Currently trading at $5.5
Buy level: Above $5.5
Stop loss: Below $3.2
Target 1: $7
Target 2: $10
Target 3: $15
Target 4: $23
Max Leverage 2x / Spot market
Always keep Stop loss
Follow Our Tradingview Account for More Technical Analysis Updates, | Like, Share and Comment Your thoughts

BAND USDT CHANCE FOR BUYINGThere is a chance for taking a buy position on Band/USDT, Band price has broken the blue trendline, this means the downtrend is weaker right now, the red horizontal line is invalidation point for buying, this means we should cancel buy position if Band price break the break and close beneath the invalidation point, the short term target is target 1, the mid term target is target 2 if Band still on uptrend, we should take this opportunity because the risk is smaller then the reward, if there is a comment or suggestion please comment below, I am open to learn

BANDUSDT GLOBAL VISION (HUGE RISK/REWARD POTENTIAL)Hello friends.
Please support my work by clicking the LIKE button👍 (If you liked).Thank you!
Everything on the chart.
Entry: market and lower
TP: 10 - 15 - 19
after first target reached move ur stop to breakeven
Stop: (depending of ur risk). ALWAYS follow ur RM .
cancellation of growth, consolidation below 4
Risk/Reward: 1 to 12
risk is justified
Good luck everyone!
Follow me on TRADINGView, if you don't want to miss my next analysis or signals.
It's not financial advice.
Dont Forget, always make your own research before to trade my ideas!
Open to any questions and suggestions.

BANDUSDT Analysis, How Bullish is it ? As we can see from the chart BANDUSDT forming a cup and handle pattern, trendline and bulls are now eyeing an upside towards HH. If it break its resistance then it will reach $7 to $10.
If u take my suggestion,going by the trend I believe it will cross all my targets.
I believe that this year is good for profit.
Good luck everyone!
Follow me on TRADINGView, if you don't want to miss my next analysis or signals.

BANDUSDT AnalysisHello friends.
Please support my work by clicking the LIKE button(If you liked).Thank you!
Everything on the chart.
open pos: market and lower
target: 10 - 15 - 19
after first target reached move ur stop to breakeven
stop: under 6.3 (depending of ur risk). ALWAYS follow ur RM .
risk/reward 1 to 9
risk is justified
Good luck everyone!
Follow me on TRADINGView, if you don't want to miss my next analysis or signals.
It's not financial advice.
Dont Forget, always make your own research before to trade my ideas!

BANDUSDT 1H: Possible SHORTBANDUSDT 1H: Possible SHORT
A further fall to the level of 7.300 is possible after breaking through the level of 7.850.

BANDUSDT 4H: Possible LONGBANDUSDT 4H: Possible LONG
Rebound from the level 8,000 and possible growth to the level 12,000

BANDUsdt analysHello friends.
Please support my work by clicking the LIKE button(If you liked).Thank you!
Everything on the chart.
open pos: 9.7-9.2
target: 11 & 13
after first target reached move ur stop to breakeven
stop: 8.5 (depending of ur risk). ALWAYS follow ur RM .
risk/reward 1 to 3
Good luck everyone!
Follow me on TRADING View, if you don't want to miss my next analysis or signals.
It's not financial advice.
Dont Forget, always make your own research before to trade my ideas!
Open to your questions or suggestions(Looking for investors!).
