US Banks on Fire | Revenues Soar, and So Do the ProfitsWho Needs a Recession? Banks Are Swimming in Cash!
The largest U.S. banks have reported some of their best quarterly performances in recent years, with surging trading revenues, a resurgence in dealmaking, and an overall renewal of corporate confidence playing pivotal roles. Let’s break down the key details of the results.
Market Recovery
Across the major banks, investment banking and trading activities recorded impressive performances. Goldman Sachs saw investment banking revenue increase by 24%, while Bank of America (BofA) experienced a massive 44% jump, marking its strongest quarter in three years.
The market volatility stemming from factors like the U.S. election and changing expectations around interest rates continued to fuel robust trading revenues. Morgan Stanley’s equities division, for example, reached an all-time high, while JPMorgan and Goldman Sachs enjoyed notable gains in fixed-income trading.
A surge in CEO optimism has led to an uptick in mergers and acquisitions (M&A), initial public offerings (IPOs), and private credit demand. Morgan Stanley, in particular, is seeing the largest M&A pipeline in seven years, signaling a sustained wave of dealmaking.
Mixed Results for NII
Net interest income showed varying results across the banks, but forward guidance indicates that NII will likely see moderate growth in 2025, spurred by continued loan demand and higher asset yields.
Credit Risks on the Rise
Consumer lending pressures have persisted, with JPMorgan’s charge-offs rising by 9%. Many banks are preparing for a further increase in delinquencies, particularly in credit cards.
Commercial Real Estate Challenges
While the office sector remains under stress, banks are managing their exposures cautiously and have yet to face significant shocks in this area.
Regulatory Scrutiny Continues
Citigroup lowered its 2026 profitability target as it undergoes a transformation, while Bank of America faced increased scrutiny over its anti-money laundering compliance.
Resilient U.S. Economy
Banks are reporting strong consumer spending, loan growth, and corporate profitability, which supports an optimistic outlook for earnings growth heading into 2025.
Performance Breakdown for Each Bank
JPMorgan Chase
- JPMorgan posted a record annual net income of $58.5 billion, marking an 18% increase from the previous year.
- Investment banking saw a 46% surge in revenue, driven by strong advisory and equity underwriting.
- Trading revenue climbed by 21%, led by a 20% increase in fixed-income trading.
- Despite the impressive results, JPMorgan is still facing challenges such as rising charge-offs and pressures on loan margins. CEO Jamie Dimon emphasized concerns about persistent inflation and growing geopolitical risks.
Bank of America
- BofA experienced an 11% year over year growth in revenue, reaching $25.3 billion, with net income up 112% from the previous year.
- The investment banking division saw a dramatic 44% rise in revenue, the highest in three years, thanks to strong debt and equity underwriting.
- Trading revenue grew by 10%, driven by solid performance in fixed income (up 13%) and equities (up 6%) as market volatility spurred client activity.
- BofA also reported growth in its consumer and wealth management divisions, with credit card fees and asset management showing strength. Client balances grew to $4.3 trillion, a 12% increase from the previous year.
- After several quarters of decline, BofA’s NII grew by 3%, exceeding expectations and signaling stability. The bank expects NII to continue rising through 2025, with projections of $15.7 billion per quarter by the end of the year.
Wells Fargo
- Wells Fargo’s revenue remained flat at $20.4 billion, but net income surged by 50%.
- NII declined by 8% year-over-year but is expected to rise slightly in 2025 due to higher reinvestment rates on maturing assets.
- The bank made significant progress in cost-cutting efforts, reducing non-interest expenses by 12%, thanks to workforce reductions and efficiency initiatives.
- Investment banking fees rose by 59%, benefiting from the broader market recovery and the bank’s renewed focus on its Wall Street presence.
- Wells Fargo returned $25 billion to shareholders in 2024, including a 15% dividend increase and $20 billion in stock buybacks. However, the bank continues to face regulatory constraints, notably the asset cap imposed by the Federal Reserve.
- Looking ahead to 2025, Wells Fargo anticipates modest growth in fee-based revenue, with cost discipline and efficiency gains driving improvements.
Morgan Stanley
- Morgan Stanley saw a 26% increase in revenue, reaching $16.2 billion, while net income soared by 142%.
- Equity trading revenue jumped by 51%, setting a new all-time high as market volatility sparked increased client activity, particularly in prime brokerage and risk-repositioning trades.
- Investment banking revenue grew by 25%, fueled by strong demand for debt underwriting, stock sales, and M&A activity. CEO Ted Pick noted that the M&A pipeline is the strongest in seven years, signaling a potential multi-year recovery in dealmaking.
- Morgan Stanley’s wealth management division saw $56.5 billion in net new assets, increasing total client assets to $7.9 trillion. The firm is pushing toward its goal of $10 trillion in assets under management.
- In response to growing business complexities, the firm launched a new Integrated Firm Management division to streamline services across investment banking, trading, and wealth management.
Goldman Sachs
- Goldman Sachs experienced a 23% increase in revenue, reaching $13.9 billion, while net income more than doubled, up 105%.
- Record performance in equity trading contributed to a 32% increase in revenue from this segment, as market volatility drove greater client activity.
- Investment banking revenue grew by 24%, boosted by significant gains in equity and debt underwriting.
- The firm’s asset management division saw an 8% rise in assets under management, reaching $3.1 trillion, while management fees exceeded $10 billion for the year.
- Goldman is winding down legacy balance-sheet investments but also saw a gain of $472 million from these investments in Q4. The firm’s recent launch of its Capital Solutions Group is aimed at capturing growth opportunities in private credit and alternative financing.
Citigroup
- Citigroup posted a 12% increase in revenue, reaching $19.6 billion, with non-interest revenue surging 62%.
- Fixed-income and equity markets were key drivers, growing 37% and 34%, respectively, as market volatility tied to the U.S. election boosted performance.
- Investment banking revenue climbed by 35%, supported by strong corporate debt issuance and a pickup in dealmaking activity.
- The bank unveiled a $20 billion stock repurchase program, signaling confidence in future earnings.
- Citigroup also made strides in controlling operating expenses, which declined by 2% quarter-over-quarter. However, the bank lowered its 2026 return on tangible common equity (RoTCE) guidance to 10%-11% due to the costs of its ongoing transformation.
- CEO Jane Fraser emphasized Citigroup’s long-term growth trajectory, noting improvements in credit quality and continued progress with the strategic overhaul, including the postponed IPO of Banamex, the bank’s Mexican retail unit, now expected in 2026.
Long story short
Heading into 2025, the major U.S. banks are in strong positions, buoyed by a favorable economic backdrop, continued growth in trading, and a rebound in corporate dealmaking. Despite challenges such as rising credit risks, regulatory hurdles, and potential macroeconomic uncertainties, the outlook remains positive. With a recovering IPO market, continued wealth management growth, and strong trading revenue, the banks are poised to capitalize on the renewed corporate optimism. The key question will be whether the dealmaking frenzy continues or whether uncertainties in the global economy and market dynamics could temper the rally.
BANK

Buy Idea: Habib Bank Limited (HBL)📘 Buy Idea: Habib Bank Limited (HBL)
🔹 Timeframe: Monthly | Strategy: Structure + Type 1.4 + Context Targets
✅ Entry Zone:
Buy between 145 – 155 PKR (near the marked "M Type 1.4" level).
📉 Stop Loss (SL):
Below 92 PKR
("This low to be held as protected low" – the ITL zone).
🎯 Take-Profit Targets (TP):
Target Price (PKR) Gain % Description
TP1 240 ~60% First context target
TP2 314 ~120% Previous major high
TP3 411 ~165% Final potential rocket move 🚀
📌 Context & Narrative:
Price broke key structure levels and is forming a bullish base.
Multiple STL levels swept – shows smart money accumulation.
"M Type 1.4" indicates institutional interest.
Targets are based on historical price action and FVG-based projection.
💡 Position Strategy:
Buy 50% at current price (150–155)
Add 25% on a pullback to 140
Add 25% if price dips toward 130

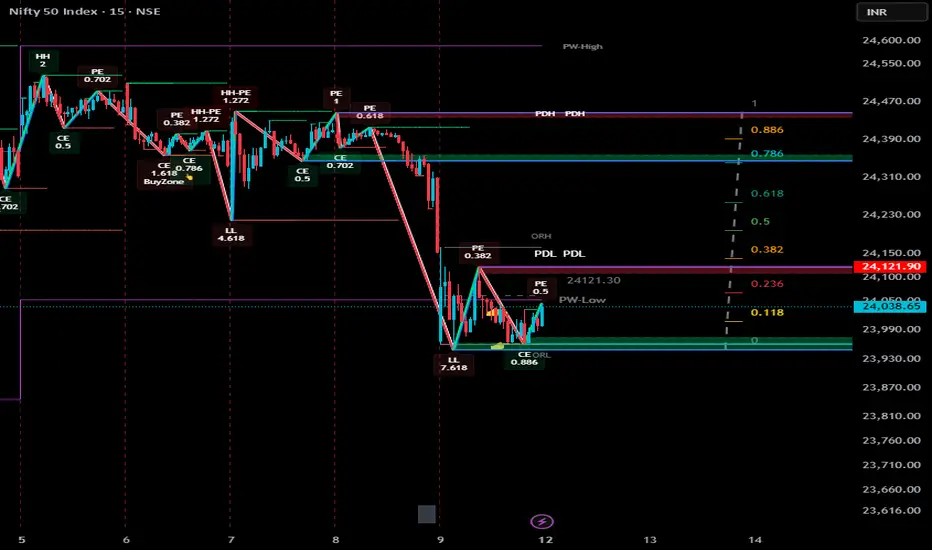
Ceasefire will pump Nifty till 24500As we all know, the market is highly sensitive and tends to react quickly to news events.
Currently, there is ongoing conflict between India and Pakistan, which has caused the markets to open with consistent gap-downs, followed by rangebound movement for the remainder of the trading session.
However, recent developments indicate that Pakistan has realized it cannot continue the conflict without risking severe consequences, including potential erasure from the global map. As a result, they are now showing readiness for a ceasefire.
Given the market's sensitive nature, we can expect a positive reaction to this news.
A strong gap-up opening is likely in the coming sessions.
Technically, the market has the potential to rally towards the 0.886 Fibonacci level, which corresponds to the 2400–2500 zone.
Traders should remain cautious but optimistic, and closely monitor key levels for confirmation of the trend.
#Nifty
BANK / USDT Long Trade Setup – Big Breakout Watch!🚀 BANK Breakout Alert – 100%+ Potential Incoming?! 👀🔥
Hey Traders! If you're all about high-conviction plays and real alpha, smash that 👍 and tap Follow for more setups that actually deliver! 💹💯
BSE:BANK has broken out of a massive symmetrical triangle on the 1H chart — signaling a potential continuation move after a long consolidation! ⚡📈
📌 Entry Zone: $0.0372 – $0.0390 (current breakout area)
🎯 Targets:
• Target 1 → $0.0450
• Target 2 → $0.0520
• Target 3 → $0.0600
Target 4 → $0.0720
Target 5 → $0.0820
🛡 Stop Loss (SL): $0.0350 (below breakout support)
🔑 Why this setup matters:
✅ Clean breakout after long consolidation
✅ Strong bullish volume on breakout
✅ Previous breakout gave +114% move!
⚠️ Always manage your risk — breakouts can retest!
💬 What’s your target on BSE:BANK ? Drop your thoughts below! 👇👇👇

Nasdaq Bank Index 2025 Edition — Let's Make Sh#t Great Again.President Donald Trump's aggressive tariff policies, we at @PandorraResearch Team characterize as a term "Tariff Bazooka", have significantly destabilized the Nasdaq Bank Index NASDAQ:BANK , reflecting broader financial sector vulnerabilities and investor anxiety.
These tariffs, including a 25% levy on imports from Canada and Mexico, a 20% duty on Chinese goods, and proposed reciprocal tariffs, — have triggered cascading multi effects on banking stocks through several paths.
Market Volatility and Investor Flight
The Nasdaq Bank Index, which tracks major U.S. financial institutions, has been disproportionately impacted by tariff-driven uncertainty:
Sharp Equity Declines. Since Trump announced reciprocal tariffs in February 2025, the Nasdaq Composite NASDAQ:IXIC dropped over 10% from its December 2024 peak, erasing $1 trillion in tech-sector value. Banking stocks, sensitive to macroeconomic shifts, mirrored this downturn as investors fled equities for safer assets.
Risk-Off Sentiment. Bonds rallied as tariffs sparked fears of stagflation—a combination of stagnant growth and rising inflation—prompting a 30-basis-point drop in 10-year Treasury yields. This flight to safety squeezed bank profitability, as narrower yield curves reduce net interest margins.
Economic Contagion Mechanisms
Interest Rate Pressures.
Tariffs have raised input costs for businesses, contributing to inflationary pressures. The Federal Reserve now faces a dilemma: tolerate higher inflation or hike rates to curb it. Either scenario harms banks. Elevated rates could suppress loan demand and increase default risks, while delayed rate cuts prolong financial tightening.
Trade Retaliation and Sectoral Risks.
Canada, Mexico, and China have retaliated with tariffs on $155 billion (Canada) and unspecified billions (China, Mexico) of U.S. goods. For banks, this raises exposure to sectors like agriculture, manufacturing, and automotive - industries heavily reliant on cross-border trade. Loan defaults could surge if protected industries fail to offset higher costs.
Global Financial System Strain.
Trump’s tariffs risk fragmenting the rules-based trading system, undermining the stability that banks depend on for international transactions. The EU and other regions may retaliate by restricting U.S. financial services, directly impacting revenue streams for Wall Street firms.
Sector-Specific Impacts
Tech-Finance Nexus. Many Nasdaq-listed banks have significant exposure to tech firms, which face disrupted supply chains due to tariffs on Chinese components. This dual pressure — higher operational costs for clients and reduced tech-sector valuations — weakens banks’ asset quality.
Consumer Credit Risks. Tariffs on everyday goods (e.g., 25% on Mexican produce, 10% on Canadian energy) could elevate household expenses, straining consumer creditworthiness and increasing delinquency rates for retail banks.
Projected Outcomes
Economists estimate Trump’s tariffs could reduce U.S. GDP growth by 1.5 percentage points in 2025, with a stagflationary shock amplifying equity sell-offs. For the Nasdaq Bank Index, this implies prolonged volatility, compressed earnings, and potential credit rating downgrades as macroeconomic headwinds intensify.
Technical challenge
The main technical graph of Nasdaq Bank Index NASDAQ:BANK indicates on further Bearish trend in development, since major supports (nearly 5-month flat bottom and 52-weeks SMA) have been recently broken.
Conclusion
In conclusion, Trump’s tariff strategy has acted as a destabilizing force for financial markets, with the Nasdaq Bank Index serving as a barometer for sector-wide risks. By exacerbating economic uncertainty, inflation, and trade fragmentation, these policies have eroded investor confidence and heightened systemic vulnerabilities in the banking sector.
--
Best 'sh#t hits the fan' wishes,
@PandorraResearch Team 😎

$SOFI is poised to reach the $20 range following its correctionNASDAQ:SOFI 's price began 2025 at $15.40. Today, it traded at $15.56, marking a 1% increase since the start of the year. The forecasted price for SoFi at the end of 2025 is $41.23, representing a year-over-year change of +168%. The expected rise from today to year-end is +165%.
By mid-2025, the price is projected to reach $20-$29.56.
Strong Growth Prospects: NASDAQ:SOFI has shown significant growth in revenue and profitability. The company reported a 35.8% year-over-year revenue growth and a 45% net profit margin in 20241.
Positive Market Trends: Analysts are optimistic about NASDAQ:SOFI 's future performance, with some projecting a 72% upside potential, targeting a $25 share price.
Diverse Financial Services: NASDAQ:SOFI offers a wide range of financial services, including lending, investing, and banking, which helps diversify its revenue streams and reduce risk.
Member Growth: The company has been experiencing robust member growth, which is a positive indicator of its expanding customer base and market reach.
Buy NASDAQ:SOFI now and let's get wealthy!

Swedbank Just Did Something It Hasn't Done in 18 Years!Hi all,
A few weeks ago, at the Estonian finance conference, I pointed out that Swedbank needs a Monthly candle close above a historically significant level to confirm further upside into "open waters".
Before I dive deeper - if someone still claims that "price has no history" or "price doesn't repeat itself," just show them Swedbank’s chart. Back in 2007, Swedbank attempted to break the 215–228 SEK level for the first time. The result? A complete failure. Sellers took control and smashed the price down.
Fast forward 7–10 years: “Let’s try again a few more times!” Still nothing. The level remained unbreakable, draining all momentum. Over the past 18 years, this zone has been tested 7–9 times, and every single attempt ended in failure.
Now, today, things are changed. Today, we have that Monthly close, and the price has now entered a potential buying zone. Technically, Swedbank is ready - optimal zone 215 to 237 SEK!
Do your homework; this is just my opinion and my analysis!
Do not forget to "Boost" the idea - all the best,
Vaido


Nifty and Sectoral Analysis till 31 Dec 2024 - View January 2025Sectoral Analysis
Time Frames
Yearly
Monthly
Weekly
Daily

hdfc BREAKOUT BULLISH VIEWHDFC CMP 1800
1HR closing above 1815 will confirm the breakout.
sl and t are shown on chart
rsi 71 indicating momentum
I m holding my trades on hdfc bank ltd so my view is biased.do your own study.
NOTE: JUST A EDUCATIONAL VIEW . NOT BUY/SELL TIP.

BNF HUGE MOVES REMAING FOR DEC SERIESDEC series almost 12 trading sessions left bnf expected to see good volatility on both sides of around 2000+++ points which one will be attained quicker or simply time pass and decay premiums

HDFC Bank: At resistance zone. It is at one year resistance zone it should go touch resistance zone and go back down but since the budget session is in few days, you cannot be sure.
If budget is positive then it might cross but if it falls taking a short trade here.

Sectoral Scanner study - 25 Nov for the 48th Week 11 NovSectoral Scanner study - 25 Nov for the 48th Week 11 Nov
Technical Analysis of the Sectors in the Indian Stock Exchange.
Market doing a Bullish RD and specifically in a few sectors.

Banknifty level for option trading 18/Nov/2024Banknifty level for option trading 18/Nov/2024
follow for more updates and information.

PayPal Holdings, Inc. (daily)Hello community,
A little daily analysis.
We're leaving the flow of the super trend this Friday!
Just a little report in passing!
Make your opinion, before placing an order.
A little thought for the great French YouTuber @ThamiKabbaj
► Thank you for boosting, commenting, subscribing!

Deutsche Bank (DBK): Earnings beat but loan losses double We missed the optimal entry for Deutsche Bank (DBK), but the analysis was accurate overall. The earnings report showed some resilience with a revenue increase of 5.2% year-over-year, reaching €7.50 billion, slightly above analyst expectations of €7.30 billion. The stock reacted with a modest dip, but nothing significant. However, Deutsche Bank reported a notable rise in loan losses, which doubled to €494 million in Q3 2024 compared to €245 million a year ago, aligning closely with the €482 million forecasted by analysts.
From a technical standpoint, our primary count still appears valid, though it’s a bit on the lower side. This could indicate that wave 3 might not be the longest wave in this count, which is atypical but possible as long as it’s not the shortest.
We’re targeting a potential endpoint for wave 5 within the HTF resistance zone, aligning with the 50-61.8% Fibonacci extension level, where we could look for a long position if the setup confirms. We will continue to monitor DBK closely as this potential target level nears and adjust accordingly.

JP Morgan Chase weekly (log)Hello commuté,
Weekly chart still in log with linear regression channels
The trend is magnificent, nothing to say it is indeed the first US bank.
The upward trend has been since 2011, it's crazy, right?
The 200-period simple average is in orange on the chart.
Make your opinion, before placing an order.
► Thank you for boosting, commenting, subscribing!

23 October Nifty 50 bearish viewsI keep a bearish view on the market for tomorrow Market Ultimate Bears

SWING IDEA - CITY UNION BANKCity Union Bank is showing promising technical signals for a potential swing trade.
Reasons are listed below :
170 Zone Tested Multiple Times : This key resistance level has been tested several times, indicating a potential breakout.
VCP Pattern (Volatility Contraction Pattern) : A bullish chart pattern signaling a possible price surge.
Bullish Engulfing Candle on Daily Timeframe : A strong reversal signal, highlighting increasing buying pressure.
50 EMA Support on Daily Timeframe : The stock is well-supported by the 50-day EMA, reinforcing the bullish sentiment.
Target - 185 // 205
Stoploss - daily close below 159
DISCLAIMER -
Decisions to buy, sell, hold or trade in securities, commodities and other investments involve risk and are best made based on the advice of qualified financial professionals. Any trading in securities or other investments involves a risk of substantial losses. The practice of "Day Trading" involves particularly high risks and can cause you to lose substantial sums of money. Before undertaking any trading program, you should consult a qualified financial professional. Please consider carefully whether such trading is suitable for you in light of your financial condition and ability to bear financial risks. Under no circumstances shall we be liable for any loss or damage you or anyone else incurs as a result of any trading or investment activity that you or anyone else engages in based on any information or material you receive through TradingView or our services.
@visionary.growth.insights

USDJPY Analysis: Potential Bullish Bias for the Upcoming Week!USDJPY Analysis: Potential Bullish Bias for the Upcoming Week (Sept 23-29, 2024)
As we look ahead to the coming week, USDJPY appears poised for a potential slightly bullish bias. This outlook is based on a confluence of fundamental factors and current market conditions that favor USD strength relative to the Japanese yen. Below is a breakdown of key drivers supporting this outlook, along with insights that could influence price action.
1. Federal Reserve's Hawkish Stance
One of the key drivers for a potential bullish bias in USDJPY next week is the persistent hawkish tone from the Federal Reserve. Although the Fed opted to pause rate hikes in September, policymakers have indicated that they are open to further tightening if inflationary pressures persist. Recent inflation data in the U.S. showed a slight uptick in the Consumer Price Index (CPI), suggesting that the Fed may still consider additional rate hikes in 2024. Higher U.S. interest rates would continue to bolster the U.S. dollar, driving demand for USDJPY as traders seek yield differentials.
2. Bank of Japan's Dovish Policy
In stark contrast to the Fed, the Bank of Japan (BoJ) remains committed to its ultra-loose monetary policy, including negative interest rates and yield curve control. The BoJ's dovish approach continues to weigh on the Japanese yen, especially in an environment where other major central banks are tightening monetary policy. While some market participants expect the BoJ to consider policy changes in the future, there have been no concrete signals indicating a shift in the near term. This widening policy divergence between the Fed and BoJ is a key factor supporting a bullish outlook for USDJPY.
3. Safe Haven Demand Waning
The yen is traditionally viewed as a safe-haven asset, particularly during periods of global market volatility. However, recent market stability, coupled with optimism surrounding global growth prospects, has reduced demand for the yen as a haven. As risk sentiment improves, investors are more likely to allocate capital into higher-yielding assets, which could further weaken the yen.
Moreover, geopolitical tensions that previously supported yen demand have eased slightly, making USDJPY more likely to drift higher in a low-risk environment.
4. U.S. Treasury Yields Rising
Another factor contributing to the bullish bias in USDJPY is the rise in U.S. Treasury yields. Higher yields on U.S. government bonds make the dollar more attractive to foreign investors, adding upward pressure to USDJPY. The correlation between USDJPY and U.S. Treasury yields is well-documented, and as yields rise, so too does the currency pair. Traders will be closely monitoring U.S. economic data next week, including durable goods orders and GDP figures, to gauge the potential for further yield increases.
5. Technical Analysis: Key Support and Resistance Levels
From a technical perspective, USDJPY is trading within a well-defined range, but with a slight bullish bias as long as it holds above key support at the 147.50 level. A break above the psychological 150.00 level could open the door to further upside, with resistance seen at 151.50. On the downside, failure to hold above 147.50 could lead to a test of lower levels around 146.00. Momentum indicators, including the Relative Strength Index (RSI), are currently neutral but leaning slightly toward overbought territory, suggesting room for further gains before a pullback.
6. U.S. Economic Data Next Week
Next week, market participants will pay close attention to several high-impact economic reports out of the U.S., including the Durable Goods Orders on Tuesday and GDP Growth on Thursday. Positive readings on these metrics could fuel further gains in USDJPY, reinforcing the bullish bias. Conversely, any disappointing data could dampen USD strength and lead to some consolidation in the pair.
Conclusion
Given the combination of hawkish signals from the Fed, the BoJ's ongoing dovish stance, rising U.S. Treasury yields, and waning safe-haven demand, USDJPY appears to have a slightly bullish bias heading into next week. Traders should watch for any shifts in risk sentiment or unexpected economic data that could alter this outlook. The key levels to watch are 147.50 for support and 150.00 for resistance.
Keywords: USDJPY forecast, USDJPY bullish, USDJPY analysis, Bank of Japan policy, Federal Reserve rate hikes, U.S. Treasury yields, Japanese yen, safe-haven demand, forex trading, USDJPY technical analysis, USDJPY key levels, USDJPY next week, trading USDJPY.

USD/JPY Forecast: Bullish Bias Expected – Key Factors to Watch.USD/JPY Forecast: Bullish Bias Expected – Key Factors to Watch (20/09/2024)
As we analyze the USD/JPY pair on 20/09/2024, the outlook appears to be slightly bullish for this week and next. Several key drivers are pushing the U.S. dollar higher against the Japanese yen, creating an attractive opportunity for traders. In this article, we’ll break down the fundamental factors behind this forecast and highlight the elements influencing USD/JPY price action in the coming days.
1. US Dollar Strength Bolsters USD/JPY
The strength of the U.S. dollar is a critical factor contributing to the bullish bias in USD/JPY. With the Federal Reserve signaling a commitment to maintaining high interest rates for an extended period, the greenback remains in demand. Fed officials have recently emphasized their concerns about persistent inflation, leading markets to believe that U.S. interest rates will stay elevated for longer than previously expected.
This hawkish monetary stance, coupled with strong economic data, has made the U.S. dollar more attractive to investors. As a result, USD/JPY has been moving higher, with the strong dollar likely to continue exerting upward pressure on the pair.
Key SEO keywords: USD/JPY forecast, US dollar strength, Federal Reserve policy, interest rate hike, USD/JPY price action.
2. Dovish Bank of Japan Keeps the Yen Weak
On the other side of the equation, the Japanese yen remains under pressure due to the Bank of Japan’s (BoJ) ultra-loose monetary policy. The BoJ has shown no signs of tightening monetary policy in the near term, despite global inflationary trends. Japan’s central bank continues to prioritize economic support, maintaining low interest rates while avoiding any drastic policy shifts.
This dovish stance contrasts sharply with the Federal Reserve’s hawkish policy, widening the interest rate differential between the U.S. and Japan. This is a major driver of USD/JPY’s bullish outlook, as investors gravitate towards the higher-yielding U.S. dollar over the lower-yielding yen.
Key SEO keywords: Bank of Japan policy, Japanese yen weakness, dovish BoJ, USD/JPY interest rate differential, yen depreciation.
3. Interest Rate Differentials Favor USD/JPY Upside
One of the most important factors pushing USD/JPY higher is the widening interest rate differential between the U.S. and Japan. While U.S. Treasury yields remain attractive, the yield on Japanese government bonds remains low due to the BoJ’s dovish policy stance. This gap in yields makes the U.S. dollar more appealing for investors seeking better returns.
The widening interest rate gap is a key bullish signal for USD/JPY, as capital continues to flow into U.S. dollar-denominated assets. As long as the Federal Reserve maintains its hawkish tone, and the BoJ remains accommodative, this dynamic will likely support the bullish bias for USD/JPY.
Key SEO keywords: Interest rate differentials, U.S. Treasury yields, Japanese bond yields, USD/JPY bullish outlook, capital flows into USD.
4. Japanese Economic Weakness Adding Pressure on the Yen
Another factor supporting the bullish bias for USD/JPY is the ongoing weakness in the Japanese economy. Japan has struggled with slow economic growth and weak inflation, further justifying the BoJ’s cautious approach to monetary policy. Domestic consumption remains low, and Japan’s economic recovery has been uneven.
As a result, the Japanese yen continues to face downside pressure, while the U.S. dollar benefits from stronger economic fundamentals. This divergence between the U.S. and Japanese economies adds to the case for a stronger USD/JPY in the coming weeks.
Key SEO keywords: Japanese economic weakness, low inflation in Japan, weak yen, Bank of Japan policy, USD/JPY forecast.
5. USD/JPY Technical Analysis Suggests Further Upside Potential
From a technical standpoint, USD/JPY is showing signs of further upside. The pair has been testing key resistance levels, and if these levels are broken, we could see a more significant bullish move. The recent price action has shown strength, with USD/JPY consistently finding support at higher lows.
Traders should watch for a potential breakout above these resistance zones, as it could signal further gains for USD/JPY. With strong fundamentals supporting the pair, the technical outlook aligns with the overall bullish bias.
Key SEO keywords: USD/JPY technical analysis, key resistance levels, USD/JPY price action, bullish trend, support and resistance.
Conclusion: Bullish Bias Expected for USD/JPY
In conclusion, several fundamental and technical factors support a slightly bullish bias for USD/JPY over the next couple of weeks. The ongoing strength of the U.S. dollar, the dovish stance of the Bank of Japan, favorable interest rate differentials, and Japan’s economic challenges all point towards further upside potential for USD/JPY.
Traders and investors should closely monitor these key drivers as they make their trading decisions. As always, staying updated on central bank policies, economic data, and technical signals will be crucial in navigating the USD/JPY price action during this period.
Key SEO keywords: USD/JPY forecast, bullish bias, USD/JPY key drivers, US dollar strength, Bank of Japan policy, interest rate differential, USD/JPY technical analysis.

Investment Opportunity - Canara BankAs an investor, you need to think exact opposite of traders (in FUNDAMENTALLY strong stocks).
At these major breakdown levels, big players get enough quantities to buy the promising investment opportunities.
To outperform 90% people, you need to out-think them first.
This idea is to spread awareness and should not be considered as basis of any financial commitment. DO YOUR OWN RESEARCH BEFORE TRADING/INVESTING.

Pin Top pattern In F-Nifty and B-NiftyAs the last week ended and we have seen following patterns in our three indices In nifty 50 we have seen a bullish Text candle on daily charts And we have seen same in all three indices, that is, bank nifty and financial nifty Now, if we look at the weekly closing we have seen Pin Top pattern in candlesticks which denotes bullish movement So let us see what happens For more details, please follow us.
