Gold shorts on the back of USD bulls.Gold H4
Solid response to that $1800/oz price, +100 pips rejected already in quite quick succession.
Hoping to see this pair close with a solid H4 rejection, would be 'golden' to sit on this risk free ahead of US inflation data tomorrow, consensus dropped, but solid chance of outperforming consensus.
Banking

Selling pressure for cable as dollar catches bidGBPUSD H4
Monster rejection H4 candle forming at the moment, around 10 minutes until this H4 candle closes. To see this candle close red would be amazing.
Added another entry point short from 1.21, we traded this really well last week down from 1.22 region, these whole number on cable are playing out incredible, and have done for months.

KBC Groep NV (KBC.br) bearish scenario:The technical figure Triangle can be found in the Belgium company KBC Group (KBC.br) at daily chart. KBC Group is a Belgian universal multi-channel bank-insurer, focusing on private clients and small and medium-sized enterprises in Belgium, Bulgaria, Czechia, Hungary, and Slovakia. The acronym KBC refers to KredietBank and CERA. KBC Group is one of Belgium's major companies and the second-largest bancassurer in the country. As of late 2020, it was the 15th largest bank in Europe by market capitalization. The Triangle has broken through the support line on 01/07/2022, if the price holds below this level you can have a possible bearish price movement with a forecast for the next 12 days towards 50.56 EUR. Your stop loss order according to experts should be placed at 58.72 EUR if you decide to enter this position.
KBC decided - as a result of the persistently rising market interest rates and planned interest rate increases by the European Central Bank - to stop charging negative interest for legal entities and companies from 1 September 2022.
Risk Disclosure: Trading Foreign Exchange (Forex) and Contracts of Difference (CFD's) carries a high level of risk. By registering and signing up, any client affirms their understanding of their own personal accountability for all transactions performed within their account and recognizes the risks associated with trading on such markets and on such sites. Furthermore, one understands that the company carries zero influence over transactions, markets, and trading signals, therefore, cannot be held liable nor guarantee any profits or losses.

APPLE - BUYLooking long for Apple to upside of $225 for the immediate D Extension. Looking for a lump sum purchase around the $140 per share level. Then keep adding to my position each month or on Daily chart corrections. If Price dips below the $140 (which I hope for) I will buy more for value.
For years I have been saying if Apple launched a digital bank they will be the largest bank in the world in terms of customer deposits.
Once currency becomes digitalised which all the G7 economies already have in the pipeline - this will give Apple the platform the be the largest bank in the world. People already use Apple Pay - if they digitalise an Apple coin/card or payment system where your salary is paid into an Apple account it will be a game changer.
They are already taking small increment steps into the financial services sector. They just recently announced they will be scrapping banks from providing the loans for Buy now pay later - Apple will be providing the loans. Remember the US is behind Apple. This platform alone will increase revenues and profitability. L&A for customers will increase - ultimately increasing monthly receivables.
I could imagine Apple potentially offering Mortgages in the future with incentives such as free Apple products. - My Speculation.

BARCLAYS - Clear As Day - Buy @163p
REASONS TO BE BULLISH
Technical - Recently broke out of a 15 year pennant pattern and just retested for support.
Technical - Recently crossed and reclaimed the 50 MA.
Technical - MA 50 looking like it may cross the 100 and 200 in future months.
Technical - RSI is in the bull zone (bouncing off its base).
Technical - A 155p entry was triggered when reclaimed MA and RSI bull-zone on the same candle. We're now at almost the same level.
Technical - All-time high was back in 2007. This stock hasn't been touched in 15 years and is now winding-up to revisit the top of the upwards slanting trend-line.
Technical - Looks like wave 1 of a 5-wave move is complete/near completion.
Fundamentals - Price to earnings is just 4.7. Barclays is looking like incredible value right now. Net earnings up 275% for the year.
Fundamentals - Dividend yield is ~4% - not to be sniffed at all in this environment - they may even increase this given how profitable banking with current accounts may turn out to be if the BOE base rate continues to increase.
Fundamentals - Implied volatility in the options market is increasing, and it seems like some big players may be eyeing-up Barclays for a big position (likely long but perhaps short).
Fundamentals - Less exposed to the U.K. than some of its counterparts (like Lloyds). With U.S. and India appearing in their Top 4 countries in terms of investment.
Target 1 - First target would be reaching the underside of the purple channel once more at 260p or £2.60. A 60% move off todays prices.
Target 2 - Next profit target would be 750p or £7.50 (a 4.6x move). That could be attainable fairly quickly in the next decade on current trajectory. I don't normally like to post timescales but I am curious to see how this one plays out.
Target 3 - The white top line coincides with the 2.272 and 2.414 fib extension (from Mar20 to Mar22). This generates an ultimate price target of between £10.50 (1050p) and £17.30 (1730p). This matches with the extension from the height of the pennant (top to bottom) also.
REASONS TO BE BEARISH
Technical - Below the purple bear channel and not showing signs yet of being an 'exponential' candidate.
Technical - Stop loss will be 140p at the prior low - representing a 12.5% risk.
Technical - Only recently broke out of the pennant pattern. Could still reverse from here.
Fundamentals - Inflation is not usually too good for growth and banks, with costs increasing as well as profits from interest rates.
Fundamentals - With interest rates increasing you'd anticipate that defaults and leverage will unwind in other economies and wreak havoc. Perhaps Barclays have repaired their balance sheet in the last 15 years or perhaps the UK government will continue to backstop, but current market conditions don't make for pretty reading.
SUMMARY
Buying Barclays here seems like a no-brainer here. Significant dividends in a stagflationary environment cannot be ignored. Neither can we ignore a reasonably priced stock in 2022, as well as a successful backtest of multiple breakouts on our indicators/TA. Time to keep an eye on this one.

$SOFI earnings today 👁🗨*This is not financial advice, so trade at your own risks*
*My team digs deep and finds stocks that are expected to perform well based off multiple confluences*
*Experienced traders understand the uphill battle in timing the market, so instead my team focuses mainly on risk management*
Recap: My team entered digital finance company Sofi Technologies $SOFI at $6.70 per share on 5/5/22. Our take profit was originally set at $10 per share.
Today my team has averaged down on $SOFI at $4.87 per share. This brings our average down to $5.80. We still think that $10 can be reached but to be on the safe side we believe that establishing a take profit at $6.95 is ideal. This would be a 19% increase from our average.
Earnings are expected to be reported today after market hours. We were considered adding a stop loss, but it has dropped so much that we believe that there is no longer any need.
Ultimately, we are willing to hold this one out until it reaches our take profit.
Good luck to all today!
first entry: $6.70
2nd entry: $4.87
Take profit: $6.95
If you want to see more, please like and follow us @SimplyShowMeTheMoney

$SOFI earnings next week 👁🗨*This is not financial advice, so trade at your own risks*
*My team digs deep and finds stocks that are expected to perform well based off multiple confluences*
*Experienced traders understand the uphill battle in timing the market, so instead my team focuses mainly on risk management*
Today my team entered digital finance company $SOFI at $6.70 per share. Our take profit has been set at $10.
Earnings are expected to be reported next week.
Our entry: $6.70
Take profit: $10
If you want to see more, please like and follow us @SimplyShowMeTheMoney

Citigroup Inc. (C) bullish scenario:The technical figure Falling Wedge can be found in the US company Citigroup Inc. (C) at daily chart. Citigroup Inc. or Citi (stylized as citi) is a US-American multinational investment bank and financial services corporation. Citigroup is the third largest banking institution in the United States; alongside JPMorgan Chase, Bank of America, and Wells Fargo, it is one of the Big Four banking institutions of the United States. It is considered a systemically important bank by the Financial Stability Board and is commonly cited as being too big to fail. It is one of the nine global investment banks in the Bulge Bracket. The Falling Wedge has broken through the resistance line on 05/05/2022, if the price holds above this level you can have a possible bullish price movement with a forecast for the next 8 days towards 54.85 USD. Your stop loss order according to experts should be placed at 47.78 USD if you decide to enter this position.
Citibank, N.A. said today it has raised its base lending rate to 4.00% from 3.50%, effective tomorrow, Thursday, May 5, 2022.
Citi has announced the launch of Single Euro Payments Area (SEPA) Instant Payments in Europe, further increasing the bank’s global Instant Payments offering.
The launch will provide clients with the ability to pay to and receive from 36 SEPA countries instantly. The offering allows SEPA Credit Transfers to be made within seconds, 24/7 and funds available to recipients immediately. Payments can be made to and received from SEPA Instant participating banks located anywhere within the 36 country SEPA zone.
Risk Disclosure: Trading Foreign Exchange (Forex) and Contracts of Difference (CFD's) carries a high level of risk. By registering and signing up, any client affirms their understanding of their own personal accountability for all transactions performed within their account and recognizes the risks associated with trading on such markets and on such sites. Furthermore, one understands that the company carries zero influence over transactions, markets, and trading signals, therefore, cannot be held liable nor guarantee any profits or losses.

DXY H4 - Short Signal (dollar highs)DXY H4
Bank holidays yesterday, typically lighter conditions than usual, but not sure that was the case, we saw some decent moves.
Normal volume expected today, dollar seems to be topping out as we challenge an attempt to set a new high. Lets see how this 10am H4 closes. Could be time for a dollar correction.

AUDCHF H4 - Long SignalAUDCHF H4
This was the pullback we were kinda of expecting and looking for, rejection seen, healthy correction possibly exhausting. Ties in nicely with our S/R.
Lets see if current price is a point of reversal.
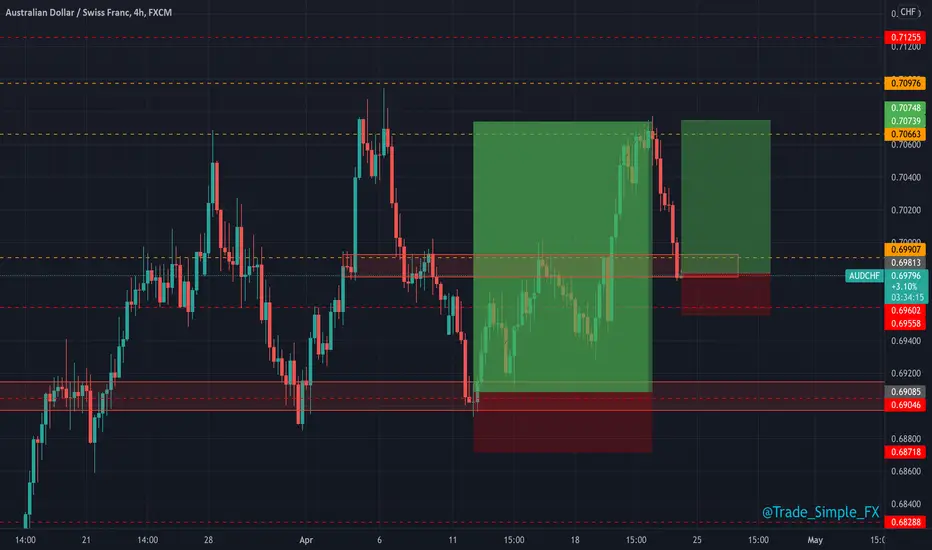
AUDCHF H4 - Long SignalAUDCHF H4
If we can't manage to break through this resistance price of 0.70650, we may see corrections back down towards that 0.70 whole number.
We have marked entries and parameters for this setup if this is the case.

Citigroup, Inc. Bank Stocks to BuyMACD shows a bullish confirmation.
Traders can buy stocks when the price breaks above the downward sloping resistance line.
Target price is defined by Fibonacci retracement 50% level.
Position: LONG

GBPUSD M30 - Long SignalGBPUSD M30
Just a deeper look into GBPUSD on the lower timeframe here, from 1.30 up to our LFT resistance we can see 2R potential.
We ideally need to break above and retest this 1.30400 price as support, this would offer us our next entry and set us up for further upside potential.

GBPUSD H4 - Buy SignalGBPUSD H4
Support on this 1.30 handle holding well so far, seen multiple long entries simply with the parameters for entry, stoploss and take profit marked, 5R last week, 1.8R and 1.6R, waiting for that next target around 1.32 to be seen.
Would love to see this DXY correction and for cable to take off from this psychological price.

GBPUSD D1 - Long SetupGBPUSD D1
Wouldn't mind seeing a strong daily close for confirmation here, but impulse entries possible too... Whilst we have 3 targets marked, these aren't necessarily take profit targets, but setup targets.
3 setups, each offering different areas of resistance. The targets are effectively where we can look to scale in to add positions, all being well.

BTC/USD THE GREAT BUY 2022We see where the demand level for BTC is at and with fundamentals in mind. We have observed the recent short term mini-rally's.
We shall react to price at a discount level for maximum gain and minimal drawdown for the year. As indicated in the chart we have a target and an entry level pricing for best investment return. Now we wait and react at the right moment. Always buy at a discount and sell when price is expensive/at a premium. Keep it basic , keep it simple. The dollar pricing might play a big part in the rally we are waiting on, thought you should have that at the back of your mind. Subscribe ,reward and follow for more. See you on the next post ladies and gents.

$SOFI is oversold 👁🗨*This is not financial advice, so trade at your own risks*
*My team digs deep and finds stocks that are expected to perform well based off multiple confluences*
*Experienced traders understand the uphill battle in timing the market, so instead my team focuses mainly on risk management*
Today my team entered digital finance company $SOFI at $10.25 per share. Our take profit is $12 with a stop loss at $9.75.
Our Entry: $10.25
Take Profit: $12
Stop Loss: $9.75
If you want to see more, please like and follow us @SimplyShowMeTheMoney

Yearn Finance: A World of Painthis is a "governance" token, with a paralyzingly high per unit value ($20,000 and up)
the team has no regard for establishing traits to justify the YFI token to have any non-speculative value.
solutions may involve:
1. revenue payments to YFI holders
2. token split - to normalize per unit price in context of other altcoin crypto assets
3. compensation of revenue per participation in governance decisions
the software team building yearn finance are world class however the tokens are at face value nothing but monopoly bucks
i see a massive dead cat bounce rally happening soon, followed by a very slow and painful 2022, and price never returning to the doorstep for $100,000

IDX : BBRI WEEKLY IN SHORT CORRECTION TO 3860-3940BBRI Weekly Chart most likely will be going down to the 3860-3940 where the support harmonic and dynamic met cluster (fibonacci 0,5-0,618 and support dynamic EMA 90).
After the price hit the support, hopefully the Trend Movement (BULLISH TREND) will comeback to the Resistance Area at 4770-4810.
Stochastic momentum indicator show us that the trend still going down to Oversold Area thats mean there is a chances BBRI will stop the bullish rally for a moment.
And for your info, BBRI has a gap at 4600. Gap in Big Banks have a very big chance to close either gap up or gap down.
Buy BBRI little by little at the price 3800-4000 and Hold it until the price make a comeback at 4800.
Stop Loss under 3800
Take Profit 4800
DISCLAIMER ON

Finance Index Breakout Again is Good SignalMYX:FINANCE
Uptrend
Long Investment Strategy.
Last call Banking Sector
US Federal Reserve will raise interest rates soon !!!


KNC Kyber Network. 8-12$ pt 2022Chart showing 0 resistance after 2.00. Lots of money to be made here. Yall remember Luna? Get that money

XLM could be the trade of a lifetime.If you are in the Crypto world and don't have a bag of XLM, I believe you age going to miss out on a sleeping giant.
the partners of XLM and big brother XRP look like it's out of a crypto fairy tale for the consumer.
We are seeing the only opportunity that I know of in history that the average person gets to get in on the same level as the financial institutions.
Believe it or not, this is happening directly in front of us all. CBDC's are going to happen in a decentralized fashion and the winners of the race already crossed the finish line. We will see the new and improved Quantum Finacial System rolled out in the coming years. A new form of SDR's and it will all be seamless to operate settling payments anywhere on the planet in seconds with On-Demand Liquidity.
bankers are here to stay. Be brave and take the opportunity to get in on the same level as the "big banks'.
fintech of the future is within our grasp.
