S&P500 D1 - Long Investment DCAS&P 500 D1
Fresh highs set here on S&P yesterday too before US stock market close. Significant gains and performance. The DCA instruments for new stock/index fund investors. The go to!
If you're looking to invest your first $100, this is something I'd consider looking at!
Banking

Gold H4 - Short SetupGold H4
The zone we had marked this weekend before market open seems to be seeing some sort of consolidation/resistance. I'd be looking for signs of price rejection between current price and $1800/oz.
Pending orders for $1800 short could be a good consideration.

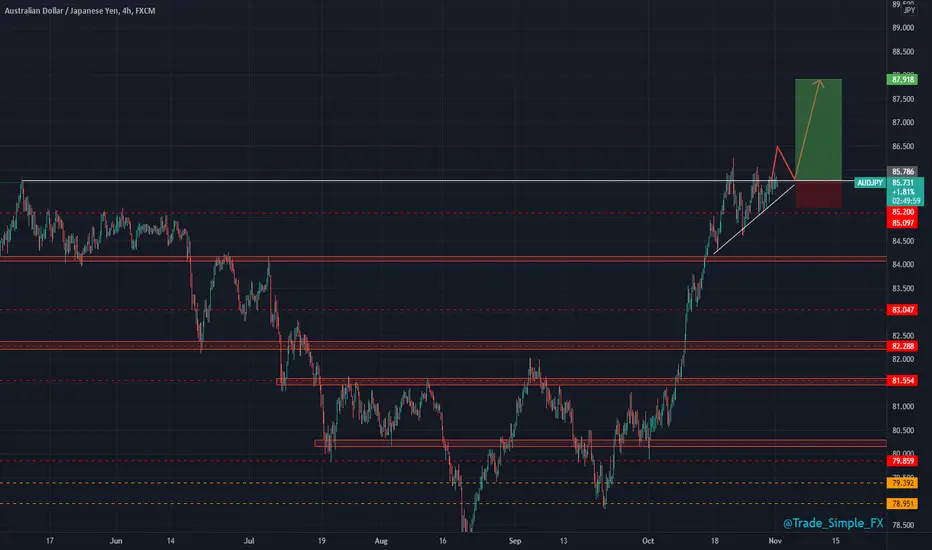
AUDJPY H4 - Long SetupAUDJPY H4
Similar to what we have on GBPJPY, but as we mentioned multiple times on the rundown, AUD and NZD were the outperformers last week, and may continue that theme this week (break dependant).
Simply waiting for a bullish or bearish breakout of this consolidation structure to warrant a trade. If we break downside, we simply look for something else, upside break could offer longs on the retest.
Coinbase 2021 DPO = Facebook 2012 IPOIdea: Coinbase = Facebook
The first 6 months after Coinbase’s DPO reminds me of Facebook’s first 14 months after its 2012 IPO.
The exponential increase over the last decade in the velocity of money and how it is exchanged in the markets seems to be a reason why a stock like Coinbase can do movements that previously took 14 months in just about 6 months. That’s 58% faster if we go along with exploring this idea.
As of today, Coinbase’s chart looks like it has been emulating Facebook’s. If we take a look into Facebook’s all time chart we’ll come across some interesting technical “coincidences” when extrapolating the 3.618 Fib extensions.
If we take the Fibonacci of the all time high of $44.62 and the all time low of $17.43 during the first 6 months of Facebook’s life we get a 3.618 extension of $118.33 that came into existence 4 years later. If we take that all time high of $118.33 and the all time low of $17.43 and we extrapolate and do another Fib extension, the 3.618 lands at $378.76; exactly where the bull run ended (as of today) for Facebook in September of this year. It took 5 years to get to that point from the previous 3.618 extension, but the path had already been drawn.
If we extrapolate Coinbase’s potential 3.618 future extensions, we get $1,022 and $3,138.
As of 2021, Coinbase sits at a market cap of $68.5 billion. In the banking industry, JPMorgan Chase sits at the #1 spot with $503.5 billion. If Coinbase gets to $3,138 (basically a 10x) that would mean that it would surpass JPMorgan and achieve a future market cap of $671 billion.
If Coinbase does a memeish move similar to what Tesla did recently, where it basically took over the entire car industry’s market cap, who knows where it could go. I don’t think this will happen this year or anytime soon, but if it took Facebook 9 years to get close to a $1 trillion market cap, and we take into consideration the exponential change in the velocity of money, it wouldn’t be that inconceivable to think that Coinbase can reach that valuation 58% faster, or in other words, 4 years (or let’s say 5).
What’s the likelihood of this scenario happening? Who knows really, but I think that it’s more probable than not.
We can take the following into consideration:
Coinbase hasn’t even started offering traditional stocks through its exchange. What will happen when/if retail gets the opportunity to trade stocks like Google and Apple through mirror synthetic tokens of their stocks? What will happen when/if Coinbase provides ROTH/IRA/Retirement products through their platform? What will happen when/if Coinbase integrates a social media platform? What if the future of the said Metaverse is not within Facebook but within Coinbase? What if businesses start generating more revenue through Coinbase sales funnels?
Just food for thought. Thanks for reading if you got all the way here.
*I’ve been diversifying my crypto profits into Coinbase stock since late April, from the $320s all the way down to the $210s. After June, every time it went over $260 I paused accumulating. Up till now, I’ve managed to average a $242 entry price. As of the moment, I’m in a hold position, and currently not buying. Wall Street has set a short term high sell target between $385-$600 and a low buy target between $160-$220. Only time will tell.

$QFIN going up long term$QFIN is the play to go to where you know you will make money trading $QFIN options in the stock market.


BTCUSD D1 - Long SetupBTCUSD D1
On fire, good week and weekend for BTC and other cryptos. Threatening to set new ATH's as we approach our top end resistance price of $63k.
Awaiting a break and retest before entries for both investing and trading.
We could see some rejections here back down to $50k, this would justify a more healthy correction from the rally starting from $40k, but lets see what happens.

EURGBP H4 - Short SetupEURGBP H4
Strong start for this pair so far this morning, since LON open GBP has caught bid. Currently battling breakout lows, we have waited all week for this setup.
Hopefully new lows can be seen and we selloff throughout the day for some solid profit.

BBRI: INDICATION OF POTENTIAL BULLISH TREND ON BANKING SECTORSHello Enthusiast Stock Traders! Here's Long-term outlook for BBRI , Please give us the thumbs up and support the channel by Smashing the FOLLOW button :)
BBRI has broken out of the Falling Wedge Pattern. Breakout of Falling Wedge could indicates the possibility of bullish movement/reversal ahead. The momentum indicator already crossed above the zero level, it signify the potential upside movement to the target area.
The roadmap will be invalid after exceeding the support/target area.
DISCLAIMER:
This is only an outlook, not a recommedation to buy or sell the stocks.

SBIN - LONG setupThis has been my fav stock in the PSU banks space.
Chart looks great on both Weekly and Daily charts. At a very critical stage right now and at resistance zone. Nice strong candle for closing and firmly up at the resistance zone, but RSI on both Weekly and Daily charts bullish and no where near overbought zones.
200 daily MA below should be strong support and positive trending stock.
Keep an eye on the whole PSU space for action.

BMRI Falling Wedge, Potensi Bullish ??TP 1 : > 7000
TP 2 : > 8000
Risk In Your Hand
Press Like & Follow if u like my content
--- Thank You ---

$UPST - Is this just the start?!?!This is a hyper bullish count, but considering what this name has done recently and the massive increase in guidance from management, this is far from impossible.
1) Either we have completed a primary 5 wave structure, giving us wave 1 of the cycle around 300 (in yellow) and will now begin a cycle wave 2 that could take us to between 84-135, before a wave 3 takes us to a mind boggling value of 550-600 (white dotted line)....I don't wanna get ahead of myself, but a full completion of this count takes us to 800+, and more likely closer to $900+. This hyper bullish scenario could play out if Upstart is truly the disruptor it claims to be.
OR
2) We are in a triple nest which is currently playing out with cycle wave 3 (yellow count, but 3/4/5 are not complete yet), a primary wave 3 (red count, w3 not complete yet, targeting ~400) and an intermediate wave 3 (pink count) which just reached its 161.8% target of ~290. From here we could see a retrace for primary W4 to around 235-210, before we reverse for a intermediate wave 5 and head back to ~400 to reach the primary W3 target (red count). The interesting thing about this is, when you take the red count to its final wave 5 target, you end up at 560-600! this is the same range as W3 target of scenario 1.
Regardless of how you count is, you end up at 400, then 600 then 900. The key is, do we hold 235-210, confirming that we are in the triple nest, OR do we fall below 200 and back down to 135-84, confirming that we have just completed cycle wave 1 at 300.
Basically, this is looking like a massive opportunity with buy zones at 235-210 and 135-84. Give this name a couple of years and see where we end up!
BTFD

AUDUSD H4 - Long SetupAUDUSD H4
Similar setup to NZDUSD, both local eastern pairs which are in trade vs the USD. Neither parties particularly outperforming, and ideally we want to see some signs of strength from one side (hence why we picked NZDUSD longs).
But worth following for comparative purposes. Support looks attractive, also area of demand, we just don't have the additional whole number confluence that we have with NU.

GBPAUD H4 - Long SetupGBPAUD H4
As mentioned in the technical rundown, this was yesterdays trade of the day, I managed to bank 1.5R on this after pushing circa 2.2R profit. Couldn't optimise the close, but caught the biggest and fastest chunk which I was happy with.
GBP inflation data out this morning showing positive signs and outperforming analyst expectations. GBP positive, but we haven't really seen much of a move off this. AUD again weakness continuations due to everything ongoing with CV19.
Looking for a break above resistance and our 1.89 handle, subsequent retest and long opportunity in line with the previous support/resistance break and retest we saw on the 13th September.

USDWTI H4 - Long SetupUSDWTI H4
Something we were following last week, took a couple of short positions on this pair for 1R and 1.3R before being stopped at entry/profit.
We have now started to see an upside breakout of both S/R and trend sequence. A bit more of a convincing breakout and subsequent retest could offer us long entries.

TRUEfi: $0.50 to $4.0 & $20 playoutbankers and dead money love to park their money in Financial services such as this project which is backed up by veterans in turning water in to wine...
Lending 2.0


KOTAKBANK - Potential Breakout stockWait for a daily close above 1870,
For the above foresaid targets.

UBS Group AG (UBSG.vx)We can found a technical figure Triangle in the Swiss company UBS Group AG (UBSG.vx) on a daily chart. UBS Group AG is a Swiss multinational investment bank and financial services company founded and based in Switzerland. UBS client services are known for their strict bank–client confidentiality and culture of banking secrecy. The Triangle has broken through the support line on 09/09/2021. If the price holds below this level, you can have a possible bearish price movement with a forecast for the next 12 days towards 14.595 CHF. According to the experts, your stop loss should be around 15.485 CHF if you enter this position.
Risk Disclosure: Trading Foreign Exchange (Forex) and Contracts of Difference (CFD's) carries a high level of risk. By registering and signing up, any client affirms their understanding of their own personal accountability for all transactions performed within their account and recognizes the risks associated with trading on such markets and on such sites. Furthermore, one understands that the company carries zero influence over transactions, markets, and trading signals, therefore, cannot be held liable nor guarantee any profits or losses.

LC - Lending Club UpdateThis beast is the ONLY one I held and actually stuck to the plan. I am VERY tempted to sell it here but I want to reach that moon.
This was a no brainer to me. Read previous posts on my I added it as a long term hold.

$BLK: The Undisputed Heavy WeightAs we look forward into the future we may continue to see Blackrock's influence grow from an asset management company into something far greater. With deep pockets and potentially blue skies for the market along with a rising rate environment, we'll see if $BLK can get it done in the weeks / months / years to come.

$UPST - W3 of W3 of W5? Upstart needs to stay above $112.85, and cross $128 and then $135. If it can clear $135, $142 and $150 aren't a long way off.
Invalidation level is 105.58....below that level, it wave 4 would have crossed the wave 1 high invalidating this count.
My final target is ~265, but that's still a long way away i believe. The above mentioned levels are the ones to watch for the short term.
Watch for a bounce between 116-120.
TL;DR:
PT1 = 135
PT2 = 142
PT3 = 150
SL = 112.85
Inv = 105.58

USDWTI H1 - Short SetupUSDWTI H1
Looking to see some sort of reversal here, on these H1 charts lower timeframe confirmation is usually required IMO.
Reason being, we typically move away from our big number, psychological numbers, key H4 supply etc... So in essence we are trading interim zones and banking on lower timeframe continuations.
Waiting for a nice price rejection or structure break and retest is important.
