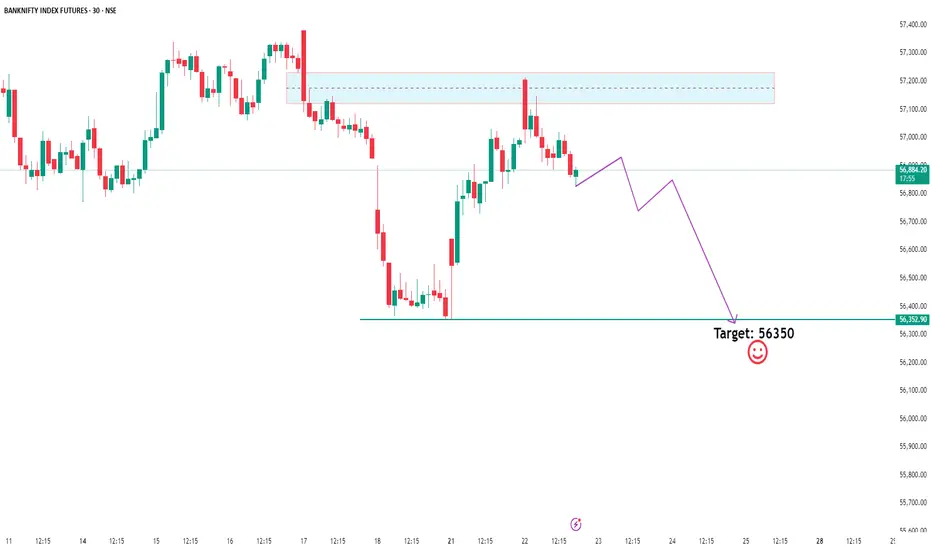
Bank Nifty Breakdown? Eyeing 56,350 –Time to Ride the Sell Wave!Bank Nifty is showing clear signs of distribution as Smart Money appears to be offloading positions near recent highs. Price has swept liquidity above the previous highs and is now rejecting key supply zones, confirming a potential sell-side shift in market structure.
With a break in internal structure and premium zones being respected, we're now watching the 56,350 level as a high-probability target for downside liquidity.
If you're trading with the Smart Money Concept in mind — this could be the move where retail gets trapped while institutions ride the wave down. Stay sharp and manage your risk accordingly. 👀🔥
Bankniftyanalysis
[INTRADAY] #BANKNIFTY PE & CE Levels(21/07/2025)Bank Nifty is expected to open with a gap-up, indicating early bullish sentiment. However, price action near the 56,450–56,500 zone will be crucial in deciding the day’s direction. If Bank Nifty manages to sustain above the 56,650 level after opening, it may invite fresh momentum on the upside. A move above this zone can be seen as a strength confirmation, potentially pushing the index toward targets of 56,750, 56,850, and even 56,950+ levels.
On the other hand, if the index faces resistance and shows rejection from the 56,450–56,400 supply zone, weakness can creep in. This could trigger a corrective move toward the lower levels of 56,250, 56,150, and 56,050-, making it a favorable short trade setup for the day if confirmed by price action.
Additionally, a breakdown below the 55,950 support level can lead to strong bearish pressure. If this level is breached and sustained, the index may fall sharply toward the support zones of 55,750, 55,650, and 55,550-, indicating bearish continuation.

Banknifty chart analysis for tommorrowdosto
banknifty ka chart apko share kar raha hu jo apko kal ke liye help karega trading main.
aaj banknifty aur nifty dono ne hee ek breakout diaya.
BANKNIFTY LOVERS Ready towards 60000 + ?/ ( SHORT TERM IBANKNIFTY 30 Mins counts indicate a bullish wave structure.
Both appear to be optimistic, and this index invalidation number is 56910 ( 30 Mins closing)
target are already shared as per implus move
Investing in declines is a smart move for long-term players.
Every graphic used to comprehend & LEARN & understand the theory of Elliot waves, Harmonic waves, Gann Theory, and tTme theory
Every chart is for educational purposes.
We have no accountability for profit or loss.

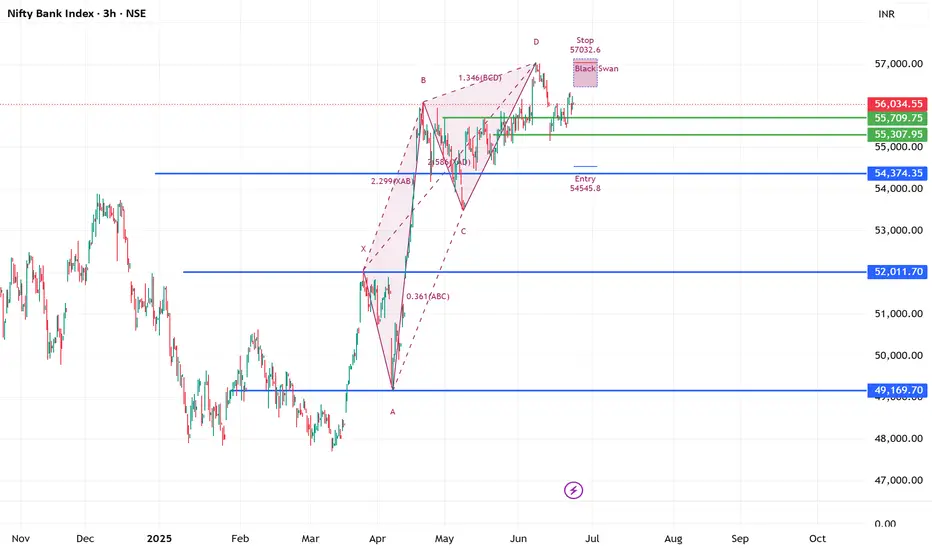
Berish Black Swan (Harmonic pattern) Running in #BANKNIFTY 3hrs56069 spot 23-06-2025
patterns clearly suggest after hitting ATH 57049
at this angel 1.346 BCD move completed by price
now due to amid war situation traders must take extra cautious approach
this is pure educational based study !!!!!
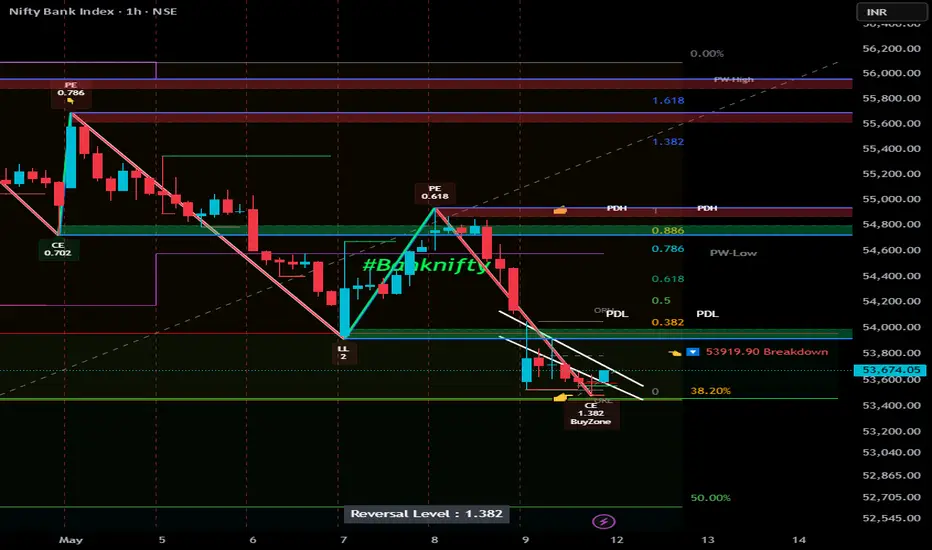
#banknifty - 10th June! NSE:BANKNIFTY NSE:BANKNIFTY1!
Understand the chart, observe the analysis, implement while trading:
Key Observations:
1. Trendlines:
- Resistance Trendline: A descending trendline (sloping down) marks the area where the price faces selling pressure. This indicates a pattern of lower highs.
- Support Trendline: An upward-sloping trendline beneath the price indicates where the price finds buying interest. This suggests a slight upward momentum at the support level.
2. Consolidation Zone:
- The price is moving within a tightening range between these two trendlines, forming a wedge or triangle pattern. This indicates consolidation, where the market is waiting for a breakout or breakdown.
3. Support Levels:
- Key support levels are highlighted at 53,407.75, 53,229.05, 53,057.45, and 52,784.15. These levels represent zones where buyers are likely to step in and prevent further price decline.
4. Resistance Levels:
- Resistance levels are marked at 53,679.35, 53,956.65, 54,128.90, and 54,304.25. These are zones where the price may face selling pressure.
5. Current Price Action:
- The price is currently at 53,577.70, approaching the descending resistance trendline. This is a critical point because it suggests a decision zone for the next move.
Scenarios:
1. Bullish Breakout:
- If the price breaks above the descending resistance trendline, it could signal bullish momentum.
- Potential targets are the next resistance levels at 53,956.65, 54,128.90, and 54,304.25.
2. Bearish Breakdown:
- If the price breaks below the support trendline, it may indicate a bearish trend.
- Possible downside targets are the lower support levels at 53,229.05, 53,057.45, and 52,784.15.
3. Neutral Consolidation:
- If the price continues to move within the wedge, traders may need to wait for a clear breakout or breakdown before acting.
What This Chart Suggests:
- The chart highlights decision points for the market, with the wedge pattern indicating an imminent breakout or breakdown.
- A breakout above resistance would suggest strength, while a breakdown below support would indicate weakness.
Trading Plan:
- For Buyers: Wait for a breakout above the resistance trendline and aim for higher resistance levels.
- For Sellers: Look for a breakdown below the support trendline and target the lower support zones.
Not SEBI Registere.

[INTRADAY] #BANKNIFTY PE & CE Levels(13/06/2025)Today, a gap-down opening is expected in Bank Nifty near the 55500 level. If Bank Nifty started trading below the 55450 mark after opening, we may witness further downside movement with targets around 55250, 55150, and possibly 55050 during the session.
On the upside, if Bank Nifty manages to bounce and sustain above the 56050–56100 zone, it could signal a potential recovery. In such a case, we may see a rally toward 56250, 56350, and 56450+ levels.
Traders should remain cautious as the broader structure suggests continued weakness unless Bank Nifty reclaims and holds above the 56050 level. Strict stop-loss and profit trailing are advised, as sharp intraday volatility is expected around support zones.


[INTRADAY] #BANKNIFTY PE & CE Levels(12/06/2025)Today, a gap-up opening is expected in Bank Nifty near the 56550–56600 zone. If the index manages to sustain above this range, it may trigger an upside move toward 56750, 56850, and 56950 levels. A further breakout above 57050 could extend the bullish rally toward 57250, 57350, and possibly 57450+ during the session.
However, if Bank Nifty fails to hold above 56550 and begins to trade below 56450, a downward move could unfold toward 56250, 56150, and 56050 levels. Any sustained weakness may increase selling pressure, dragging the index further down intraday.


[INTRADAY] #BANKNIFTY PE & CE Levels(09/06/2025)Bank Nifty is opening with a gap-up near the 56900 level, right into a critical resistance zone. While momentum is strong, the index is now approaching a potential reversal area.
If Bank Nifty sustains above 57050, we could see a continuation of the bullish trend with upside targets at 57250, 57350, and 57450+. A strong breakout above this zone could trigger fresh buying.
However, if the index fails to hold above 56900–57000 and starts to reverse, it may signal short-term exhaustion. In that case, a pullback toward 56750, 56650, and 56550 is possible.
A breakdown below 56450 would suggest weakness, exposing downside targets at 56250, 56150, and 56050.

Fake Break out Down Side. You Know What's Next ?#sbin has made a flag and pole pattern on the weekly timeframe, and formed a fake breakout also.

[INTRADAY] #BANKNIFTY PE & CE Levels(02/06/2025)Bank Nifty is expected to open flat around the 55700–55800 zone. If it manages to sustain above the 55550–55600 breakout zone, the bullish trend is likely to continue with upside targets at 55750, 55850, and 55950+. A further breakout above 56050 may fuel extended gains toward 56250, 56350, and 56450+.
On the downside, if Bank Nifty shows weakness and falls below 55900–55950, a short opportunity may arise targeting 55750, 55650, and 55550 zones. A deeper breakdown below 55450–55400 could lead to further downside levels of 55250, 55150, and 55050.
The price action currently suggests consolidation within a range, so wait for a decisive breakout or breakdown before entering. Use strict stop-losses and book partial profits at major levels as the session may remain volatile near resistance.

BANKNIFTY : Trading levels and Plan for 26-may-2025📊 Bank Nifty Trading Plan – 26-May-2025
Timeframe: 15 Min | Reference Spot Price: 55,389
Gap Opening Threshold: 200+ Points
🚀 Gap-Up Opening (Above 55,589) – 200+ Points
If Bank Nifty opens above 55,589, it will directly enter or hover near the crucial Opening Resistance Zone of 55,417–55,510 and potentially head toward the upper Profit Booking Zone: 55,834–55,999.
🟥 This zone has shown signs of supply in the past and may act as a trap for early breakout buyers if price action isn't strong.
✅ Plan of Action:
– Avoid aggressive longs immediately after the gap-up.
– Wait for price to sustain above 55,510 and then break and close above 55,834 on a 15-min candle to confirm strength.
– If this happens, you may look for long entries targeting 55,999 – 56,065 with stop loss just below 55,700.
– However, if Bank Nifty faces rejection in the red zone (55,834–55,999), then Sell-on-Rise opportunity can be considered with a downside target back to 55,510 – 55,417 and eventually 55,136.
– Use a bearish reversal pattern (like Evening Star or Engulfing) in the red zone to trigger shorts.
🎓 Educational Insight: A gap-up into resistance often gives a false breakout if momentum and volume are not supportive. Always wait for confirmation before going long.
📈 Flat Opening (Between 55,189 – 55,589)
This keeps Bank Nifty between the Opening Support (55,136) and the Opening Resistance Zone (55,417–55,510).
🟧 This is the choppy zone. Expect mixed emotions in the market during the first 15–30 mins.
✅ Plan of Action:
– Avoid early trades in the first 15–30 mins.
– Wait for directional cues.
– If price holds above 55,417 and gives a strong bullish breakout above 55,510, you can ride a potential move toward 55,834–55,999.
– On the downside, if price slips below 55,136, expect momentum to pick up toward 55,005 and possibly 54,758.
– Only trade if clear breakout or breakdown candle appears with volume support.
🎓 Educational Insight: Most fake breakouts happen in flat openings. Let the market show its hand—follow only when structure and strength align.
📉 Gap-Down Opening (Below 55,189) – 200+ Points
A gap-down below 55,189 would bring prices near key demand zones: Opening Support: 55,136, Intraday Support: 55,005, and Last Strong Support: 54,758.
🟩 These levels can either absorb the fall and bounce or lead to further decline if broken decisively.
✅ Plan of Action:
– Observe price action near 55,005 and 54,758.
– If bullish reversal candles (like hammer or bullish engulfing) form and price sustains above support, consider a long setup targeting a bounce back to 55,136 – 55,417.
– On the other hand, if price decisively breaks 54,758, then consider short entries with next downside target in swing low regions (can extend 100–150 pts down).
– Stop loss for longs: below 54,700.
– Stop loss for shorts: above 54,850.
🎓 Educational Insight: Gap-downs to support can offer great R:R long entries if price shows strength. But wait for candle structure to confirm reversal before entering.
🛡️ Options Trading – Risk Management Tips
✅ Don’t rush into trades at the open —allow price structure to develop.
✅ Use slightly ITM options instead of deep OTM for better delta movement and less decay.
✅ Don’t overleverage —risk only 1–2% of your capital per trade.
✅ Always define your stop loss based on spot levels , not just the option premium.
✅ Exit after 2 consecutive stop-losses to maintain discipline and emotional stability.
✅ Book partial profits as the trade moves in your favor and trail SL for the rest.
✅ Avoid chasing momentum blindly ; volume and structure confirmation are key.
📌 Summary & Conclusion
🔹 Opening Resistance Zone: 55,417 – 55,510
🔹 Profit Booking Zone: 55,834 – 55,999
🔹 Opening Support: 55,136
🔹 Last Intraday Support: 55,005
🔹 Final Strong Support: 54,758
📈 For Gap-Ups, watch for price rejection near upper zones or breakouts beyond 55,999.
📉 For Gap-Downs, reversal setups at 55,005 or 54,758 are key—don’t short blindly.
🕒 In Flat Openings, let the market settle for 15–30 minutes. Trade only on confirmation.
⚖️ Best trades occur when price moves away from zones with proper volume, pattern, and structure alignment .
⚠️ Disclaimer:
I am not a SEBI-registered analyst. This trading plan is intended purely for educational purposes. Please do your own analysis or consult a SEBI-registered advisor before initiating any trades.

[INTRADAY] #BANKNIFTY PE & CE Levels(14/05/2025)Today will be flat opening expected in index. After opening if banknifty starts trading and sustain above 55050 level then upside movement expected upto 55450+ level. 55450 will act as a resistance for today's session. Possible banknifty will consolidate in between range of 55050-55450 level. In case banknifty gives breakout of 55500 level and starts trading above 55550 then expected strong upside rally of 400-500+ points. Any downside only expected below 54950 level.

Bank Nifty 54,800–55,600 As we all know, Bank Nifty is highly sensitive and tends to react quickly to news events.
Currently, there is ongoing conflict between India and Pakistan, which has caused Bank Nifty to open with consistent gap-downs, followed by rangebound movement for the rest of the day.
However, recent developments indicate that Pakistan has realized it cannot continue the conflict without risking being removed from the global map. As a result, they are now ready for a ceasefire.
As I said, Bank Nifty is very sensitive, hence we can see a good gap-up opening.
Bank Nifty can jump towards the 0.886 Fibonacci level, which is nothing but 54,800–55,600 zone.
Traders should remain cautious but optimistic, and watch key levels carefully.
[INTRADAY] #BANKNIFTY PE & CE Levels(07/05/2025)Today will be slightly gap down opening expected in index. Expected opening near 54000 level. After opening if banknifty starts trading below 53950 level then possible strong downside movement in index upto 53550 level. Any bullish side movement expected if banknifty starts trading and sustain above 54550 level.

Bank Nifty Breakout 56100 or breakdown 54250 .. what next !!Bank Nifty Technical Outlook:
Bank Nifty is currently forming a lower high and higher low pattern, indicating a symmetrical triangle formation. The trading range is getting increasingly narrower, suggesting that a decisive breakout is imminent on either side.
Downside Scenario:
If Bank Nifty breaks down below 54,200, we could see a retracement towards the 52,930 – 52,300 levels, where multiple virgin CPRs (Central Pivot Ranges) are present, potentially acting as support zones.
Traders should closely monitor price action near the current range boundaries for confirmation of direction.

Bank nifty Fibonacci support at 50-61%Bank Nifty formed a double top around the 56,000 mark in the morning session and did not retest that level throughout the trading day.
In fact, it made a lower high and closed near a strong support zone around 55,300. With the market holiday on May 1st and upcoming news flow, charts suggest a possible further correction towards the 54,500–54,580 range.

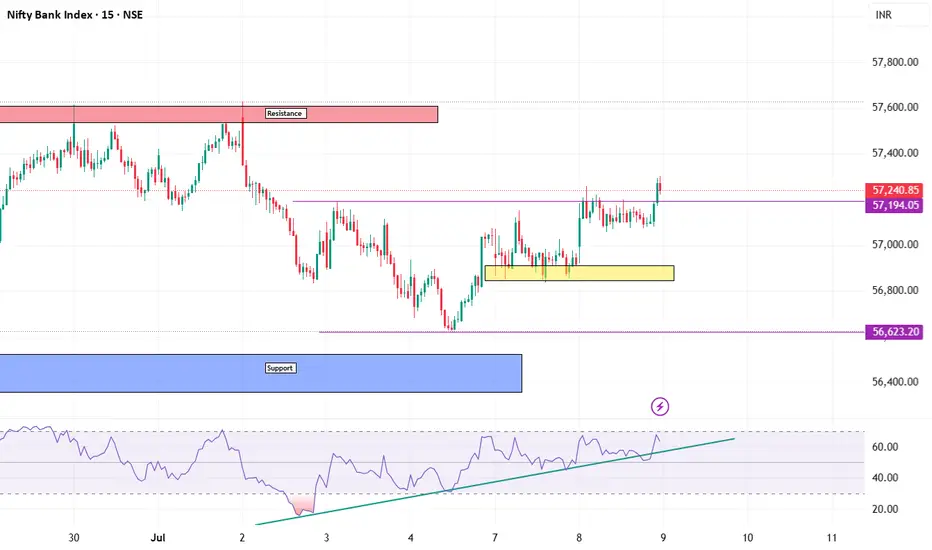
Bank Nifty – 1 Hour Chart AnalysisThe price zone between 55,694 and 55,783 is acting as a strong resistance on the 1-hour chart. If the market moves down to sweep the liquidity around 55,551, it could potentially trigger a reversal. This liquidity sweep may give the momentum required for the price to test the resistance zone again.
However, if the resistance holds firm and rejection occurs, it could push the market further down toward the Monthly Support level around 52,441.
Disclaimer:
This analysis is for informational and educational purposes only and should not be considered as investment advice or a recommendation to buy or sell any financial instruments. Trading in the stock market involves risk. Please conduct your own research or consult with a qualified financial advisor before making any trading decisions.

Nifty Bank Index Chart Observations:
Pattern:
Price has been forming lower highs, suggesting a descending trendline resistance.
There's a visible breakout attempt above this trendline now.
Support Zone:
Strong demand zone between 46,800 – 48,000, which was respected multiple times.
Indicators:
RSI is near the overbought zone, but not showing divergence.
Volume has spiked on the breakout – bullish confirmation.
Heikin Ashi candles are strongly green – good momentum.
✅ Bullish Scenario (If breakout holds):
Entry Zone: On retest of the breakout trendline (around 51,500–52,000).
Target Levels:
Short-term: 53,500
Medium-term: 55,000–56,000
Stop Loss: Below 50,500
❌ Bearish Scenario (If breakout fails):
Invalidation Level: If it closes back below the trendline with high volume.
Re-entry zone: Watch the 48,000 support area again.
Short Target (if breakdown from support): 46,000–45,000
Swing Traders: Wait for a pullback toward the trendline and enter on bullish confirmation.
Positional Traders: Enter partially now, add more on pullback confirmation.
Risk Management: Keep positions light until breakout is fully confirmed.

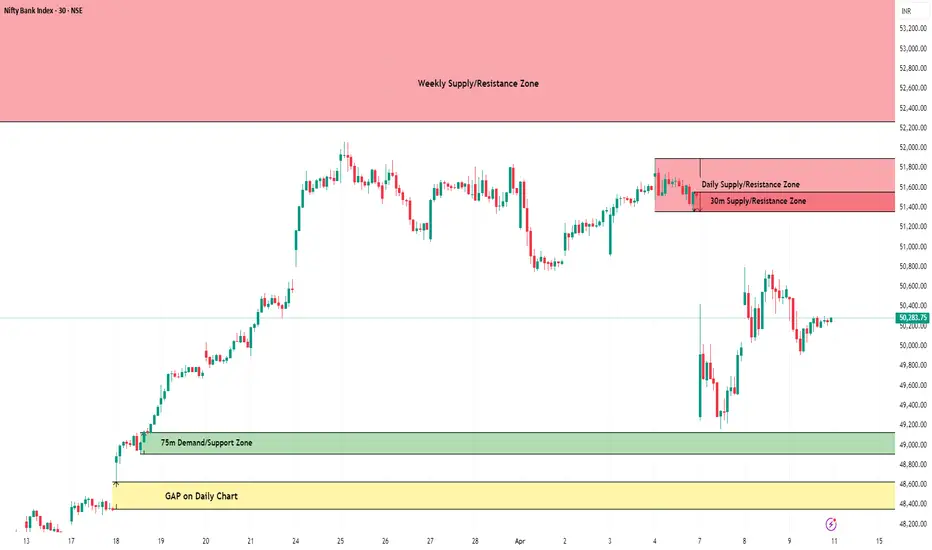
BankNifty Intraday Support & Resistance Levels for 11.04.2025🔄 Quick Recap since the last update (21.03.2025):
BankNifty rallied to a high of 52,063.95 on 25th March, piercing through the earlier mentioned Weekly Supply Zone by 84 points. But the bullish momentum was short-lived. Following Trump’s tariff announcement, BankNifty plunged sharply, dropping over 2,800 points to hit a low of 49,156.95 on 7th April.
🌍 Global sentiment has been shaken, but signs of recovery are emerging. Dow Futures have rebounded 4,000 points (10%), currently trading around 40,700 — a hopeful sign, but volatility remains elevated.
📅 On Wednesday (09.04.2025):
BankNifty opened with a gap-down, hit high of 50,496.90, and made a low at 49,910.85 before settling at 50,240.15, down 271 points for the day.
🔹 Trend Analysis:
Weekly Trend (50 SMA): Sideways
Daily Trend (50 SMA): Sideways
📉 Demand/Support Zones
Near Demand/Support (75m): 49,215.95 – 49,698.05
Gap Support (Daily Chart): 48,354.15 – 48,629.45
Far Support: 47,700 – 47,850 (multiple time tested on Daily Chart)
Major Support: 46,077.85 (Low of 4th June 2024)
Far Demand/Support (Daily): 44,633.85 – 45,750.40
📈 Supply/Resistance Zones
Near Supply (30m): 51,360.40 – 51,559.20 (Inside Daily Supply)
Near Supply (Daily): 51,360.40 – 51,893.60
Far Supply (Weekly): 52,264.55 – 53,775.10
🔍 Outlook:
With both trends turning sideways, BankNifty remains in a consolidation phase. Bulls are currently trapped under a strong resistance zone starting from 51,360, while downside support begins near 49,200.
Considering the volatile global setup, we may see a range-bound move with sharp intraday swings. The index must cross 51,900 decisively for any further upside. Until then, sell-on-rise near supply and buy-on-dip at demand continues to be the approach. Stay cautious. Trade levels, not emotions.
📢 Disclaimer: This analysis is intended for educational purposes only. It is not investment advice. Please consult your financial advisor before making any trading decisions.
BANKNIFTY : Trading Levels and Plan for 31-Mar-2025📌 BANK NIFTY Trading Plan – 31-Mar-2025
📊 Market Overview:
Bank Nifty closed at 51,552, trading within a consolidation phase near the Opening Support/Resistance Zone (51,552 – 51,564). The price action at key levels will dictate the next move, so we need to be prepared for different opening scenarios.
This plan offers a structured approach to trading at key levels while maintaining a favorable risk-reward ratio.
🔼 Scenario 1: Gap-Up Opening (200+ points above 51,750)
A gap-up above 51,750 suggests bullish momentum, but sustainability above the resistance zone (51,848 - 52,129) is crucial for further upside. If price faces rejection, an intraday reversal is possible.
✅ Plan of Action:
If Bank Nifty sustains above 52,129, expect an up-move towards the next resistance at 52,335. A breakout above 52,335 could trigger a rally towards 52,500+.
If price faces rejection at 52,129 and reverses, expect a retracement towards 51,848 → 51,750. If it fails to hold 51,750, a deeper correction towards 51,552 is possible.
Avoid fresh longs inside 51,848 – 52,129, as this zone could act as a profit-booking area. Wait for a decisive breakout or rejection confirmation.
🎯 Pro Tip: If the gap-up is quickly filled within the first 15-30 minutes, it signals weak buying strength, increasing the probability of an intraday correction.
⚖ Scenario 2: Flat Opening (Within ±200 points, around 51,550)
A flat opening near 51,552 indicates indecision. The market will take direction after the first few candles, so breakouts or breakdowns from key levels should be watched.
✅ Plan of Action:
Upside case: If Bank Nifty breaks and sustains above 51,848, it may head towards 52,129 → 52,335. Observe price action near these resistance levels before entering fresh longs.
Downside case: If Bank Nifty breaks below 51,552, it could test 51,199 → 50,899. A breakdown below 50,899 will shift the trend bearish.
Sideways caution: If the market remains inside the No Trade Zone (51,564 – 51,848), avoid taking trades as volatility could trap both buyers and sellers.
🎯 Pro Tip: In a flat opening, wait for a clear 15-minute candle close above or below key levels before entering trades.
🔽 Scenario 3: Gap-Down Opening (200+ points below 51,350)
A gap-down below 51,350 could signal profit booking or fresh selling pressure. The critical factor will be whether buyers defend key support zones.
✅ Plan of Action:
If price sustains below 51,350, expect a decline towards 51,199 → 50,899. A breakdown below 50,899 may accelerate selling towards the Must Try Zone for Buyers (50,800 – 50,899).
If price finds support at 50,899 and rebounds, it may attempt a recovery towards 51,199 → 51,552. A strong close above 51,552 could shift momentum back to the bulls.
Be cautious of bear traps – If the market gaps down but quickly recovers, it could trigger short covering, leading to an upside reversal.
🎯 Pro Tip: If the gap-down occurs near a strong buyer’s support zone, wait for a bullish price action confirmation before entering long trades.
⚠️ Risk Management Tips for Options Traders
🔹 Avoid over-leveraging – Use proper position sizing to manage risk.
🔹 Theta Decay Awareness – If the market consolidates, option premiums will erode rapidly.
🔹 Use Spreads for Protection – Instead of naked options, use spreads to limit risk and improve probability.
🔹 Trade at Key Levels – Avoid impulsive trades; focus on defined support and resistance zones.
📌 Summary & Conclusion
📍 Key Levels to Watch:
🟥 Resistance: 52,129 → 52,335 → 52,500
🟧 No Trade Zone: 51,564 – 51,848
🟩 Support: 51,199 → 50,899 → 50,800
🔸 Bullish Bias: Above 52,129, targeting 52,335 – 52,500
🔸 Bearish Bias: Below 51,350, expecting a fall towards 51,199 – 50,899
🔸 Neutral/Choppy: Inside 51,564 – 51,848, avoid unnecessary trades
🎯 Final Advice:
Stick to the structured trading plan and execute only at key levels.
Avoid emotional trading—wait for confirmation before entering trades.
The first 15-30 minutes after market open will provide better clarity—observe price action before committing to a trade.
📢 Disclaimer
I am not a SEBI-registered analyst. This trading plan is for educational purposes only. Please conduct your own research or consult a financial advisor before making any trades.
