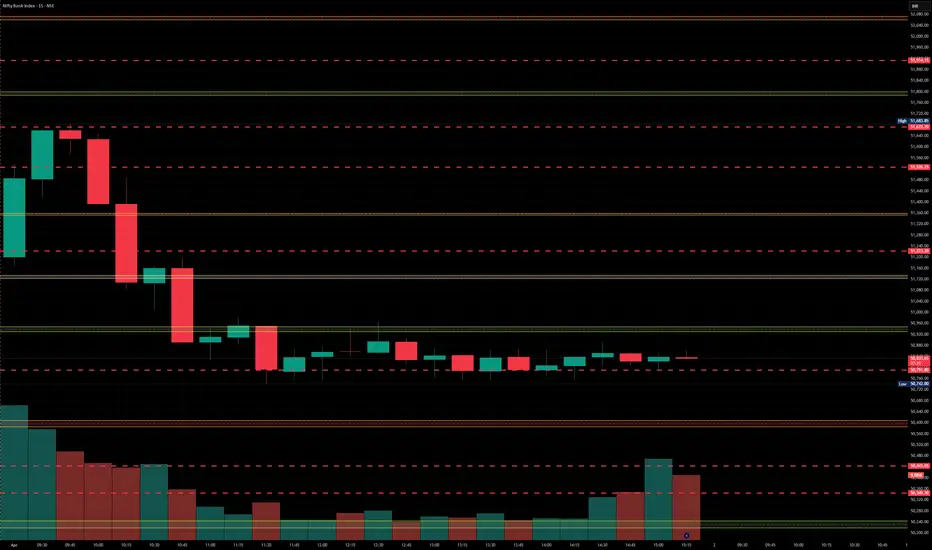
[INTRADAY] #BANKNIFTY PE & CE Levels(07/04/2025)Today will be huge gap down opening expected in banknifty near 1500+ points downside possible. Possible banknifty will open near 49750 level in today's session. After opening if any correction can reverse from 50450 level. Downside next support for banknifty is near 49550 level. If banknifty not hold this support level and starts trading below 49450 level then expected further selling and downside movement in index for 700-1000+ points upto the 48550 level.
Bankniftylevels

BankNifty levels - Apr 07, 2025Utilizing the support and resistance levels of BankNifty, along with the 5-minute timeframe candlesticks and VWAP, can enhance the precision of trade entries and exits on or near these levels. It is crucial to recognize that these levels are not static, and they undergo alterations as market dynamics evolve.
The dashed lines on the chart indicate the reaction levels, serving as additional points of significance. Furthermore, take note of the response at the levels of the High, Low, and Close values from the day prior.
We trust that this information proves valuable to you.
* If you found the idea appealing, kindly tap the Boost icon located below the chart. We encourage you to share your thoughts and comments regarding it.
Wishing you successful trading endeavors!
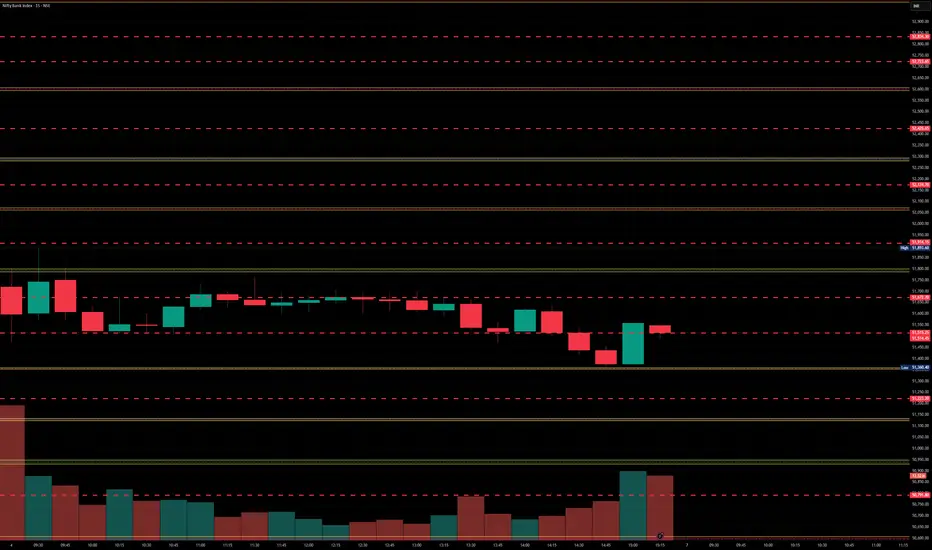
[INTRADAY] #BANKNIFTY PE & CE Levels(04/04/2025)Today will be gap down opening in banknifty. After opening if banknifty starts trading below 51450 level then expected downside upto 51050 level. For today's session 51000 level will act as a strong support for banknifty. Any major downside only expected below 50950 level. Strong upside rally possible if index starts trading and sustain above 51550 level.

BankNifty levels - Apr 04, 2025Utilizing the support and resistance levels of BankNifty, along with the 5-minute timeframe candlesticks and VWAP, can enhance the precision of trade entries and exits on or near these levels. It is crucial to recognize that these levels are not static, and they undergo alterations as market dynamics evolve.
The dashed lines on the chart indicate the reaction levels, serving as additional points of significance. Furthermore, take note of the response at the levels of the High, Low, and Close values from the day prior.
We trust that this information proves valuable to you.
* If you found the idea appealing, kindly tap the Boost icon located below the chart. We encourage you to share your thoughts and comments regarding it.
Wishing you successful trading endeavors!

[INTRADAY] #BANKNIFTY PE & CE Levels(03/04/2025)Today will be gap down opening expected in index. Expected opening near 51000 level. After opening if banknifty sustain above 51050 level then possible upside movement upto 51450 in opening session. But in case banknifty starts trading below 50950 level then expected sharp downside movement upto 400-500+ points and this can extend further upto 50050 in case it gives breakdown of 50450 level.

BankNifty levels - Apr 03, 2025Utilizing the support and resistance levels of BankNifty, along with the 5-minute timeframe candlesticks and VWAP, can enhance the precision of trade entries and exits on or near these levels. It is crucial to recognize that these levels are not static, and they undergo alterations as market dynamics evolve.
The dashed lines on the chart indicate the reaction levels, serving as additional points of significance. Furthermore, take note of the response at the levels of the High, Low, and Close values from the day prior.
We trust that this information proves valuable to you.
* If you found the idea appealing, kindly tap the Boost icon located below the chart. We encourage you to share your thoughts and comments regarding it.
Wishing you successful trading endeavors!

[INTRADAY] #BANKNIFTY PE & CE Levels(02/04/2025)Today will be slightly gap up opening expected in index near 51000 level. After opening it will face strong resistance at this level and expected reversal direction towards the 50550 level. This downside rally can extend for further 400-500+ points in case banknifty starts trading below 50450 level. Any bullish side rally only expected if banknifty starts trading and sustain above 51050 level.

BankNifty level - Apr 02, 2025Utilizing the support and resistance levels of BankNifty, along with the 5-minute timeframe candlesticks and VWAP, can enhance the precision of trade entries and exits on or near these levels. It is crucial to recognize that these levels are not static, and they undergo alterations as market dynamics evolve.
The dashed lines on the chart indicate the reaction levels, serving as additional points of significance. Furthermore, take note of the response at the levels of the High, Low, and Close values from the day prior.
We trust that this information proves valuable to you.
* If you found the idea appealing, kindly tap the Boost icon located below the chart. We encourage you to share your thoughts and comments regarding it.
Wishing you successful trading endeavors!
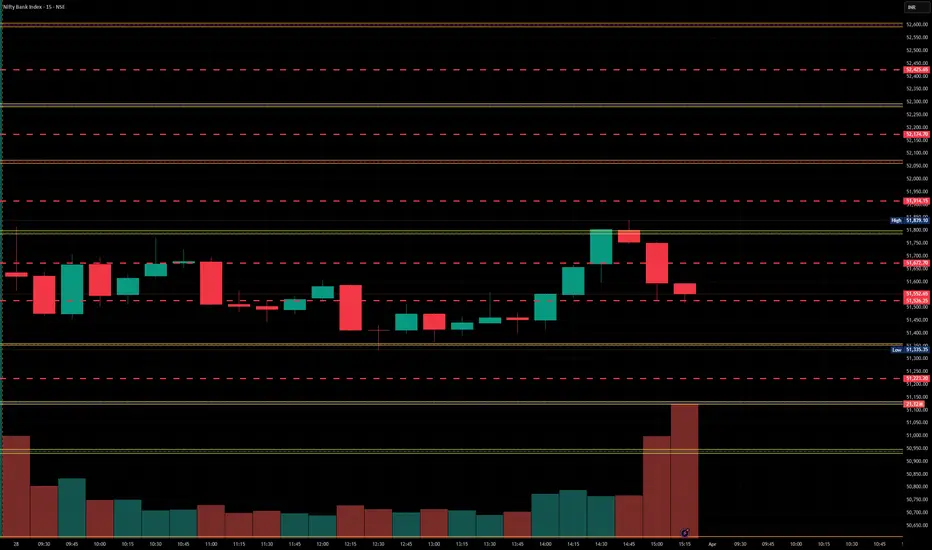
[INTRADAY] #BANKNIFTY PE & CE Levels(01/04/2025)Today will be flat or slightly gap down opening expected in index. After opening important level for banknifty is around 51500. If banknifty starts trading below 51450 level then expected downside movement upto 51050 level in today's session. Similarly if banknifty starts trading and sustain above 51550 level then there will be upside bullish rally upto 51950+ level possible.

BankNifty levels - Apr 01, 2025Utilizing the support and resistance levels of BankNifty, along with the 5-minute timeframe candlesticks and VWAP, can enhance the precision of trade entries and exits on or near these levels. It is crucial to recognize that these levels are not static, and they undergo alterations as market dynamics evolve.
The dashed lines on the chart indicate the reaction levels, serving as additional points of significance. Furthermore, take note of the response at the levels of the High, Low, and Close values from the day prior.
We trust that this information proves valuable to you.
* If you found the idea appealing, kindly tap the Boost icon located below the chart. We encourage you to share your thoughts and comments regarding it.
Wishing you successful trading endeavors!
[INTRADAY] #BANKNIFTY PE & CE Levels(28/03/2025)Today will be gap up opening expected in banknifty. After opening if banknifty starts trading above 52050 level then expected strong upside rally upto 52450+ level. any major downside only expected below 51450 level.

BankNifty levels - Mar 28, 2025Utilizing the support and resistance levels of BankNifty, along with the 5-minute timeframe candlesticks and VWAP, can enhance the precision of trade entries and exits on or near these levels. It is crucial to recognize that these levels are not static, and they undergo alterations as market dynamics evolve.
The dashed lines on the chart indicate the reaction levels, serving as additional points of significance. Furthermore, take note of the response at the levels of the High, Low, and Close values from the day prior.
We trust that this information proves valuable to you.
* If you found the idea appealing, kindly tap the Boost icon located below the chart. We encourage you to share your thoughts and comments regarding it.
Wishing you successful trading endeavors!
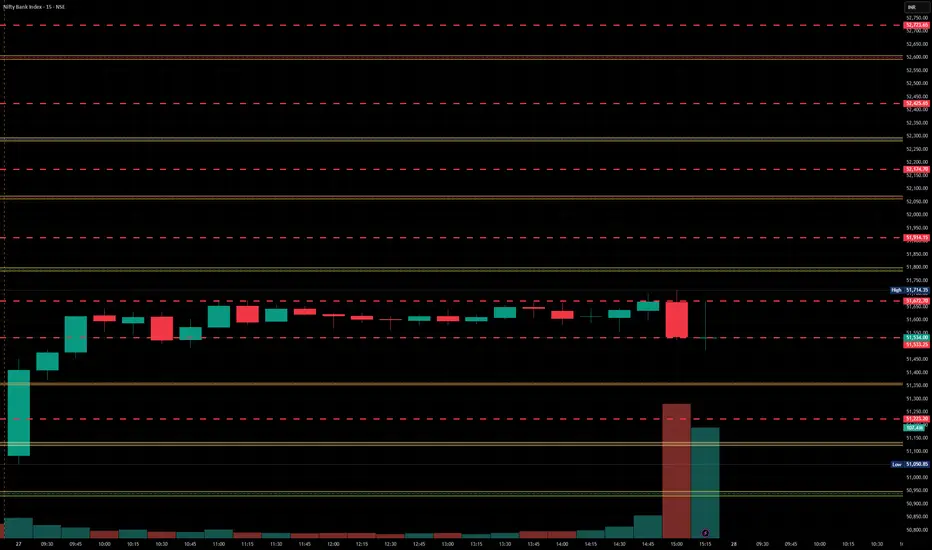
[INTRADAY] #BANKNIFTY PE & CE Levels(27/03/2025)Today will be slightly gap down opening expected in index. After opening possible banknifty consolidate in between the 51050-51450 level in today's session. Any upside rally only expected if banknifty starts trading and sustain above 51550 level. Major downside expected in index if it's give breakdown of 50950 level. This downside rally can goes upto 50550 level.

BankNifty levels - Mar 27, 2025Utilizing the support and resistance levels of BankNifty, along with the 5-minute timeframe candlesticks and VWAP, can enhance the precision of trade entries and exits on or near these levels. It is crucial to recognize that these levels are not static, and they undergo alterations as market dynamics evolve.
The dashed lines on the chart indicate the reaction levels, serving as additional points of significance. Furthermore, take note of the response at the levels of the High, Low, and Close values from the day prior.
We trust that this information proves valuable to you.
* If you found the idea appealing, kindly tap the Boost icon located below the chart. We encourage you to share your thoughts and comments regarding it.
Wishing you successful trading endeavors!

BankNifty levels - Mar 26, 2025Utilizing the support and resistance levels of BankNifty, along with the 5-minute timeframe candlesticks and VWAP, can enhance the precision of trade entries and exits on or near these levels. It is crucial to recognize that these levels are not static, and they undergo alterations as market dynamics evolve.
The dashed lines on the chart indicate the reaction levels, serving as additional points of significance. Furthermore, take note of the response at the levels of the High, Low, and Close values from the day prior.
We trust that this information proves valuable to you.
* If you found the idea appealing, kindly tap the Boost icon located below the chart. We encourage you to share your thoughts and comments regarding it.
Wishing you successful trading endeavors!

[INTRADAY] #BANKNIFTY PE & CE Levels(24/03/2025)Today will be gap up opening in banknifty. After opening expected upside rally upto 50950+ level in today's session. This upside rally can be extend for further 400-500+ points in case banknifty gives breakout and starts trading above 51050 level. Any major downside move only expected below 50450 level.

[INTRADAY] #BANKNIFTY PE & CE Levels(21/03/2025)Today will be flat opening expected in banknifty. After opening if it's sustain above 50050 level then expected upside rally upto 50450+ level in opening session. Any major downside only expected below 49950 level. Downside 49550 level will act as a strong support for today's session.

[INTRADAY] #BANKNIFTY PE & CE Levels(19/03/2025)Today will be gap up opening in index. Expected opening above 49500 level. After opening if it's sustain above this level then this upside rally can goes upto 49950+ level in opening session and it can be extend for further 400-500+ points in case banknifty starts trading above 50050 level. Any downside possible below 49450 level. Downside 49050 level will act as strong support level for today's session.

[INTRADAY] #BANKNIFTY PE & CE Levels(18/03/2025)Today will be gap up opening expected in index. After opening if banknifty sustain above 48550 level then possible strong upside rally upto 48950+ level and this rally can be extend for further 400-500+ points in case banknifty starts trading above 49050 level. 48950 level will act as a resistance level for upside rally. Expected reversal from this level. Any major downside only expected below 48450 level.

[INTRADAY] #BANKNIFTY PE & CE Levels(17/03/2025)Flat opening expected in index. Currently banknifty giving consolidated movements. near 48000 level. Upside 48450 level is acting as a strong resistance. Any bullish side rally can reversal from this level. Downside possible below 47950 level. In case banknifty starts trading below this level then possible fall upto 47550 level. Any major trend movement only expected if banknifty starts trading above 48550 or below 47450 level.

[INTRADAY] #BANKNIFTY PE & CE Levels(13/03/2025)Today will be flat opening expected in index. Currently market consolidating in small range. Expected breakout of this consolidation zone in today's session. If banknifty sustain above 48050 level then possible upside move upto 48450. Also, In case banknifty starts trading below 47950 level can gives sharp downside rally of 400-500+ points. Downside 47550 level will act as a support for today's session.

[INTRADAY] #BANKNIFTY PE & CE Levels(12/03/2025)Today will be flat or slightly gap up opening expected in banknifty. 48050-47950 zone will act as a resistance for banknifty. Any bullish side rally only expected above this zone. Currently market consolidating in small range any downside rally possible below 47950 level this downside movement can goes upto the 47550 in today's session. If banknifty gives breakdown of consolidation zone.

[INTRADAY] #BANKNIFTY PE & CE Levels(10/03/2025)Today will be flat opening expected in index. It will open near 48500 level. After opening any bullish side rally only expected if banknifty starts trading and sustain above 48550 level. Strong downside movement possible if banknifty gives breakdown of 48450 zone. Downside 48050 level expected after the breakdown.
