BANKNIFTY : Trading Levels and Plan for 04-Nov-2024Intro for Previous Day's Chart Pattern:
In the last two trading session, Bank Nifty displayed a mixed trend with a bounce off the support levels, suggesting buying interest from lower zones. Key resistance levels emerged near the higher range, where sellers maintained pressure. As per the chart, Yellow indicates a potential Sideways trend, Green shows a Bullish trend, and Red highlights a Bearish trend.
---
Trading Plan for 04-Nov-2024:
Opening Scenarios:
Gap Up Opening (200+ points):
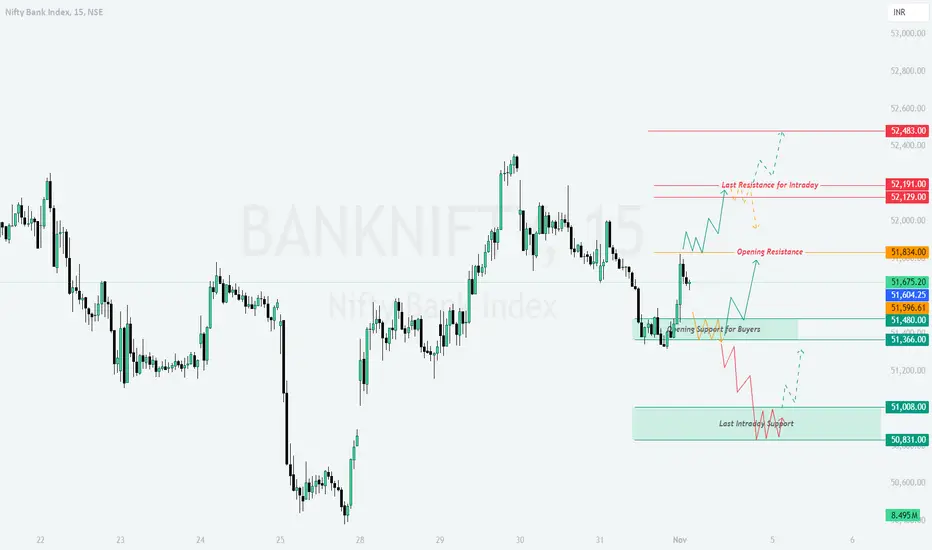
If Bank Nifty opens with a significant gap up around 52,191 or higher:
- Watch for resistance near 52,191 (marked as “Last Resistance for Intraday”). A strong breakout above this level may provide momentum for further upside.
- If the price holds above 52,129, consider initiating long positions, but be cautious of quick pullbacks near 52,483, the higher resistance zone.
- If resistance holds, wait for confirmation before shorting, as the price may consolidate or pull back slightly to retest lower support levels.
Flat Opening:
If Bank Nifty opens flat around 51,675:
- Focus on the immediate resistance level of 51,834. A decisive break above this level can push prices toward the 52,000+ range.
- If prices struggle to breach 51,834, consider waiting for a dip towards 51,480, which is the “Opening Support for Buyers,” to enter long positions.
- For intraday shorts, wait for bearish confirmation near 51,834 before targeting lower levels, particularly if the price heads toward the 51,366 support area.
Gap Down Opening (200+ points):
If Bank Nifty opens with a gap down near 51,366 or lower:
- Observe the support zone around 51,366 and 51,008. If the price stabilizes in this range, it could be a good entry for long trades with a target towards 51,604.
- If 51,008 (Last Intraday Support) is breached, further downside could follow, potentially dragging the index down to the 50,831 level.
- Look for confirmation of strength or weakness before entering positions, as gap-down openings may lead to volatile price action.
---
Risk Management Tips for Options Trading:
- Use tight stop-losses in the volatile market conditions post-Diwali to avoid sharp losses.
- Avoid over-leveraging. Consider position sizing that aligns with your risk tolerance, especially near key support and resistance levels.
- Monitor option premiums closely, as high volatility can lead to rapid premium decay.
- In case of significant volatility, consider exiting options positions early to preserve gains or limit losses.
---
Summary and Conclusion:
The 04-Nov-2024 session holds potential for a continuation of recent trends, with key resistance and support levels in focus. Look for clear breakouts above resistance or signs of support holding to confirm directional bias. Sideways movement within key zones may indicate consolidation, while breaks beyond these zones may drive a more directional move.
Disclaimer: I am not a SEBI-registered analyst. This trading plan is shared for educational purposes. Please conduct your analysis or consult a financial advisor before making any trading decisions.
Bankniftyoptions
BANKNIFTY : Trading Levels and Plan for 31-10-2024
Intro:
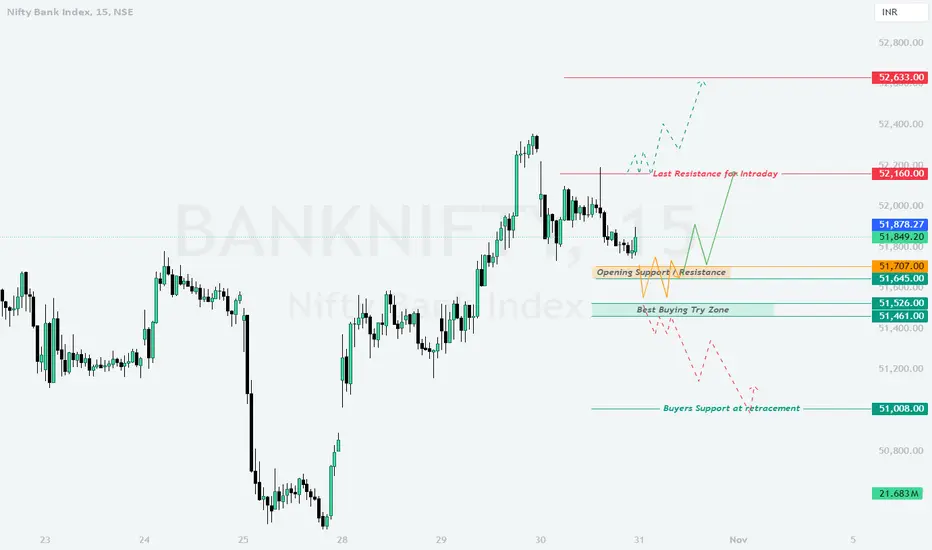
On the previous trading day, Bank Nifty experienced a range-bound movement with significant support and resistance levels being respected. For the upcoming session on 31-Oct-2024, we have identified key levels, with yellow marking the sideways trend, green indicating bullish movement, and red representing bearish tendencies. This plan includes strategies for each opening scenario.
Trading Plan for 31-Oct-2024
Gap Up Opening (200+ points above)
If Bank Nifty opens with a 200+ point gap up, it may quickly test the Last Resistance for Intraday near 52,160 . If the price can sustain above this level, a further move towards 52,633 is likely. However, if the index fails to hold above 52,160 , it may experience a retracement to the Opening Support/Resistance level at 51,707 .
– Watch for signs of rejection at the 52,160 level, as this may prompt a reversal towards support levels.
Flat Opening (within 50 points of the previous close)
In the case of a flat opening, the immediate level to observe is 51,849 . Sustaining above this point could enable a bullish move towards 52,160 . Failure to maintain momentum above 51,849 may result in sideways movement around the Opening Support/Resistance at 51,707 or even lead to a test of the Best Buying Try Zone near 51,645 .
– A move below 51,645 would likely signal weakness, potentially driving the index lower towards 51,526 .
Gap Down Opening (200+ points below)
A gap-down opening would bring Bank Nifty closer to the Best Buying Try Zone at 51,645 . A bounce from this area could lead the index back to 51,849 . However, if this level does not hold, watch for further decline towards the Buyers Support at Retracement at 51,008 .
– Persistent weakness below 51,008 would indicate a bearish sentiment, with potential downside targets emerging.
Risk Management Tips for Options Trading
Define your risk tolerance and adjust your position size accordingly.
Consider using protective strategies, such as stop-loss orders, especially around key resistance/support zones.
Avoid over-leveraging, and monitor volatility closely to avoid sudden adverse moves.
Summary and Conclusion
Key levels for Bank Nifty on 31-Oct-2024 include 52,160 on the upside and 51,645 on the downside. Monitor these levels closely for directional cues. Employ disciplined risk management to navigate through the volatility, especially when trading options.
Disclaimer:
I am not a SEBI-registered analyst. This analysis is based on technical levels and reflects my personal view. Please perform your own analysis or consult a financial advisor before trading.
BANKNIFTY Lon Trade Setup on 15m Timeframe.Fresh long trade on BANKNIFTY.
Not at office today, so updating this trade from my phone.

BankNifty Crashes Through All Targets – Bears in Control!BankNifty 15m Timeframe Technical Analysis:
On the 15-minute timeframe, BankNifty has completed a spectacular short trade, smashing through all targets with strong bearish momentum. Price plunged well below the Risological dotted trendline, confirming the continued downtrend.
Key Levels:
Entry: 51,620.00
Stop Loss (SL): 51,700.75
Target 1 (TP1): 51,520.15 (Done)
Target 2 (TP2): 51,358.60 (Done)
Target 3 (TP3): 51,197.05 (Done)
Target 4 (TP4): 51,097.20 (Done)
Observations:
A sharp decline occurred right after entry, and price respected the Risological dotted trendline as resistance throughout the trade.
Bears dominated the session, pushing the price lower without retracing back to the trendline.
BankNifty's steep descent through all target levels underscores the market's bearish sentiment. With all targets achieved, traders may look for further downside potential or await signs of reversal.

BANKNIFTY Short Entry – BIG Targets Await!We’ve entered a short trade on BANKNIFTY based on a clear bearish signal at 51733.25. The setup looks strong, and we're now awaiting the targets to hit.
Key Levels
Entry: 51733.25 – Initiated as bearish momentum took hold.
Stop-Loss (SL): 52155.40 – Positioned above the entry to manage risk.
Take Profit 1 (TP1): 51211.50 – First target expected to be reached soon.
Take Profit 2 (TP2): 50367.25 – Next key level to watch.
Take Profit 3 (TP3): 49523.00 – Anticipating continued selling pressure to hit this target.
Take Profit 4 (TP4): 49001.25 – The ultimate target in this short trade.
Trend Analysis
The price is moving decisively below the Risological Dotted Trendline, confirming a strong downtrend. All indicators suggest that the targets are within reach as selling pressure builds.
This is going to be a high profit trade if it works out as per the chart. But, let's be ready for rude surprises and have the trailing stop at 51,748 in worst case scenario.

Bank nifty Analysis for Tomorrow 23/10/24Bank nifty Analysis for Tomorrow 23/10/24
Here are the Levels for Bank nifty Using Trendlines, technical analysis or Fib level
For Options Traders(Specially Buyers)
My humble Request with you pls Do trade After 2pm for less Brokerage and Taxes and More Profit.
To Become a Profitable Option Buyer pls Come For trade after 2 pm.

Bank Nifty 22nd Oct 2024All important levels, biases and trade ideas marked up on the chart. Follow on X for updates. @anup_kavi

Level for Tomorrow 16/10/24 BANKNIFTYHere's the level for banknifty tomorrow 16/10/24
Tomorrow bank nifty will out from the consolidation zone and give a good move.

BankNifty Trading SetupBankNifty has been trading within a 400-point range since Monday, Tuesday, and Wednesday, sustaining near its all-time high (ATH). If BankNifty crosses above 54,200 on Thursday and holds above that level for at least 15 minutes, our first target will be 54,400, and the second target will be 54,600.
This is for educational purposes only. We are not SEBI registered.

BankNifty 1600+ Points Gain in 7 days! Using RisologicalBankNifty CRAZZZZZY Gains using the Risological indicators.
Do I have to say a word?
Massive 1600 points gain, and still looking solid on the 15m time frame.
This is the beauty of trading the options in 15 min time frame.
Yes, you would need more capital compared to the weekly contracts.
I have been trading the Nifty, Banknifty and MidCPNifty in 15m time frame from almost 2 years now, and I have no regrets.
Some points to keep in mind using this Risological strategy:
- Use 15m time frame chart
- Apply Risological swing trader indicator
- Buy monthly contracts, that have at-least 15 days time till expiry.
- Catch big moves
All the best and namaste!

BankNifty Index Short SellBankNifty Index Short Sell
Sell BankNifty if it crosses below 52,400. The expected target price is 52,200.

Banknifty Intraday Levels: 18-Sep-24 Index closed at support Zone.
Wait for breakout or Rejections at zones for Entry
Bullish > 52250
Bearish< 52000

Bank Nifty Podcast 17 Sep 2024Today, only 1 trade setup was available based on Podcast Strategy.
- When the Podcast entry had come, just before that 5minute candle closed both below and above Opening Price - 52239
- The Data was -ve, and 2 departments were bullish. So again, looked at the strikes 52200 and 52300, where Put writers increased to give momentum toward 52400.
- The stoploss was hit, as call writers increased at the strike 52300.
Notes:
- Simultaneously, a selling strategy was executed based on Price Action, which gave 0.5% return on the capital.

Banknifty Intraday Levels : 17-Sep-24Index closed at Resistance with double top pattern Respected Trendline Support. Wait for Rejections or Breakout on levels for Entry
Bullish > 52220
Bearish< 52100

Bank Nifty Podcast 13 Sep 2024There were three setups available, out of which two setups were taken based on Option Chain Data.
Setup #2 - Stoploss Hit, although the Changing in OI data was positive and all the four departments were "Bullish".
Setup #3 - I was ready to take another trade on CE side, due to data being highly positive.
---------
Notes:
- Taking trade without data is risky, as even with 50% risk the stoploss increases the loss as equal as taking 100% complete trade. So I would always avoid such trade and hold my nerves to avoid FOMO of getting into any such trades.

BANKNIFTY TODAY - Opens with a gap Up, Targets Marked for YouAfter a good upside rally, BankNifty has been on sideways from 2 straight days.
Can the gapup today give it further bullish momentum? Only time will tell.
But, Iam prepared to catch the best trades with this Risological strategy.
Banknift CE buy side setup, it is!
Good luck, folks!
Namaste 🙏

Bank Nifty Podcast 29 Aug 2024Only 1 trade was taken.
The trade was based on podcast levels with CE side. The OI data was slightly positive and also 3 departments were "Bullish" from 4 departments of Option Chain.
The risk to reward was 0.66 which qualifies the min. required risk to reward for the podcast setup.

Bank Nifty Podcast 28 Aug 2024Today, I had taken only 1 trade.
The trade was taken as per podcast levels, although data was negative and 3 out of 4 OI departments were negative, so PE side was taken with 50% risk using Credit Spread Strategy of same expiry strikes.

[INTRADAY] #BANKNIFTY PE & CE Levels(28/08/2024)🔔 Bank Nifty Update for Today:
📊 Expected Opening:
Opening Outlook: Flat
📈 Consolidation Zone:
Range: 51050 - 51450
Bank Nifty is expected to open flat today. The levels between 51050 and 51450 are likely to be a consolidation zone.
📈 Potential Upside Movement:
Strong Rally: Expected if Bank Nifty starts trading above 51550
If Bank Nifty breaks out above 51550, a strong upside rally is anticipated.
📉 Downside Risk:
Major Downside: Only expected if the index breaks down below 50950
Any significant downside is likely only if Bank Nifty gives a breakdown below 50950.

Bank Nifty Podcast 27 Aug 2024Took two trades today.
1st trade was taken with 50% risk which means instead of max loss of 1000, I took only 1 lot with 500 risk. The 50% risk was taken because OI data was completely positive and 4 departments were "Bullish".
2nd trade was taken with maximum conviction as the data was positive and 4 departments were "Bullish", but looks like Bank Nifty had some other plans. The market remained sideways for sometime which resulted in decay in the premiums.
Notes:
- Never take any trade even with 50% risk, because sometimes "No trade is also good trade"
- 2nd trade should have been taken with debit spread as next day is expiry and already Bank Nifty had moved more than 200 points.

Bank Nifty Podcast 23 Aug 2024Total three trades were taken .
1st trade was taken on 5minute timeframe when the candle reverses from the OI line and closed with 1:1 Target
2nd trade was taken on Podcast Setup , closed the trade with stoploss. Although the OI data was positive, but the 4 department was neutral, where 2 department was showing Bullish and 2 department was showing bearish.
3rs trade was again taken on Podcast setup and closed with 1:1 target.
Notes:
- There were 3 trades based on 5minute timeframe from the OI line 51000, but I took only the one before 10AM.

Bank Nifty Podcast 22 Aug 2024Two trades were taken today.
1st trade was on Gap up/down strategy, here the profit was booked early due to thick line which is the OI line 51000, where there was early rejection and strong resistance from the Call Side.
2nd trade was purely based on Podcast levels with Data positive and 4 department of OI being positive, still the Bank Nifty moved in the another direction and stoploss was hit.
Notes:
- Gap up/down Strategy needs to be taken if there's enough space based on ATR lines and OI lines or any thick Lines. Although this isn't mandatory, but good to follow.
- OI change needs to be checked in realtime, and since NIFTY was on opposite direction of the trade, a straddle of both Bank NIFTY and NIFTY would have worked in the favor.
Optional:
- Straddle setup at the ATM strikes when NIFTY OI data is positive and Bank NIFTY data is negative or vice versa on both of the indices.
- Profit/Loss with 1 lot : Rs.2,000/-
- Setup only when the data becomes opposite to each other
- Close only when the market closes or profits or stoploss is seen in total MTM
- Margin Required for both the straddle setup is 2L

Banknifty Intraday Levels: 12-Aug-24Banknifty closed near support area , wait for breakout or proper rejections
Bullish > 50650
Bearish< 50350
Important Zones Marked on Chart
