BANKNIFTY : Trading levels and plan for 02-Dec-2024Bank Nifty Trading Plan for 02-Dec-2024
On 01-Dec-2024, Bank Nifty exhibited a balanced market structure, fluctuating between the Golden Retracement Zone for sellers (52,221–52,283) and key supports near 51,545 and 51,181. The market witnessed multiple Change of Character (ChoCH) formations, indicating short-term trend reversals. The chart highlighted Yellow Zones for sideways consolidation, Green Zones for bullish trends, and Red Zones for bearish trends. Significant resistance near 52,583 capped the upward moves, while supports near 51,444 and 51,181 limited the downside.
Detailed Trading Plan for 02-Dec-2024
Gap-Up Opening (Above 52,221, up to 200+ points)
If Bank Nifty opens with a gap-up beyond 52,221, it enters the Golden Retracement Zone for sellers (52,221–52,283):
Plan A (Bearish Scenario): Look for a rejection near 52,283. If confirmed, initiate short positions targeting 52,221 first, followed by 52,023 as a second target.
Plan B (Bullish Scenario): If Bank Nifty breaks above 52,283 and sustains for an hourly candle, consider going long with targets of 52,583 and the Last Intraday Resistance at 52,829.
Avoid aggressive buying near 52,283 unless a strong breakout is evident. Let the price action validate the trend.
Flat Opening (Between 52,023 and 51,937)
In the event of a flat opening, focus on the immediate support and resistance levels around 52,023 (Opening Support):
Plan A (Bullish Scenario): If prices hold above 52,023, initiate long positions, targeting 52,221 and 52,283.
Plan B (Bearish Scenario): If Bank Nifty falls below 52,023, expect a move toward the No Trade Zone near 51,937–51,840. Breach of 51,840 could lead to a test of 51,545.
Monitor momentum indicators closely during flat openings, as they often provide early signals for directional bias.
Gap-Down Opening (Below 51,840, down to 200+ points)
A gap-down opening below 51,840 signals bearish sentiment:
Plan A (Bullish Reversal): Observe if buyers defend 51,545 or 51,444. If a reversal pattern emerges, go long, targeting 51,840 and 51,937.
Plan B (Extended Bearish Move): If 51,444 is decisively broken, expect further downside toward 51,181 and 51,081, which are the extended retracement levels for buyers.
In gap-down scenarios, trade smaller lot sizes initially to manage risk effectively in volatile conditions.
Risk Management Tips for Options Traders
Avoid overtrading near critical levels like 52,283 or 51,545 without clear confirmation.
Use strategies such as Iron Condors or Straddles to capitalize on range-bound movements in Yellow Zones.
Always hedge directional trades, especially near volatile zones like the Opening Resistance or Support.
Summary and Conclusion
Bank Nifty’s key levels for 02-Dec-2024 include 52,283 (Opening Resistance), 51,937–51,840 (No Trade Zone), and 51,545 (Support for Consolidation). Yellow zones indicate potential sideways action, while Green and Red zones guide bullish and bearish trends. Exercise caution around high-impact levels and focus on hourly candle closures for trend validation.
Disclaimer
I am not a SEBI-registered analyst. This analysis is for educational purposes only. Please consult your financial advisor before making trading decisions.
Bankniftyprediction

banknifty forecast | 29th Nov'2024Price is at a strong support zone, likely to turn bullish to grab buy-side liquidity, then may turn bearish or consolidate. Enter only after confirmation.

BANKNIFTY : Analysis, Levels and trading Plan
On the previous trading day, Bank Nifty exhibited significant volatility with a Change of Character (ChoCH) around ₹51,904, highlighting a potential shift in market structure. The index hovered near the Extended Retracement Zone and tested liquidity areas multiple times. Sellers maintained control near ₹52,342 (Golden Retracement Zone), while the buying attempts around ₹51,816 indicated weakening demand. Yellow represents a sideways trend, green indicates bullish potential, and red signals bearish sentiment.
Here’s the detailed plan for all opening scenarios (Gap Up, Flat, and Gap Down):
Gap Up Opening (+200 points or more above ₹51,983)
Resistance Zone Focus (₹52,342-₹52,583): A gap-up opening above ₹51,983 would push Bank Nifty closer to the Golden Retracement Zone for sellers. Watch for bearish patterns like bearish engulfing or evening stars in this area.
Action Plan:
Entry: Short near ₹52,342 after bearish confirmation.
Target: ₹51,924 (support zone) and ₹51,816 (extended retracement).
Stop Loss: Above ₹52,600 to manage risk effectively.
Breakout Potential (Above ₹52,583): If the index sustains above ₹52,583 with strong volume, it could signal bullish momentum toward higher levels.
Action Plan:
Entry: Long above ₹52,583 after confirmation with a 15-minute candle close.
Target: ₹52,800-₹53,000.
Stop Loss: Below ₹52,400 to avoid false breakouts.
Flat Opening (Near ₹51,983)
Opening Support/Resistance Zone (₹51,924-₹51,983): If the market opens flat, the initial focus will be on whether Bank Nifty holds above ₹51,924. A decisive break above or rejection from this zone will guide further action.
Action Plan for Bullish Scenario:
Entry: Long above ₹51,983 with strong buying momentum.
Target: ₹52,342 and ₹52,583.
Stop Loss: Below ₹51,900 to limit downside risk.
Action Plan for Bearish Scenario:
Entry: Short below ₹51,924 after confirming selling pressure.
Target: ₹51,816 and ₹51,571.
Stop Loss: Above ₹52,000 for safety.
Extended Retracement Zone (₹51,816): If the index drifts below ₹51,924, monitor the demand zone near ₹51,816 for potential buying interest.
Look for bullish candlestick patterns like hammers or morning stars.
Gap Down Opening (-200 points or more below ₹51,983)
Failure of Demand (₹51,571-₹51,499): A gap-down opening below ₹51,816 will test lower retracement zones. If buyers fail to hold at ₹51,571, the bearish trend may intensify.
Action Plan:
Entry: Short below ₹51,571 with bearish confirmation.
Target: ₹51,274 (key buyer support).
Stop Loss: Above ₹51,700 to minimize risk.
Buyers’ Support (₹51,274): If Bank Nifty approaches the buyers' support zone near ₹51,274, look for reversals as this is a historically strong support level.
Action Plan:
Entry: Long near ₹51,274 after bullish reversal patterns form.
Target: ₹51,571 and ₹51,816.
Stop Loss: Below ₹51,150 to manage risk.
Risk Management Tips for Options Trading
Position sizing is key: Do not risk more than 2% of your trading capital on any single trade.
Avoid over-leveraging by sticking to liquid options with balanced premiums.
Use defined strategies like debit spreads or credit spreads to cap losses.
Focus on the implied volatility (IV) and avoid trading options with extremely high or low IV.
Avoid trading in the first 15 minutes, as the market is prone to excessive volatility during this period.
Summary and Conclusion
The Bank Nifty is poised to trade within well-defined zones, with ₹51,924 as the immediate pivot level. A breach of ₹52,342 could lead to a bullish rally, while failure at ₹51,571 would extend the bearish momentum. Stick to the plan and use confirmation patterns before entering trades.
Disclaimer:
I am not a SEBI-registered analyst. This analysis is for educational purposes only. Please consult your financial advisor or do your research before taking any trading positions.

Banknifty | 28th Nov'2024 Forecast | NSEMany retail traders have buy orders (buy-side liquidity) that big players (institutions) can take.
First, they grab all the buy-side liquidity.
Next, they target sell-side liquidity by creating false breakouts.
Then, they push the price down to a strong support or demand zone (bearish move).
After that, they reverse the price up (bullish move) and take any remaining buy-side liquidity.
DM to learn more about liquidity and how big players think in the market!

BANKNIFTY : Trading Levels and Plan for 28-Nov-2024Trading Plan for Bank Nifty - 28th November 2024
Introduction:
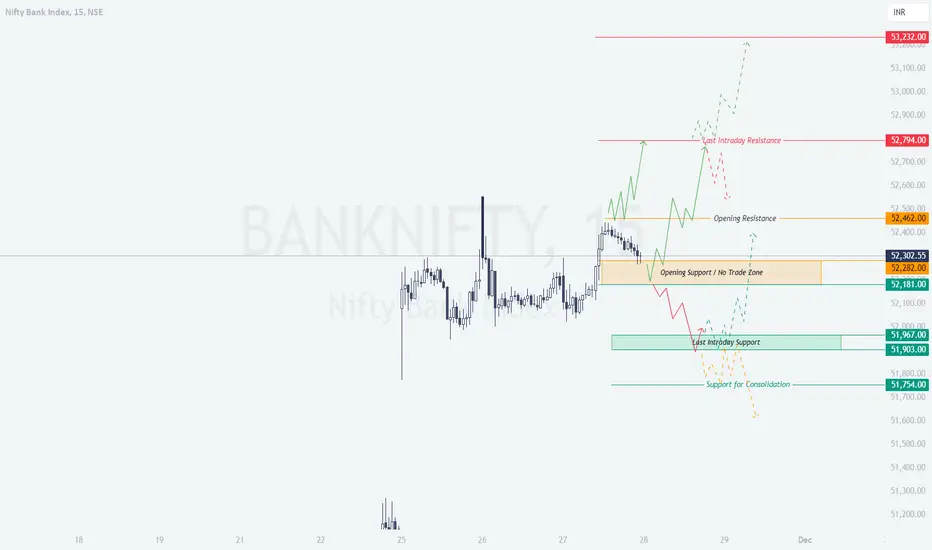
On 27th November 2024, Bank Nifty exhibited a choppy session as it oscillated within a tight range, highlighted by the Yellow Zone (52,181–52,282), which served as the "Opening Support / No Trade Zone." The index attempted to breach its "Opening Resistance" at 52,462, but selling pressure pushed it back into consolidation. Key support at 51,903 held firm, aligning with the Green Zone, indicating bullish support levels. For 28th November 2024, critical levels include 52,794 as the last intraday resistance and 51,754 as the support for potential consolidation.
Plan for Different Opening Scenarios:
Gap-Up Opening (200+ Points Above Close):
If Bank Nifty opens between 52,462–52,794, it is crucial to wait for confirmation of bullish momentum. A breakout above 52,794 with an hourly close signals continuation towards 53,232, which serves as the "Profit Booking Zone."
Rejection near 52,794 can lead to a pullback into the "Opening Resistance" zone (52,462), offering a better entry for long positions.
If the market opens directly above 52,794, avoid aggressive longs. Wait for retests towards 52,794 or the "Opening Resistance" for safe entries.
Risk Management Tip: Use trailing stop losses for call options (52,800 CE) to protect profits in a trending market.
Flat Opening (Near Previous Close at 52,302):
If Bank Nifty opens flat, avoid trading immediately within the Yellow Zone (52,181–52,282). Wait for a breakout above 52,282 to initiate long trades targeting 52,462 and 52,794.
A breakdown below 52,181 signals bearish momentum towards 51,967, the "Last Intraday Support Zone." Monitor for reversals or trend continuation.
Intraday traders can use the breakdown below 51,967 for short opportunities targeting 51,754, but ensure confirmation with an hourly close.
Risk Management Tip: Consider deploying iron condors to benefit from limited movement within the range, as flat openings often lead to range-bound trading.
Gap-Down Opening (200+ Points Below Close):
If Bank Nifty opens between 51,903–51,754, watch for bullish reversal patterns in the Green Zone. A strong reversal from 51,903 can offer long opportunities targeting 52,181 and 52,282.
A breakdown below 51,754 could trigger aggressive selling, targeting lower levels near 51,544. Exercise caution while shorting near support zones unless there is decisive volume.
Avoid chasing shorts below 51,754 until a retest of the breakdown level confirms further bearish action.
Risk Management Tip: Opt for buying put spreads (51,800 PE - 51,600 PE) to minimize risk and maximize reward in a bearish scenario.
Tips for Risk Management in Options Trading:
Always use defined stop losses based on hourly candle closures to avoid emotional decisions.
Avoid placing large trades in the "No Trade Zone," as price movements here can be choppy and unreliable.
Opt for hedged positions (like spreads) to protect against time decay in case of low volatility.
Gradually scale into positions rather than committing full capital at once.
Exit trades decisively if the price invalidates the level you're trading around, as sticking to invalid trades can erode capital.
Summary and Conclusion:
For 28th November 2024, the plan revolves around key levels:
Bullish above 52,282, with targets at 52,462, 52,794, and 53,232.
Bearish below 52,181, with targets at 51,967, 51,754, and potentially lower.
Respect the "No Trade Zone" between 52,181–52,282 to avoid getting caught in false moves.
Patience and adherence to the plan will enable you to navigate Bank Nifty's movements confidently.
Disclaimer:
I am not a SEBI-registered analyst. The above analysis is for educational purposes only. Please conduct your own research or consult with a financial advisor before making trading decisions.
BANKNIFTY : Trading Levels and Plan for 27-Nov-2024Trading Plan for Bank Nifty - 27th November 2024
Introduction:
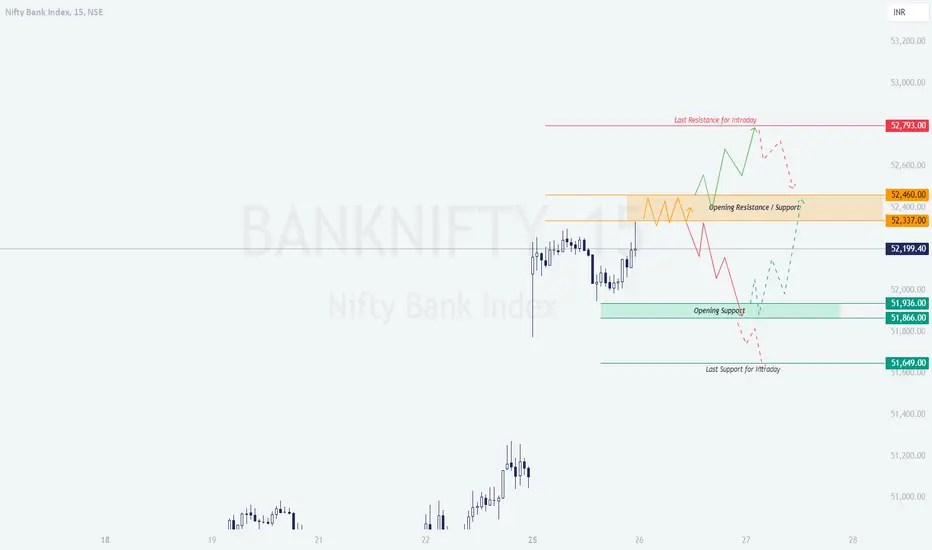
On 26th November 2024, Bank Nifty traded within a consolidation phase, evident from the "No Trade Zone" (Yellow Trend) between 52,202–52,315. This range indicated indecision, with strong resistance above 52,459 and key support levels below 51,944. The bullish structure (Green Trend) dominates above 52,459, targeting the Profit Booking Zone at 52,794, while bearish momentum (Red Trend) intensifies below 51,870, pushing prices towards 51,544. This framework sets the tone for actionable trading levels.
Plan for Different Opening Scenarios:
Gap-Up Opening (200+ Points Above Close):
If Bank Nifty opens above 52,315 but below 52,459, wait for price action confirmation. A breakout above 52,459 with an hourly candle close indicates bullish momentum targeting 52,794 (Profit Booking Zone).
If the market opens directly near or above 52,459, avoid chasing long trades immediately. Wait for a pullback to 52,315–52,459 for better risk-reward.
Watch for rejection candles near 52,459, signaling potential reversals into the "No Trade Zone."
Risk Management Tip: Consider buying 52,800 CE for bullish scenarios but with a stop loss below 52,315 on an hourly close basis.
Flat Opening (Near Previous Close at 52,178):
If the market opens flat, avoid immediate trades within the No Trade Zone (52,202–52,315). Allow a clear breakout above 52,315 for bullish opportunities or a breakdown below 52,202 for bearish setups.
A breakout above 52,315 targets 52,459, while a breakdown below 52,202 could lead to 51,944 and 51,870 (First Buyer’s Support).
Monitor price action around 51,870, as it serves as critical support for potential reversals or fresh bearish momentum.
Risk Management Tip: Deploy straddles or strangles to capitalize on potential directional moves after the initial range breakout.
Gap-Down Opening (200+ Points Below Close):
If Bank Nifty opens below 51,944, watch for buying interest at 51,870 or the Best Buy Zone at 51,830. Bullish reversal patterns here can offer excellent long opportunities.
A breakdown below 51,870, confirmed by an hourly close, may trigger further bearish momentum towards 51,544 (Last Support Zone).
Avoid aggressive short positions near 51,870–51,830 unless price decisively breaks this zone with volume.
Risk Management Tip: For bearish plays, consider buying 51,600 PE with a strict stop loss above 51,944.
Tips for Risk Management in Options Trading:
Trade with defined stop losses based on hourly candle closures to avoid overtrading.
Use option spreads to manage high premiums during volatile openings.
Focus on liquidity and avoid deep out-of-the-money options.
Gradually scale into positions to manage risk during gap openings.
Avoid holding overnight positions unless they align with the trend and key levels.
Summary and Conclusion:
For 27th November 2024, the key levels to focus on are:
Bullish above 52,315, with targets at 52,459 and 52,794.
Bearish below 51,870, with targets at 51,830 and 51,544.
Avoid trading in the "No Trade Zone" (52,202–52,315) unless a breakout or breakdown is confirmed.
Patience, discipline, and adherence to the plan will help navigate Bank Nifty's movements effectively.
Disclaimer:
I am not a SEBI-registered analyst. The above analysis is for educational purposes only. Please conduct your research or consult with a financial advisor before making any trading decisions.

BANKNIFTY : Trading Levels and Plan for 26-Nov-2024Bank Nifty Trading Plan for 26th November 2024
Intro:
In the previous trading session, Bank Nifty showed a strong upward movement but faced resistance near the 52,200 - 52250 level, forming a consolidation pattern. The chart indicates key levels for the next trading day. Yellow trendlines represent a sideways movement, green trendlines represent a bullish trend, and red trendlines indicate a bearish trend. Based on the chart, here’s a detailed trading plan for 26th November 2024, covering all potential opening scenarios.
Gap Up Opening (200+ Points Above Previous Close):
If Bank Nifty opens above 52,460, the index will enter a key resistance zone (52,460–52,793). Watch for a breakout above 52,793. If it sustains above this level, look for bullish opportunities toward the next target at 53,200. If resistance at 52,460–52,793 holds and Bank Nifty shows signs of rejection, a pullback to 52,337 or even 52,199 is possible. Be cautious about reversals in this zone. Avoid aggressive longs if the price struggles near 52,460 and fails to break out decisively.
Flat Opening (Within ±50 Points):
Monitor price action at 52,337–52,460. This zone will act as the immediate resistance. If Bank Nifty consolidates or shows rejection here, expect a move toward the opening support at 51,936–51,866. For bullish opportunities, wait for a breakout above 52,460 with strong volume confirmation. Targets remain 52,793 and 53,200. If the index breaks below 52,199, the bearish scenario will dominate, and we may see levels around 51,866 or even the last intraday support at 51,649.
Gap Down Opening (200+ Points Below Previous Close):
A gap down below 52,199 will bring the focus to the 51,936–51,866 support zone. Watch for reversal patterns or strong buying cues in this area for a possible upward bounce. If the price breaks below 51,866, the index could slide further to test 51,649. A failure to hold 51,649 may trigger a deeper bearish move toward 51,500 or lower. Any bullish attempts will require the index to reclaim 52,199 with conviction before targeting 52,337 or higher.
Risk Management Tips for Options Trading: Always calculate risk-reward before entering a trade. Avoid taking trades with a risk-reward ratio below 1:2. Keep position size small, especially if trading volatile options or on uncertain days. Use stop-loss orders for every trade and stick to them. For intraday trading, avoid carrying losses into the next day. Avoid chasing trades after a significant move; wait for pullbacks or clear confirmation. Monitor implied volatility (IV) while trading options. High IV means premium decay can occur rapidly if momentum stalls.
Summary and Conclusion:
The 52,460 level remains the critical zone to watch for bullish momentum. A break and sustain above it could take Bank Nifty to 52,793 or higher. Conversely, failure to hold above 52,199 may lead to testing of lower supports at 51,936 and 51,649. Be cautious and wait for clear confirmation before executing trades. Sideways consolidation may occur if Bank Nifty remains stuck in the range of 52,199–52,460.
Disclaimer:
This analysis is for educational purposes only. I am not a SEBI-registered analyst. All views and levels mentioned here are based on personal technical observations. Please consult your financial advisor and perform your own research before trading or investing.
BANKNIFTY - Levels and Plan for 25-Nov-2024Bank Nifty Trading Plan for 25-Nov-2024
Introduction:
In the previous session, Bank Nifty traded in a trend and meet all the target of the day and close around the 51150 - 51200 zone, with sideways consolidation ( Yellow ) dominating near key levels. The resistance at 51,304 and the support at 50,919 held firm, indicating indecision in the market. Today, the market is likely to remain sensitive to these levels, with breakout trends ( Green for bullish) or breakdown trends ( Red for bearish) shaping intraday opportunities.
Trading Scenarios for 25-Nov-2024:
Gap-Up Opening (200+ points):
If Bank Nifty opens above 51,304 , the key focus will shift to the immediate resistance zone at 51,917 :
A breakout above 51,917 could lead to a strong bullish rally toward 52,100 . Look for sustained price action above this level to confirm the trend.
Failure to sustain above 51,917 may result in a pullback toward 51,304 , providing an opportunity for intraday short trades.
Patience is crucial during the opening minutes to gauge market sentiment.
Flat Opening:
A flat opening near 51,098 will bring the "No Trade Zone" between 51,034 and 51,304 into play:
A bullish breakout above 51,304 could signal further upside toward 51,917 .
Conversely, a breakdown below 51,034 may lead to bearish momentum targeting 50,919 and lower.
Avoid trading within the "No Trade Zone" to minimize false signals. Wait for clear price action confirmation before entering positions.
Gap-Down Opening (200+ points):
If Bank Nifty opens below 50,919 , the next critical support lies at 50,525 :
A breakdown below 50,525 could result in a sharp sell-off, with the next target being 50,100 . Monitor volume and candlestick patterns for confirmation.
A bounce from 50,525 could indicate recovery, with potential upside back to 50,919 and 51,034 .
Be cautious during a gap-down scenario, as volatility can lead to whipsaw movements.
Risk Management Tips for Options Trading:
Trade near-the-money strikes for higher liquidity and better responsiveness to price changes.
Use strict stop-loss levels based on key support and resistance zones to protect capital.
Avoid trading during the "No Trade Zone" to minimize unnecessary losses.
Scale into positions gradually instead of committing the full capital at once, especially in volatile markets.
Summary and Conclusion:
The market's movement today will revolve around the critical zones of 51,304 and 51,034 . Patience and discipline are essential to capitalize on clear breakout or breakdown opportunities. Stick to the plan, avoid overtrading, and respect stop-loss levels for effective risk management.
Disclaimer: I am not a SEBI-registered analyst. The analysis shared is for educational purposes only. Please consult your financial advisor before making any trading decisions.

BANKNIFTY : Trading Levels for 22-Nov-2024Bank Nifty Trading Plan for 22-Nov-2024
Introduction:
In the previous session, Bank Nifty displayed a choppy pattern with limited momentum around the 50,398 level. The price action hinted at indecision with a balanced tug-of-war between bulls and bears. The current levels suggest potential sideways consolidation ( Yellow ) with breakout possibilities ( Green for bullish trends, Red for bearish trends) depending on how Bank Nifty reacts to key zones today.
---
Trading Scenarios for 22-Nov-2024:
Gap-Up Opening (200+ points):
If Bank Nifty opens above 50,727 , the immediate resistance lies at 50,968 . Monitor price action in this range:
- A clear breakout above 50,968 could propel prices to the next resistance at 51,308 . This offers a buying opportunity if the level is sustained for an hourly candle.
- A rejection at 50,968 might lead to a pullback toward 50,727 . Watch for bearish confirmation signals before taking a short position.
Avoid impulsive trades during the initial minutes; let the opening volatility settle.
Flat Opening:
A flat opening near 50,448 would bring the support zone at 50,385 and resistance at 50,727 into play:
- A breakout above 50,727 can lead to a bullish trend targeting 50,968 .
- Conversely, a break below 50,385 may invite bearish momentum toward 50,167 .
Wait for a clear breakout or breakdown before entering trades. Initial movements could remain range-bound.
Gap-Down Opening (200+ points):
If Bank Nifty opens below 50,167 , it will likely test the critical support zone at 49,952 :
- A sustained breakdown below 49,952 could trigger a sharp sell-off toward lower levels, targeting 49,800 or lower.
- On the other hand, if the index bounces back from 49,952 , a recovery to 50,167 or 50,385 is possible.
Watch for strong candlestick patterns at key levels to confirm reversal or continuation before initiating trades.
---
Risk Management Tips for Options Trading:
- Focus on weekly options for lower premiums, but trade near-the-money strikes for better liquidity.
- Use defined stop-losses based on levels and avoid over-leveraging positions.
- Be cautious with aggressive trades during high volatility or news-driven sessions.
- Avoid holding trades beyond the day's range unless strong trends are observed.
---
Summary and Conclusion:
The market's trajectory today hinges on how Bank Nifty reacts to the zones around 50,727 and 50,385 . These levels will act as key decision points for bullish or bearish momentum. Emphasize patience and wait for breakout confirmations to manage risk effectively.
Disclaimer: I am not a SEBI-registered analyst. The analysis shared is for educational purposes only. Please consult your financial advisor before making any trading decisions.

BANKNIFTY : Trading levels and Plan for 21-Nov-2024Bank Nifty Trading Plan for 21-Nov-2024
Intro:
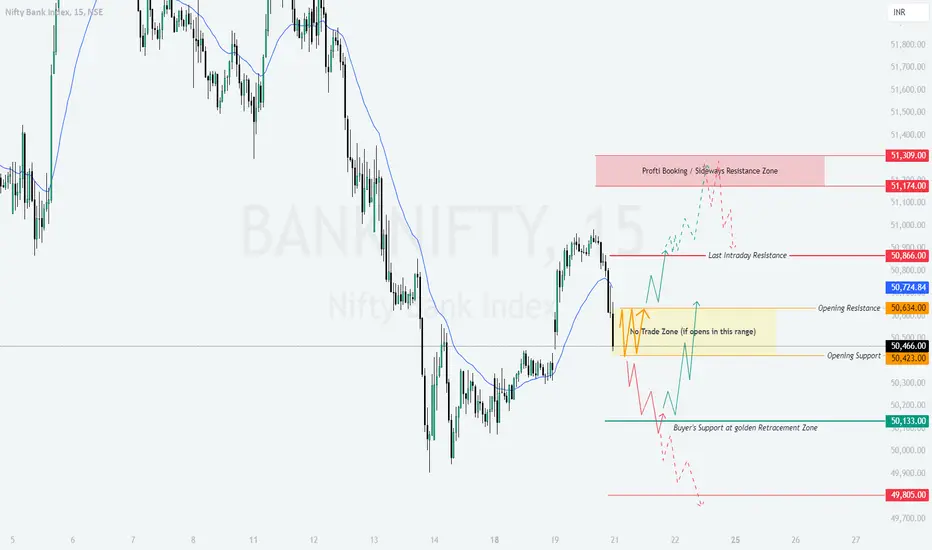
On 20-Nov-2024, Bank Nifty displayed a highly volatile session with price action respecting key levels. The index faced resistance around the 50,866 zone, marking it as the last intraday resistance. The yellow-shaded zone indicated a "No Trade Zone" due to the lack of directional clarity, while buyers found support near 50,133 , aligning with the golden Fibonacci retracement level. The green trend showcased bullish movements, while red trends reflected bearish pullbacks. This sets the stage for varied possibilities for 21-Nov-2024.
Trading Plan for 21-Nov-2024:
Gap Up Opening (200+ points above 50,724):
If Bank Nifty opens above 50,866 , watch for a sustained breakout above 51,174 . This could lead to a bullish continuation towards the Profit Booking Zone (51,309) .
Avoid immediate entry post-gap up; let the index settle for the first 15–30 minutes.
A failure to hold above 50,866 may signal a reversal, with the potential to retrace back to 50,634 .
Flat Opening (Near 50,634):
A flat opening near 50,634 suggests indecision. If prices break above 50,724 with volume, consider a bullish trade targeting 50,866 .
Conversely, if the price breaks below 50,466 , expect bearish momentum targeting 50,133 .
Remain cautious in the yellow-shaded "No Trade Zone." Focus on clear breakout/rejection signals before entering trades.
Gap Down Opening (200+ points below 50,466):
A gap down below 50,466 may lead to further bearish momentum towards the key support at 50,133 .
If 50,133 holds, look for signs of recovery to 50,466 or higher.
A break below 50,133 could trigger a strong bearish trend, targeting 49,805 . Trade with a tight stop-loss if initiating shorts.
Risk Management Tips for Options Traders:
Always define your maximum loss before entering a trade.
For intraday trades, use stop-losses based on the hourly candle close to avoid getting whipsawed by volatility.
Avoid over-leveraging. Stick to 1–2% risk per trade relative to your trading capital.
For gap openings, prefer directional options strategies like debit spreads to manage premium erosion effectively.
Summary and Conclusion:
Bank Nifty's key levels for the day are 50,133 (Buyer’s Support) and 50,866 (Resistance Zone).
Trade cautiously within the "No Trade Zone" ( 50,466 – 50,634 ).
Watch for clear directional moves, as trends are likely to be driven by intraday volatility.
Disclaimer:
I am not a SEBI-registered analyst. This trading plan is for educational purposes only. Traders are advised to conduct their analysis or consult a financial advisor before making any trading decisions.
BANKNIFTY : Trading levels and plan for 19-Nov-2024Intro: Observations from the Previous Day
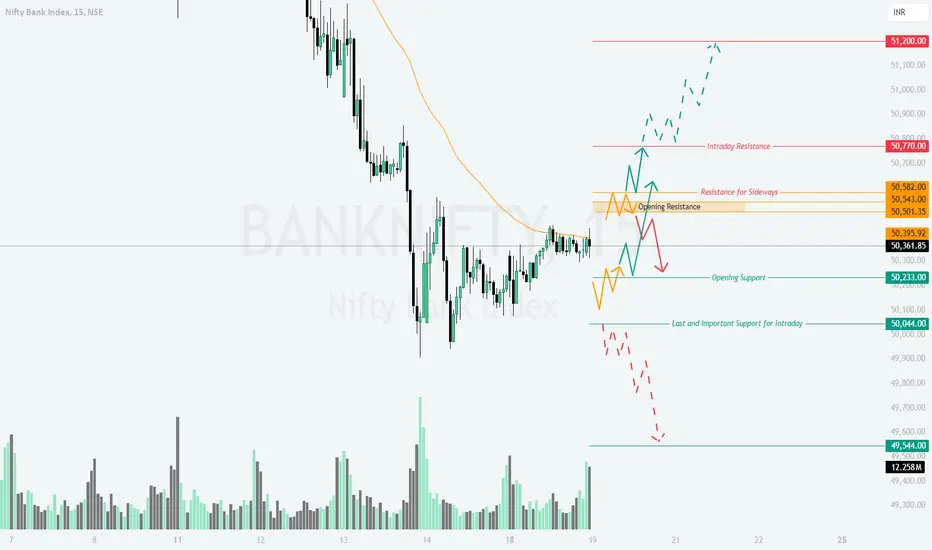
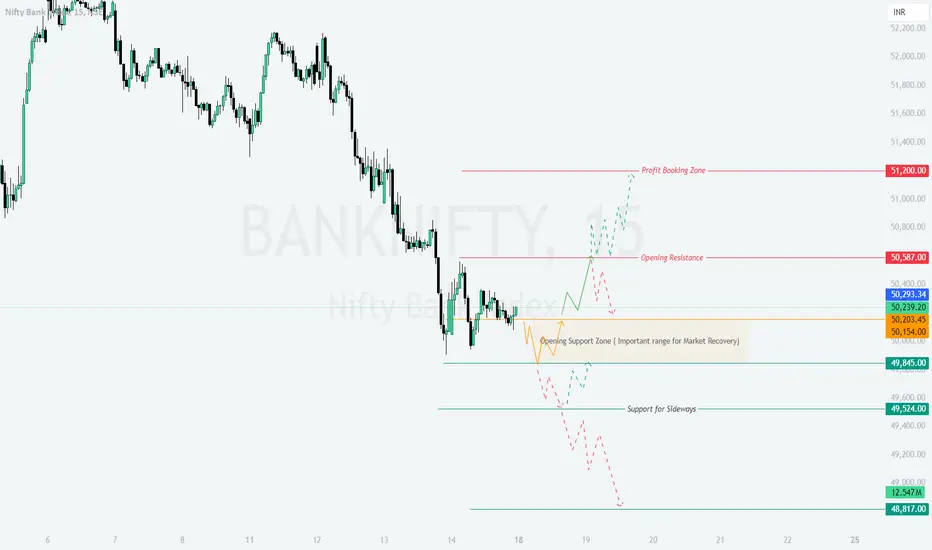
On 18-Nov-2024, Bank Nifty exhibited a consolidation pattern with a sideways trend near the 50,350 zone, as marked by the yellow region. The price respected the Opening Support level while attempting to test the resistance near 50,582, hinting at an indecisive market. This suggests that participants are awaiting a breakout or breakdown for directional clarity.
The chart indicates a possible continuation of this behavior, with Green Trendlines reflecting bullish scenarios and Red Trendlines pointing towards bearish outcomes. The Yellow Zone marks areas of consolidation or sideways movement.
Detailed Trading Plan for 19-Nov-2024
1. Gap Up Opening (200+ Points Above 50,500)
If Bank Nifty opens with a gap up near 50,770:
Scenario 1 (Bullish Continuation): A sustained move above 50,770 with strong volumes could target 51,200, the last intraday resistance. Consider entering long trades above 50,800, with a stop-loss at 50,582.
Scenario 2 (Pullback): Failure to sustain above 50,770 may lead to a pullback towards 50,582, the resistance-turned-support zone. Avoid aggressive longs unless a reversal pattern forms here.
2. Flat Opening (Near 50,395)
If Bank Nifty opens flat:
Scenario 1 (Bullish Move): A breakout above 50,582 with a retest and confirmation can lead to upside momentum toward 50,770. Look for a long entry near 50,600, with a stop-loss below 50,500.
Scenario 2 (Bearish Breakdown): A failure to hold 50,395 could lead to a decline toward 50,233, followed by 50,044. Enter short positions below 50,350, with a stop-loss at 50,450.
3. Gap Down Opening (200+ Points Below 50,233)
If Bank Nifty opens with a gap down near 50,044:
Scenario 1 (Bearish Continuation): Sustained selling pressure could drag the index toward 49,544, a key support zone. Consider shorting below 50,000, with a stop-loss above 50,150.
Scenario 2 (Reversal): A reversal from 50,044 with strong buying signals may push the index back to 50,233 or higher. Look for a long entry only after confirmation.
Risk Management Tips for Options Trading
Position Sizing: Limit exposure to 2-3% of your capital per trade. Avoid overleveraging, especially in volatile conditions.
Stop-Loss Discipline: Always maintain stop-losses, especially in options where time decay and volatility can lead to quick losses.
Avoid Mid-Day Trades: Prices often consolidate during mid-session; prefer trades during opening or toward the closing hours for higher conviction.
Summary & Conclusion
The critical levels to watch on 19-Nov-2024 are:
Resistance Zones: 50,582, 50,770, and 51,200.
Support Zones: 50,233, 50,044, and 49,544.
Bank Nifty is at a crucial juncture where a decisive breakout or breakdown can establish the trend. Trade cautiously and wait for confirmation near these levels before initiating trades.
Disclaimer
I am not a SEBI-registered analyst. The views shared here are based on my personal analysis and are intended for educational purposes only. Please consult with your financial advisor before making any trading decisions.
BANKNIFTY : Trading Levels and Plan for 18-Nov-2024Bank Nifty Trading Plan for 18-Nov-2024
Previous Day Overview:
On 14-Nov-2024, Bank Nifty displayed a cautious trading pattern with a consolidative movement in the support zone, indicating a potential recovery phase. The trend analysis highlights the possible bullish sentiment, yet Bank Nifty is still facing resistance. The yellow area depicts a sideways trend , green represents a bullish trend , and red shows a bearish trend .
---
Opening Scenarios:
Gap Up Opening (200+ points above)
If Bank Nifty opens above 50,587, indicating a strong upward momentum, focus on the 51,200 level as a Profit Booking Zone . Wait for price stability in the first 15-30 minutes; a consolidation around 50,800 could provide a buying opportunity with a target towards the profit booking zone. However, avoid aggressive entry if there’s excessive volatility.
Flat Opening (within ±50 points)
A flat opening near 50,200 could be ideal for assessing early market sentiment. If Bank Nifty sustains above the 50,239 level, there’s potential for a bullish continuation towards 50,587. Monitor any pullbacks to the Opening Support Zone (50,154) as a possible re-entry point for upward movement.
Gap Down Opening (200+ points below)
A gap-down opening near 49,845 may indicate a weaker market sentiment, with 49,524 acting as a critical support level. In this scenario, consider holding off trades in the initial 30 minutes, allowing the market to find stability. If Bank Nifty sustains below 49,845, the trend could shift bearish, with the support zone around 48,817 offering potential support.
---
Risk Management Tips for Options Trading:
- Limit exposure in high volatility environments, especially near significant support and resistance levels.
- Consider using stop-loss levels based on hourly candle closes to avoid sharp fluctuations.
- Position sizing should be conservative if the market opens with a gap, as it may cause rapid swings.
---
Summary & Conclusion :
Today's session may present opportunities if Bank Nifty opens near key support or resistance levels. Patience is essential, with emphasis on watching the 50,154 support and 50,587 resistance for potential breakouts. The overall sentiment appears cautiously bullish, with sideways and bearish patterns also in consideration depending on the market’s opening position.
---
Disclaimer:
I am not a SEBI-registered analyst. This trading plan is shared for educational purposes only, and individuals should conduct their own analysis or consult a financial advisor before making trading decisions.
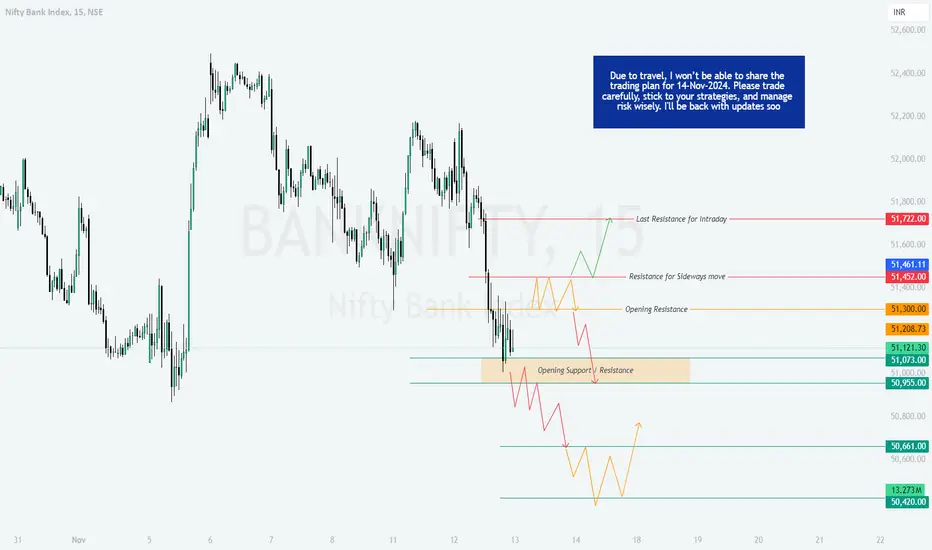
BANKNIFTY : Levels and Plan for 13-Nov-2024
On 12-Nov-2024 , Bank Nifty displayed downtrend movement around the "Opening Support / Resistance" level, with the index facing resistance near 51,300 . This suggests a strong supply zone in this area. Going forward, we will watch for potential breakout or breakdown levels based on key resistance and support zones identified on the chart.
---
Trading Plan for 13-Nov-2024
Gap Up Opening (200+ points):
If Bank Nifty opens with a significant gap up above 51,461 , monitor for initial resistance near 51,722 (Last Resistance for Intraday). Sustained movement above this level could lead to further upside, with potential targets around 52,000 in intraday trading. However, if the index fails to hold above 51,722 , expect a pullback towards 51,300 (Opening Resistance) where bulls might attempt to defend.
Flat Opening:
For a flat opening near 51,121 , watch for initial reactions at 51,300 . If Bank Nifty sustains above this level, it could test the "Resistance for Sideways Move" zone at 51,461 . A breakout above 51,461 could push the index towards 51,722 , whereas failure to sustain above 51,300 may indicate weakness, leading to a retest of the "Opening Support" zone around 51,073 .
Gap Down Opening (200+ points):
A gap down opening below 51,073 would place Bank Nifty in the "Opening Support" zone. If buying interest appears, the index could attempt a recovery towards 51,300 . Failure to sustain above 51,073 could lead to further downside, targeting 50,955 and possibly moving towards the lower support zone around 50,661 (Potential Bottom Support).
---
Risk Management Tips for Options Trading:
- Limit your exposure during high volatility by adjusting position sizes accordingly, particularly near resistance and support zones.
- Use hourly close levels for stop-losses to avoid being whipsawed by intraday fluctuations.
- Avoid trading during unclear or range-bound movements (indicated by Yellow zones) as these areas are more prone to reversals and may impact risk-reward balance.
---
Summary & Conclusion:
For 13-Nov-2024 , the key levels to monitor include 51,722 on the upside for resistance and 50,955 for potential support on the downside. Sideways trends are highlighted in Yellow, bullish areas in Green, and bearish regions in Red. Price action around the "Opening Resistance" and "Opening Support" zones will be crucial in determining the day’s directional bias.
---
Disclaimer: I am not a SEBI-registered analyst. This analysis is based on my personal trading strategy and psychological theory. Please perform your analysis or consult a financial advisor before making any trading decisions.
---
Happy Trading!
BANKNIFTY Bears Bag 550+ Points! Intraday Targets CrushedBANKNIFTY Intraday Short Trade Analysis:
The BANKNIFTY 15m timeframe delivered a stellar short trade setup, hitting all targets and locking in 550+ points profit with impeccable precision. This move stands out as a textbook bearish trade, leveraging strong downward momentum.
Indicators used: Risological Swing Trader and Risological Trading Indicator
Trade Details:
Entry: 51957.20
Stop Loss (SL): 52051.90
Targets:
TP1: 51840.20 ✅
TP2: 51650.85 ✅
TP3: 51461.50 ✅
TP4: 51344.45 ✅
Key Takeaways:
Massive Profit Potential: BANKNIFTY's bearish momentum resulted in a swift 550+ points profit – a dream trade for intraday option traders.
Red-Hot Momentum Indicators : The cascading red candles confirmed the sustained selling pressure, ensuring that all targets were achieved effortlessly.
High Accuracy : Entry aligned perfectly with the resistance from the EMA ribbon, signaling a strong rejection and bearish continuation.
Profit Perspective:
This trade stands as a hallmark of precision and efficiency, showcasing the power of accurate technical analysis in volatile markets like BANKNIFTY. Such trades exemplify how disciplined execution can lead to exceptional intraday gains.
Conclusion:
The BANKNIFTY short trade played out to perfection, reinforcing the value of spotting momentum-driven opportunities. With more than 550+ points secured, this setup remains one of the most lucrative intraday plays of the session!
Namaste!

BANKNIFTY : Levels and Strategies for 12-Nov-2024Intro:
In the previous session, Bank Nifty experienced a range-bound movement, testing key levels. We observed sideways trends (yellow) near 51,733 - 51,812 , while bullish momentum (green) indicated potential breakout levels, and bearish moves (red) highlighted critical support areas. Watching these areas today can provide insights into possible market direction.
Opening Scenarios:
Gap Up Opening (200+ Points Above)
If Bank Nifty opens above the 51,893 level, it will likely face an intraday resistance at 52,316 . A breakout above this resistance could drive the price toward the profit-booking zone at 52,639 - 52,729 . A strong bullish move past 52,729 would indicate sustained buying pressure.
Traders can consider long positions upon a confirmed breakout above 52,316 , with targets at the higher resistance zones. However, if Bank Nifty struggles to maintain above 52,316 , it may signal a pullback toward the 51,893 level.
A cautious approach is recommended, with tight stop-losses for long trades in case of pullbacks.
Flat Opening
In a flat opening scenario around 51,812 , the immediate support and resistance zones to monitor are 51,733 (support) and 51,893 (resistance). Bank Nifty’s movement between these levels could lead to sideways trading (yellow zone).
A sustained breakout above 51,893 could indicate bullish momentum, leading towards the intraday resistance at 52,316 . Conversely, if Bank Nifty breaks below 51,733 , it may revisit lower levels near 51,480 .
Range-bound trades can be executed within this zone with tight stop-losses, especially if it shows sideways consolidation.
Gap Down Opening (200+ Points Below)
A gap down opening below 51,733 places Bank Nifty closer to the Opening Support and Buyer’s Zone at 51,480 . Buyers might show interest here, so a recovery could push the price back to 51,733 - 51,812 .
If the price holds above 51,480 and shows strength, a bounce-back opportunity is likely. However, if Bank Nifty breaks below 51,480 , it may fall toward the “Must Try Zone” at 51,073 - 50,955 , a critical buyer’s support level.
Conservative traders should wait for confirmation of a rebound or a breakdown before making any move in this scenario.
Risk Management Tips for Options Trading:
Follow a strict stop-loss approach based on defined levels ( 51,480 , 51,733 , 52,316 ) to reduce risk exposure.
Avoid over-leveraging and consider using options spreads to manage premium costs in volatile conditions.
Set realistic profit targets and trail stop-losses as the price moves in favor of your trade.
Be cautious around major support/resistance levels to avoid getting caught in potential reversals.
Summary and Conclusion:
Bank Nifty’s key levels for 12-Nov-2024 are 51,733 (opening support), 52,316 (intraday resistance), and 51,480 (critical support zone). Monitoring price reactions around these levels will guide intraday trends. Effective risk management in options trading can help mitigate potential losses in a volatile environment.
Disclaimer:
I am not a SEBI-registered analyst. This trading plan is based on technical patterns and personal insights. Traders are encouraged to conduct their own analysis or seek advice from a certified financial advisor before making any trading decisions.

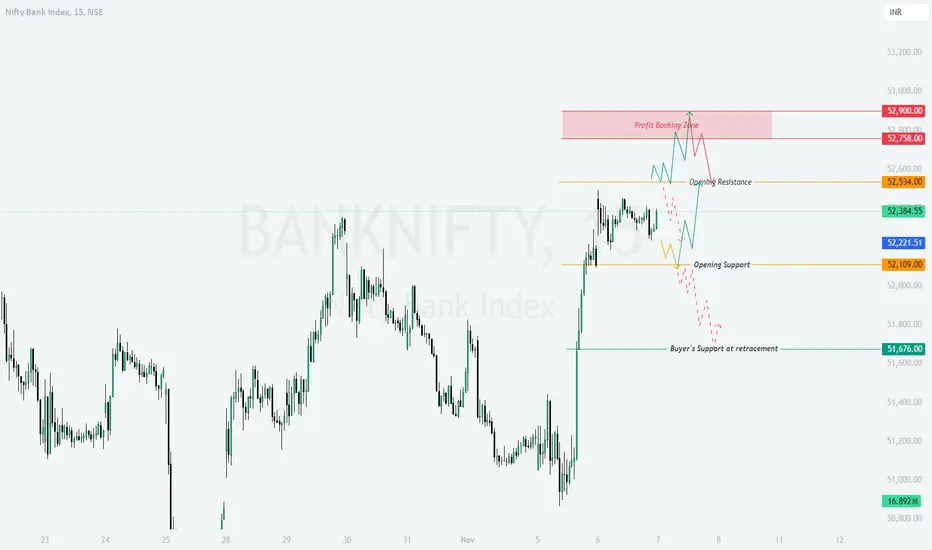
BANKNIFTY : Trading Levels and Plan for 07-Nov-2024Intro:
On the previous trading day, Bank Nifty exhibited a sideways trend in the zone that highlighted in yesterday's day plan and could not break that range, reaching resistance levels but pulling back slightly. The chart shows key zones for profit booking at 52,900 , opening resistance around 52,534 , and opening support at 52,109 . The price action at these levels will determine the trend continuation or possible reversal. Yellow lines indicate a sideways trend, green lines indicate bullish momentum, and red lines highlight potential bearish scenarios.
Opening Scenarios:
Gap Up Opening (200+ Points Above):
If Bank Nifty opens above 52,534 , watch for resistance around the 52,758 - 52,900 profit booking zone. A strong breakout above 52,900 can signal bullish continuation, providing entry opportunities for a quick upside trade with a stop-loss below 52,534 .
However, if the index faces resistance at this level, a pullback may ensue, suggesting a reversal towards the opening support at 52,109 . In this scenario, cautious long trades are advisable, targeting small profits while trailing the stop-loss.
Flat Opening:
If Bank Nifty opens around 52,384 , the opening resistance at 52,534 and support at 52,109 become critical zones. Price behavior around these levels will guide the trend:
A break above 52,534 could lead to a test of the profit booking zone ( 52,758 - 52,900 ).
A rejection at 52,534 can lead to a sideways trend, likely oscillating between 52,534 and 52,109 . Consider quick scalping trades with limited risk here.
If the price moves below 52,109 , expect a potential downward move, aiming for the buyer's support at 51,676 .
Gap Down Opening (200+ Points Below):
In the event of a gap-down opening near or below 52,109 , Bank Nifty may seek support at 51,676 . Observe if it finds stability here to confirm a buying opportunity for a potential rebound.
If 51,676 fails to hold, Bank Nifty may trend lower, with bearish momentum potentially extending to the lower support zone.
Conversely, a recovery above 52,109 could lead to a pullback rally towards 52,534 , presenting a quick rebound trade opportunity.
Risk Management Tips for Options Trading:
Use defined stop-losses based on support/resistance levels ( 52,534 , 52,109 , 51,676 ) to manage risk.
Avoid overleveraging, particularly during high volatility zones.
Consider deploying options strategies (e.g., spreads) to reduce premium costs and manage risk exposure.
Trail stop-losses as the price moves favorably to lock in profits.
Summary and Conclusion:
The key levels for Bank Nifty on 07-Nov-2024 are 52,534 (opening resistance), 52,109 (opening support), and 51,676 (buyer’s support). Monitor these zones for potential reversals or breakouts. Follow risk management guidelines strictly, particularly in options trading, to safeguard against adverse moves.
Disclaimer:
I am not a SEBI-registered analyst. The analysis and trading levels shared are based on technical patterns and personal views. Traders are advised to perform their due diligence or consult with a financial advisor before taking any trading action.
BANKNIFTY Breaks Out! TP1 Achieved—Higher Targets in SightBANKNIFTY Technical Analysis:
BankNifty has demonstrated strong bullish momentum on the 15-minute timeframe, successfully hitting Target 1 (TP1) at ₹52,057.50. The price action suggests a continuation towards the remaining targets, supported by key technical indicators.
BANKNIFTY Trade Summary:
Entry Point: ₹51,733.25
Stop Loss (SL): ₹51,555.40
Targets:
TP1: ₹52,057.50 ✅ Achieved
TP2: ₹52,479.00
TP3: ₹52,900.50
TP4: ₹53,224.75
Key Observations:
Bullish Momentum: The index has broken above significant resistance levels, indicating strong buying pressure.
Risological Dotted Trendline : Price is maintaining above the Risological Dotted Trendline, confirming the upward trend.
Increased Volume: There's a noticeable rise in trading volume, adding confidence to the bullish move.
Market Context:
The positive movement in BankNifty aligns with optimistic market sentiments in the banking sector. Contributing factors may include favorable economic data, strong earnings reports from major banks, or broader market rallies.
Outlook:
With TP1 successfully reached, the focus shifts to the next targets:
TP2 at ₹52,479.00: A break above this level could accelerate bullish momentum.
TP3 and TP4: Achieving these targets would signify a robust uptrend and potential new highs.
Recommendations:
Monitor Price Action: Keep an eye on how the price behaves around TP2. A strong close above this level with sustained volume could indicate a move towards TP3 and TP4.
Risk Management : Maintain the stop loss at ₹51,555.40 to protect against unexpected market reversals.
Stay Informed: Watch for any news or events that could impact the banking sector or overall market sentiment.
Conclusion:
BankNifty's strong breakout and the achievement of TP1 signal a promising opportunity for traders. The alignment of the technical indicator Risological Swing Trader with positive market sentiment increases the likelihood of reaching the remaining targets. As always, prudent risk management and staying updated with market developments are essential for capitalizing on this trade setup.

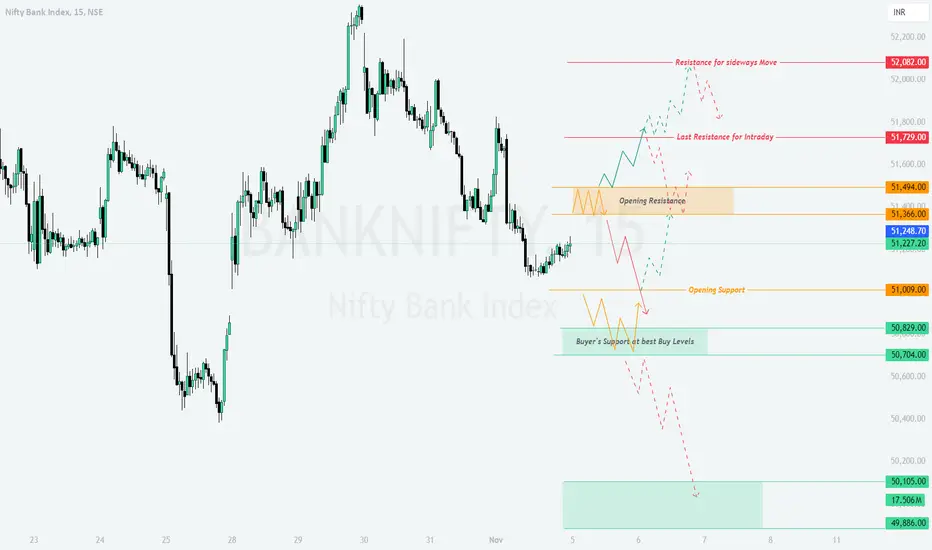
BANKNIFTY : Trading Levels and Plan for 05-Nov-2024On 04-Nov-2024, Bank Nifty showed a bearish action with the first tick of opening, closing near **51,227** with noticeable volatility. The chart reflects clear support near **50,829** and **50,704**, while resistance zones are seen at **51,494** and **51,729**. The **Yellow trend** represents a sideways market, the **Green trend** signals bullish momentum, and the **Red trend** indicates bearish moves.
Trading Plan for 05-Nov-2024:
Gap Up Opening (200+ points):
If Bank Nifty opens with a gap-up above **51,494**, the index will likely face intraday resistance at **51,729**. A breakout above this level can push Bank Nifty towards **52,082**, the next key resistance level, which might induce sideways movement.
However, failure to sustain above **51,729** could result in a pullback towards **51,494** or even a retest of **51,366**, the opening support/resistance level.
Actionable Plan:
- **Buy** on a sustained move above **51,729** with a target of **52,082**.
- **Stop Loss:** Below **51,494** on a 15-minute candle close.
Flat Opening:
If Bank Nifty opens flat near **51,227**, the focus will be on price action around the **51,366** level. A breakout above **51,494** could initiate bullish momentum, while a failure to break this resistance will result in a sideways trend (Yellow trend) with a potential retest of **51,009** (opening support).
In case Bank Nifty breaks **51,009**, expect a bearish move towards **50,829** and **50,704**.
Actionable Plan:
- **Buy** on a breakout above **51,366**, targeting **51,494**.
- **Sell** below **51,009**, with a target of **50,829**.
- **Stop Loss:** Place a stop loss near **51,227** for both buy and sell strategies.
Gap Down Opening (200+ points):
If Bank Nifty opens with a gap-down around **50,829** or below, the focus shifts to the **Buyer’s Support Zone** around **50,704**. A strong recovery from this zone could lead to a bounce back towards **51,009** or even higher.
However, if the index fails to hold **50,704**, expect further downside pressure, with the next major support at **50,105**. Keep in mind that aggressive selling could lead to a bearish continuation (Red trend).
Actionable Plan:
- **Buy** near **50,704**, with a target of **51,009**.
- **Sell** below **50,704**, aiming for **50,105**.
- **Stop Loss:** Below **50,704** on a 15-minute candle close.
Risk Management Tips for Options Trading:
- Consider using spreads to limit risk while taking advantage of directional moves.
- Keep positions light during volatile openings and focus on defined support/resistance levels.
- Avoid holding short-term options over the weekend unless there’s a clear directional bias.
Summary and Conclusion:
Key levels to watch for 05-Nov-2024 include **51,494** as intraday resistance and **50,704** as strong support. A gap-up or flat opening presents potential opportunities for bullish trades above **51,366**, while a gap-down opening could provide buy opportunities near **50,704**. As always, respect support/resistance zones and wait for confirmation before entering positions.
Disclaimer: I am not a SEBI-registered analyst. This trading plan is based on technical analysis and should not be considered financial advice. Please consult with your financial advisor before making any trading decisions.
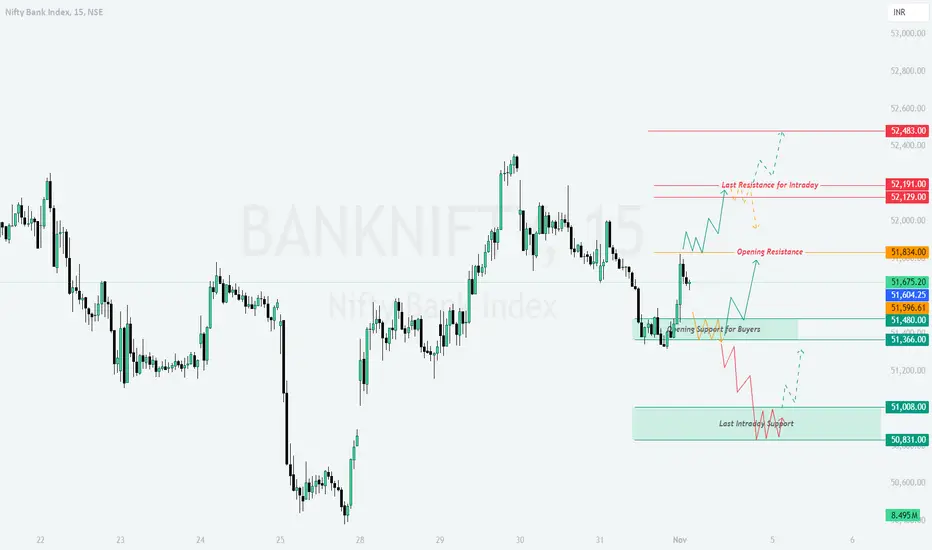
BANKNIFTY : Trading Levels and Plan for 04-Nov-2024Intro for Previous Day's Chart Pattern:
In the last two trading session, Bank Nifty displayed a mixed trend with a bounce off the support levels, suggesting buying interest from lower zones. Key resistance levels emerged near the higher range, where sellers maintained pressure. As per the chart, Yellow indicates a potential Sideways trend, Green shows a Bullish trend, and Red highlights a Bearish trend.
---
Trading Plan for 04-Nov-2024:
Opening Scenarios:
Gap Up Opening (200+ points):
If Bank Nifty opens with a significant gap up around 52,191 or higher:
- Watch for resistance near 52,191 (marked as “Last Resistance for Intraday”). A strong breakout above this level may provide momentum for further upside.
- If the price holds above 52,129, consider initiating long positions, but be cautious of quick pullbacks near 52,483, the higher resistance zone.
- If resistance holds, wait for confirmation before shorting, as the price may consolidate or pull back slightly to retest lower support levels.
Flat Opening:
If Bank Nifty opens flat around 51,675:
- Focus on the immediate resistance level of 51,834. A decisive break above this level can push prices toward the 52,000+ range.
- If prices struggle to breach 51,834, consider waiting for a dip towards 51,480, which is the “Opening Support for Buyers,” to enter long positions.
- For intraday shorts, wait for bearish confirmation near 51,834 before targeting lower levels, particularly if the price heads toward the 51,366 support area.
Gap Down Opening (200+ points):
If Bank Nifty opens with a gap down near 51,366 or lower:
- Observe the support zone around 51,366 and 51,008. If the price stabilizes in this range, it could be a good entry for long trades with a target towards 51,604.
- If 51,008 (Last Intraday Support) is breached, further downside could follow, potentially dragging the index down to the 50,831 level.
- Look for confirmation of strength or weakness before entering positions, as gap-down openings may lead to volatile price action.
---
Risk Management Tips for Options Trading:
- Use tight stop-losses in the volatile market conditions post-Diwali to avoid sharp losses.
- Avoid over-leveraging. Consider position sizing that aligns with your risk tolerance, especially near key support and resistance levels.
- Monitor option premiums closely, as high volatility can lead to rapid premium decay.
- In case of significant volatility, consider exiting options positions early to preserve gains or limit losses.
---
Summary and Conclusion:
The 04-Nov-2024 session holds potential for a continuation of recent trends, with key resistance and support levels in focus. Look for clear breakouts above resistance or signs of support holding to confirm directional bias. Sideways movement within key zones may indicate consolidation, while breaks beyond these zones may drive a more directional move.
Disclaimer: I am not a SEBI-registered analyst. This trading plan is shared for educational purposes. Please conduct your analysis or consult a financial advisor before making any trading decisions.
BANKNIFTY : Trading Levels and Plan for 29-10-2024
Intro:
On the previous day, Bank Nifty showed a mixture of consolidation and upward movement and resistance at higher level from and to recommended levels , suggesting potential momentum above certain levels. The chart highlights yellow zones as areas likely to see sideways movement, green zones as potential bullish areas, and red zones for bearish momentum. Today, we’ll explore trading strategies for different opening scenarios.
Trading Plan for 29-Oct-2024
Gap Up Opening (200+ points above)
If Bank Nifty opens with a 200+ points gap up, it is likely to encounter resistance around the 51,478 level, marked as the Last Resistance for Intraday . If prices sustain above this level, we may see an upward movement towards the Profit Booking Zone / Sideways Zone between 51,955 - 52,160 . However, if it fails to break this resistance, expect potential retracement towards the Opening Support at 51,080 .
– If selling pressure builds, Bank Nifty may pull back further to retest 50,985 as an additional support level.
Flat Opening (within 100 points of the previous close)
With a flat opening, monitor the first 30 minutes for price action clarity. If Bank Nifty trades above 51,478 after initial consolidation, it could signal a bullish push toward 51,955 . A breakout above this resistance might lead the price to test the upper bounds near 52,160 . Conversely, if it struggles to hold above 51,478 , a sideways or slight bearish trend might develop towards 51,080 .
– Any dip below 51,080 may attract additional selling pressure, possibly pushing prices towards the Pending Buyer’s Order Zone around 50,638 .
Gap Down Opening (200+ points below)
In a gap-down scenario, focus on 50,985 as a crucial support level. If Bank Nifty maintains this level, it might attempt to rebound towards 51,478 . A successful move above 51,478 could bring sideways to bullish action up to 51,955 . If, however, the index breaks below 50,985 , expect it to test the Pending Buyer’s Order Zone at 50,638 , a key level for potential trend reversals.
– Failure to hold at 50,638 may lead to further bearish momentum.
Risk Management Tips for Options Trading
Set defined stop-loss levels for each trade based on market volatility; hourly candle closes can serve as an effective risk management tool.
Avoid over-allocating capital in options trading. Use smaller position sizes to manage potential market swings.
Consider trailing stops to protect profits if Bank Nifty moves favorably in your direction, especially during periods of heightened volatility.
Summary and Conclusion
Today, the primary levels to watch are 51,478 as the last intraday resistance and 50,985 as key support. A break beyond these levels could determine the market's directional bias. Adopting a flexible strategy and monitoring early price action can provide valuable insights for effective entries.
Disclaimer:
I am not a SEBI-registered analyst. This analysis represents my personal view and is based on technical levels. Please do your research or consult a financial advisor before making any trading decisions.

BANKNIFTY Lon Trade Setup on 15m Timeframe.Fresh long trade on BANKNIFTY.
Not at office today, so updating this trade from my phone.

BankNifty Crashes Through All Targets – Bears in Control!BankNifty 15m Timeframe Technical Analysis:
On the 15-minute timeframe, BankNifty has completed a spectacular short trade, smashing through all targets with strong bearish momentum. Price plunged well below the Risological dotted trendline, confirming the continued downtrend.
Key Levels:
Entry: 51,620.00
Stop Loss (SL): 51,700.75
Target 1 (TP1): 51,520.15 (Done)
Target 2 (TP2): 51,358.60 (Done)
Target 3 (TP3): 51,197.05 (Done)
Target 4 (TP4): 51,097.20 (Done)
Observations:
A sharp decline occurred right after entry, and price respected the Risological dotted trendline as resistance throughout the trade.
Bears dominated the session, pushing the price lower without retracing back to the trendline.
BankNifty's steep descent through all target levels underscores the market's bearish sentiment. With all targets achieved, traders may look for further downside potential or await signs of reversal.

BANKNIFTY Short Entry – BIG Targets Await!We’ve entered a short trade on BANKNIFTY based on a clear bearish signal at 51733.25. The setup looks strong, and we're now awaiting the targets to hit.
Key Levels
Entry: 51733.25 – Initiated as bearish momentum took hold.
Stop-Loss (SL): 52155.40 – Positioned above the entry to manage risk.
Take Profit 1 (TP1): 51211.50 – First target expected to be reached soon.
Take Profit 2 (TP2): 50367.25 – Next key level to watch.
Take Profit 3 (TP3): 49523.00 – Anticipating continued selling pressure to hit this target.
Take Profit 4 (TP4): 49001.25 – The ultimate target in this short trade.
Trend Analysis
The price is moving decisively below the Risological Dotted Trendline, confirming a strong downtrend. All indicators suggest that the targets are within reach as selling pressure builds.
This is going to be a high profit trade if it works out as per the chart. But, let's be ready for rude surprises and have the trailing stop at 51,748 in worst case scenario.
