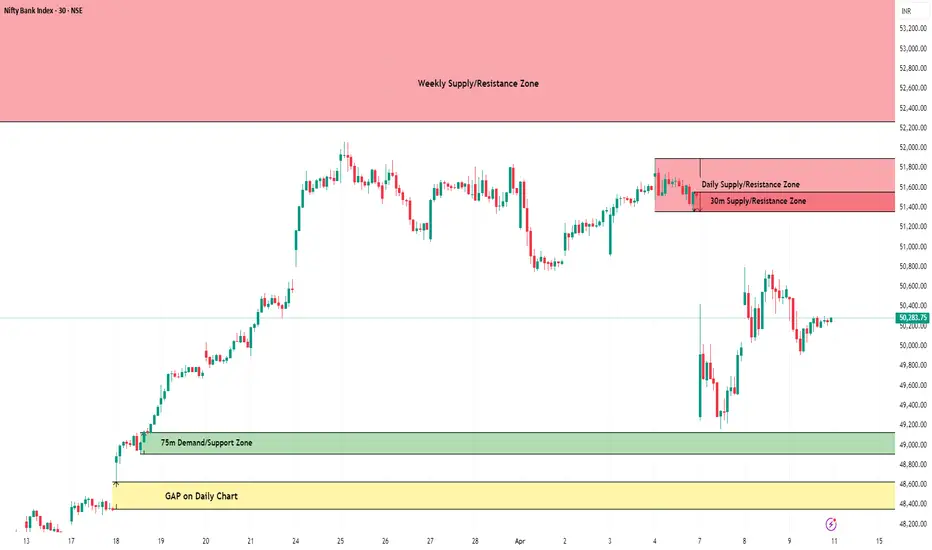
BankNifty Intraday Support & Resistance Levels for 11.04.2025🔄 Quick Recap since the last update (21.03.2025):
BankNifty rallied to a high of 52,063.95 on 25th March, piercing through the earlier mentioned Weekly Supply Zone by 84 points. But the bullish momentum was short-lived. Following Trump’s tariff announcement, BankNifty plunged sharply, dropping over 2,800 points to hit a low of 49,156.95 on 7th April.
🌍 Global sentiment has been shaken, but signs of recovery are emerging. Dow Futures have rebounded 4,000 points (10%), currently trading around 40,700 — a hopeful sign, but volatility remains elevated.
📅 On Wednesday (09.04.2025):
BankNifty opened with a gap-down, hit high of 50,496.90, and made a low at 49,910.85 before settling at 50,240.15, down 271 points for the day.
🔹 Trend Analysis:
Weekly Trend (50 SMA): Sideways
Daily Trend (50 SMA): Sideways
📉 Demand/Support Zones
Near Demand/Support (75m): 49,215.95 – 49,698.05
Gap Support (Daily Chart): 48,354.15 – 48,629.45
Far Support: 47,700 – 47,850 (multiple time tested on Daily Chart)
Major Support: 46,077.85 (Low of 4th June 2024)
Far Demand/Support (Daily): 44,633.85 – 45,750.40
📈 Supply/Resistance Zones
Near Supply (30m): 51,360.40 – 51,559.20 (Inside Daily Supply)
Near Supply (Daily): 51,360.40 – 51,893.60
Far Supply (Weekly): 52,264.55 – 53,775.10
🔍 Outlook:
With both trends turning sideways, BankNifty remains in a consolidation phase. Bulls are currently trapped under a strong resistance zone starting from 51,360, while downside support begins near 49,200.
Considering the volatile global setup, we may see a range-bound move with sharp intraday swings. The index must cross 51,900 decisively for any further upside. Until then, sell-on-rise near supply and buy-on-dip at demand continues to be the approach. Stay cautious. Trade levels, not emotions.
📢 Disclaimer: This analysis is intended for educational purposes only. It is not investment advice. Please consult your financial advisor before making any trading decisions.
Bankniftysupportresistance
BankNifty Intraday Support & Resistance Levels for 21.03.2025🔎 Market Recap:
On Thursday, BankNifty opened gap-up, dipped to a low of 49,771.65, and then rallied to a high of 50,155.30, penetrating deep into the Daily Supply Zone (49,703.10 - 50,641.75). It closed at 50,062.85, gaining 360 points over the previous close.
📉 Trend Analysis:
Weekly Trend (50 SMA): Turned sideways from negative, but confirmation depends on Friday’s close.
Daily Trend (50 SMA): Sideways.
📉 Demand/Support Zones
Near Demand/Support (15m): 49,394.40 - 49,546.60
Near Demand/Support (15m): 49,249.15 - 49,309.55
Far Demand/Support (75m): 48,908.20 - 49,125.55
Far Demand/Support (125m): 48,288.30 - 48,481.35
Far Support: Around 47,850 (Multiple Daily Chart supports)
Far Support: 46,077.85 (Low of 4th June 2024)
Far Demand/Support (Daily): 44,633.85 - 45,750.40
📈 Supply/Resistance Zones
Near Supply/Resistance (Daily): 49,703.10 - 50,641.75 (Currently trading inside)
Far Supply/Resistance (Weekly): 50,485.05 - 51,979.75 (Tested once)
Far Supply/Resistance (Weekly): 52,264.55 - 53,775.10
💡 Outlook:
BankNifty is now inside a major Daily Supply Zone, making this a key resistance area to watch. If price sustains above 50,641, we could see a continuation toward the Weekly Supply Zone at 51,979. However, failure to break this zone could trigger a retracement toward 49,400 - 49,250.
📢 Disclaimer:
This analysis is for educational and informational purposes only and should not be considered as financial advice. Trading and investing in the stock market involve risk, and past performance does not guarantee future results. Always conduct your own research and consult with a certified financial advisor before making any trading decisions. The author is not responsible for any financial losses incurred based on this analysis.

BankNifty Intraday Support & Resistance Levels for 20.03.2025Market Recap:
On Wednesday, BankNifty opened gap-up, dipped to a low of 49,324.80, and then rallied to a high of 49,807.55, entering both the 75m & Daily Supply Zones. It closed flat at 49,702.60, gaining 388 points from the previous close. The Weekly Trend (50 SMA) remains negative, while the Daily Trend (50 SMA) has turned sideways from negative.
Demand/Support Zones
Near Demand/Support Zone (15m): 49,249.15 - 49,309.55
Near Demand/Support Zone (75m): 48,908.20 - 49,121.05
Near Support: Around 47,850 (Multiple supports on the Daily Chart)
Far Support: 46,077.85 (Low of 4th June 2024)
Far Demand/Support Zone (Daily): 44,633.85 - 45,750.40
Supply/Resistance Zones
Near Supply/Resistance Zone (75m): 49,665.95 - 49,829.40 (Tested)
Near Supply/Resistance Zone (Daily): 49,703.10 - 50,641.75 (Tested)
Far Supply/Resistance Zone (Weekly): 50,485.05 - 51,979.75 (Tested)
Outlook
As highlighted in the previous post, BankNifty showed strong bullish momentum and even surpassed the 49,500 mark, as anticipated. However, the short-term trend is now in the overbought zone.
🚨 With multiple supply zones nearby and BankNifty testing the 75m & Daily Supply Zones today, a pullback or correction is possible. Caution is advised when going long at these levels.
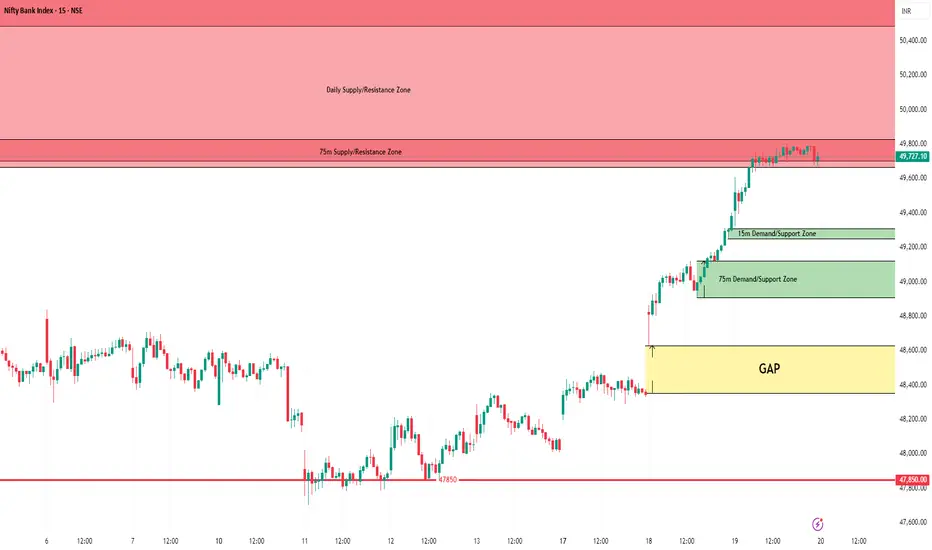
BankNifty Intraday Support & Resistance Levels for 17.03.2025Thursday’s session saw BankNifty opening with a gap-up, hitting a high of 48,352.45, but failing to sustain, dropping to a low of 48,006.10 by the end of the day. It closed flat at 48,060.40, gaining just 3.75 points from the previous close. Both the Weekly and Daily Trends (50 SMA) remain negative.
Demand/Support Zones
Near Support: Around 47,850 (Multiple supports on the Daily Chart)
Far Support: 46,077.85 (Low of 4th June 2024)
Far Demand/Support Zone (Daily): 44,633.85 - 45,750.40
Supply/Resistance Zones
Near Minor Supply/Resistance Zone (15m): 48,445.25 - 48,530.55
Near Supply/Resistance Zone (125m): 48,743.80 - 48,911.90 (Tested)
Near Supply/Resistance Zone (Daily): 48,764 - 49,455.80 (Tested multiple times)
Far Supply/Resistance Zone (75m): 49,665.95 - 49,829.40
Far Supply/Resistance Zone (Weekly): 50,485.05 - 51,979.75 (Tested)
Outlook
On 11th March, BankNifty broke the multiple-time-tested support at 47,850, making a new low of 47,702.90 and closing below 48,000. However, on 12th & 13th March, it managed to reclaim 48,000 (a key psychological level).
If 48,000 holds, we might see bullish momentum in the coming sessions, with potential upside towards 48,400 - 48,750, and even 49,500 if momentum sustains. However, multiple resistance zones above may keep price movements in check.

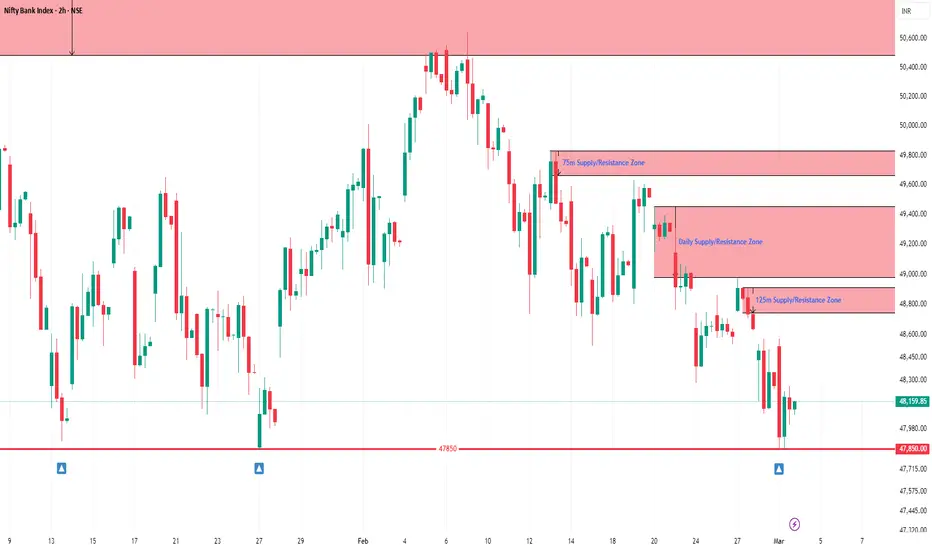
BankNifty Intraday Support & Resistance Levels for 04.03.2025Monday’s session saw BankNifty opening with a gap-up, hitting a high of 48,574.70, but it couldn’t hold and dropped to a low of 47,841.30. However, it recovered slightly and closed at 48,114.30, losing 230 points from the previous close. Both the Weekly Trend (50 SMA) and Daily Trend (50 SMA) remain negative.
Demand/Support Zones
Near Support: Around 47,850 (Triple Bottom on Daily Chart)
Far Support: 46,077.85 (Low of 4th June 2024)
Far Demand/Support Zone (Daily): 44,633.85 - 45,750.40
Supply/Resistance Zones
Near Supply/Resistance Zone (125m): 48,743.80 - 48,911.90
Near Supply/Resistance Zone (Daily): 48,981.20 - 49,455.80
Far Supply/Resistance Zone (75m): 49,665.95 - 49,829.40
Far Supply/Resistance Zone (Weekly): 50,485.05 - 51,979.75 (Tested)
Outlook
BankNifty has dropped 6,626 points (12%) in the last 5 months from its All-Time High of 54,467.35. Today’s low of 47,841.30 is very close to the previous lows on 13th Jan 2025 (47,898.35) and 27th Jan 2025 (47,844.15), forming a potential Triple Bottom around 47,850. The index closed above 48,000, which could indicate a short-term bounce if the support holds. However, multiple supply zones above suggest strong selling pressure at higher levels. Any upside move may face resistance, making a Sell-on-Rise strategy more favorable until a breakout is confirmed.
BankNifty Intraday Support & Resistance Levels for 25.02.2025Monday’s session started with a gap-down of 350 points at 48,628.80. Made day low of 48,281.90, entered the 125m Demand Zone (47,981.35 - 48,319.20), where it found support and rebounded to day high of 48,748.40. It closed at 48,651.95, losing 329 points from the previous close. The Weekly Trend (50 SMA) remains negative, while the Daily Trend (50 SMA) stays sideways.
Demand/Support Zones
Near Demand/Support Zone (125m): 47,981.35 - 48,319.20 (tested)
Far Support: 46,077.85 (Low of 4th June 2024)
Far Demand/Support Zone (Daily): 44,633.85 - 45,750.40
Supply/Resistance Zones
Near Supply/Resistance Zone (15m): 48,959.15 - 49,058.15
Far Supply/Resistance Zone (30m): 49,288.95 - 49,396.65
Far Supply/Resistance Zone (75m): 49,665.95 - 49,829.40
Far Supply/Resistance Zone (Daily): 49,703.10 - 50,641.75
Outlook
BankNifty respected 125m Demand Zone and bounced back but the gap wasn't filled. The 48,900 - 49,000 region will be crucial for further upside momentum. However, with multiple resistance levels ahead and a weak broader trend, a Sell-on-Rise approach remains favorable unless a decisive breakout is seen above 50650.

BankNifty Intraday Support & Resistance Levels for 20.02.2025Wednesday’s session saw BankNifty opening gap-down, hitting a low of 48,804 before staging a strong rally to 49,509.75. It later dipped to 49,281, but rebounded again to close at 49,570.10, gaining 483 points over the previous close. The Weekly Trend (50 SMA) remains negative, while the Daily Trend (50 SMA) is sideways, signaling mixed sentiment.
Demand/Support Zones
Near Demand/Support Zone (5m): 49,365.45 - 49,404.55
Near Demand/Support Zone (5m): 48,928.10 - 49,038.45
Far Demand/Support Zone (125m): 47,981.35 - 48,319.20
Far Support Level: 46,077.85 (Low of 4th June 2024)
Far Demand/Support Zone (Daily): 44,633.85 - 45,750.40
Supply/Resistance Zones
Near Supply/Resistance Zone (75m): 49,665.95 - 49,829.40
Far Supply/Resistance Zone (15m): 49,949.75 - 50,049.10
Far Supply/Resistance Zone (30m): 50,146.10 - 50,248.35
Far Supply/Resistance Zone (Weekly): 50,485.05 - 51,979.75 (Tested)
Far Supply/Resistance Zone (Weekly): 52,264.55 - 53,775.10
Outlook
BankNifty is showing strength, holding above key support levels. If it sustains current levels, we may see the rally extend towards 50,000. However, multiple supply zones above 49,800 could create resistance. A breakout above 50,050 may lead to further upside momentum!
Disclaimer:
"This content is for educational purposes only and reflects personal opinions. It is not investment advice or a recommendation to buy/sell any securities. I am not a SEBI-registered advisor. Please consult a qualified financial professional before making any investment decisions."

BankNifty Intraday Support & Resistance Levels for 17.02.2025Friday’s session saw BankNifty opening positive, but it failed to hold gains. After touching a high of 49,592.95, it witnessed a sharp decline to 48,719.75 before recovering slightly. It finally closed at 49,099.45, losing 260 points from the previous close. The Weekly Trend (50 SMA) remains negative, while the Daily Trend (50 SMA) is sideways, indicating uncertainty in direction.
Demand/Support Zones
Near Demand/Support Zone (125m): 47,981.35 - 48,319.20
Far Support Level: 46,077.85 (Low of 4th June 2024)
Far Demand/Support Zone (Daily): 44,633.85 - 45,750.40
Supply/Resistance Zones
Near Supply/Resistance Zone (75m): 49,276.10 - 49,592.95
Near Supply/Resistance Zone (30m): 49,665.95 - 49,743.15
Far Supply/Resistance Zone (30m): 50,146.10 - 50,248.35
Far Supply/Resistance Zone (Weekly): 50,485.05 - 51,979.75 (Tested)
Far Supply/Resistance Zone (Weekly): 52,264.55 - 53,775.10
Outlook
BankNifty’s failure to sustain gains suggests that sellers remain dominant at higher levels. A break below 48,700 could lead to further weakness toward 48,320 - 47,980 or even 46,000, while a move above 49,750 may bring 50,250 - 51,000 into play.

BankNifty Intraday Support & Resistance Levels for 12.02.2025Tuesday’s session saw BankNifty opening negative, making a high of 49,949.75 before experiencing a sharp decline to 49,177.40, entering the 125m Demand Zone (48,906.05 - 49,373.45). It closed at 49,403.40, losing 577 points from the previous close. The Weekly Trend (50 SMA) remains Negative, while the Daily Trend (50 SMA) stays sideways, indicating ongoing market uncertainty.
Demand/Support Zones
Near Demand/Support Zone (125m): 48,906.05 - 49,373.45 (Tested)
Far Demand/Support Zone (15m): 48,511.70 - 48,627.95
Far Demand/Support Zone (125m): 47,981.35 - 48,319.20
Far Support Level: 46,077.85 (Low of 4th June 2024)
Far Demand/Support Zone (Daily): 44,633.85 - 45,750.40
Supply/Resistance Zones
Near Supply/Resistance Zone (15m): 49,949.75 - 50,049.10
Near Supply/Resistance Zone (30m): 50,146.10 - 50,248.35
Far Supply/Resistance Zone (15m): 50,308.70 - 50,462.35
Far Supply/Resistance Zone (Weekly): 50,485.05 - 51,979.75 (Tested)
Far Supply/Resistance Zone (75m): 50,904.35 - 51,088.90 (Inside the Weekly Supply Zone)
Outlook
BankNifty’s close near 49,400 within the tested demand zone suggests that buyers are attempting to hold this level. A break below 48,900 could invite further downside towards 48,500 - 48,300. On the upside, 49,950 - 50,050 remains the immediate resistance, with a breakout above 50,250 needed for bullish momentum.

BankNifty Intraday Support & Resistance Levels for 11.02.2025Monday’s session saw BankNifty opening negative, making an initial high of 50,155.65 before slipping to a day low of 49,703.10. Despite a minor recovery, it closed at 49,981, losing 178 points from the previous close. The Weekly Trend (50 SMA) remains negative, while the Daily Trend (50 SMA) stays sideways, indicating market uncertainty.
Demand/Support Zones
Near Demand/Support Zone (125m): 48,906.05 - 49,373.45
Far Demand/Support Zone (15m): 48,511.70 - 48,627.95
Far Demand/Support Zone (125m): 47,981.35 - 48,319.20
Far Support Level: 46,077.85 (Low of 4th June 2024)
Far Demand/Support Zone (Daily): 44,633.85 - 45,750.40
Supply/Resistance Zones
Near Supply/Resistance Zone (15m): 50,308.70 - 50,462.35
Far Supply/Resistance Zone (Weekly): 50,485.05 - 51,979.75 (Tested)
Far Supply/Resistance Zone (75m): 50,904.35 - 51,088.90 (Inside the Weekly Supply Zone)
Outlook
BankNifty is struggling to maintain key support levels, with 49,700 acting as an important support today. A break below this level could push prices towards 49,40000 - 48,900. On the upside, 50,300 - 50,500 remains a strong resistance zone. A sustained breakout above 50,500 could trigger further upside, while failing to hold above 49,700 may bring increased selling pressure.

BankNifty Intraday Support & Resistance Levels for 10.02.2025Friday’s session was highly volatile, with BankNifty opening positive and hitting a high of 50,641.75 before a sharp drop to 50,042.30. It rallied again to 50,462.35, but selling pressure pushed it to a day low of 49,871.15, entering the 15-minute Demand Zone. A slight recovery followed, and BankNifty closed at 50,158.85, losing 223 points over the previous close. The Weekly Trend (50 SMA) remains Negative, while the Daily Trend (50 SMA) is sideways.
Demand/Support Zones
Near Demand/Support Zone (125m): 48,906.05 - 49,373.45
Far Demand/Support Zone (15m): 48,511.70 - 48,627.95
Far Demand/Support Zone (125m): 47,981.35 - 48,319.20
Far Support Level: 46,077.85 (Low of 4th June 2024)
Far Demand/Support Zone (Daily): 44,633.85 - 45,750.40
Supply/Resistance Zones
Near Supply/Resistance Zone (15m): 50,308.70 - 50,462.35
Far Supply/Resistance Zone (Weekly): 50,485.05 - 51,979.75 (Tested)
Far Supply/Resistance Zone (75m): 50,904.35 - 51,088.90 (Inside Weekly Supply Zone)
Outlook
BankNifty continues to struggle near 50,500, facing resistance in the 15-minute zone. The weekly supply zone at 50,485 - 51,980 remains a crucial hurdle. On the downside, 49,900 - 49,800 is a key support area. A break above 50,500 could lead to further upside, while a failure to hold 49,800 may push it lower.

BankNifty Intraday Support & Resistance Levels for 07.02.2025Thursday’s session saw BankNifty opening with a gap-up, reaching a high of 50,553.35, touching the Weekly Resistance Zone, before pulling back to a low of 50,149.80. It later recovered and closed at 50,382.10, gaining 39 points over the previous close. The Weekly Trend (50 SMA) remains negative, while the Daily Trend (50 SMA) is sideways.
Demand/Support Zones
Near Demand/Support Zone (15m): 49,888.35 - 49,977.05
Near Demand/Support Zone (125m): 48,906.05 - 49,373.45
Far Demand/Support Zone (15m): 48,511.70 - 48,627.95
Far Demand/Support Zone (125m): 47,981.35 - 48,319.20
Far Support Level: 46,077.85 (Low of 4th June 2024)
Far Demand/Support Zone (Daily): 44,633.85 - 45,750.40
Supply/Resistance Zones
Far Supply/Resistance Zone (Weekly): 50,485.05 - 51,979.75 (Tested)
Far Supply/Resistance Zone (75m): 50,904.35 - 51,088.90 (Inside Weekly Supply Zone)
Outlook
BankNifty broke above the Daily Supply Zone but faced resistance at the Weekly Supply Zone, indicating potential selling pressure in the coming sessions. A decisive move above 50,900 - 51,150 could indicate further upside, while failure to hold above 49,800 may lead to weakness.

BankNifty Intraday Support & Resistance Levels for 05.02.2025Tuesday’s session saw a strong rally in BankNifty, opening with a 328-point gap-up at 49,538.80, dipping slightly to a low of 49,482.50, and then surging to a high of 50,206.60. It closed at 50,157.95, gaining 947 points over the previous close. The Weekly Trend (50 SMA) remains Negative, while the Daily Trend (50 SMA) is sideways.
Demand/Support Zones
Near Demand/Support Zone (15m): 49,888.35 - 49,977.05
Far Demand/Support Zone (15m): 48,511.70 - 48,627.95
Far Demand/Support Zone (125m): 47,981.35 - 48,319.20
Far Support Level: 46,077.85 (Low of 4th June 2024)
Far Demand/Support Zone (Daily): 44,633.85 - 45,750.40
Supply/Resistance Zones
Near Supply/Resistance Zone (Daily): 49,230.15 - 50,447.60 (Tested multiple times, current price inside the zone)
Far Supply/Resistance Zone (Weekly): 50,485.05 - 51,979.75
Far Supply/Resistance Zone (75m): 50,904.35 - 51,088.90 (Inside the weekly supply zone)
Outlook
BankNifty’s strong recovery brought it inside the Daily Supply Zone, but it still needs to sustain above 50,450 for further upside. The Weekly Trend remains negative, so watch for reactions at key resistance zones. If the momentum continues, the next major hurdle is at Weekly Supply Zone.

BankNifty Intraday Support & Resistance Levels for 03.02.2025Saturday’s special trading session saw BankNifty opening flat, rallying to a day high of 50,009.50, and then witnessing a sharp drop to 48,925.45. It later recovered slightly and closed at 49,506.95, losing 80 points from the previous close. The Weekly Trend (50 SMA) remains Negative, while the Daily Trend (50 SMA) is sideways, indicating a cautious market.
Demand/Support Zones
Near Demand/Support Zone (15m): 48,511.70 - 48,627.95
Far Demand/Support Zone (125m): 47,981.35 - 48,319.20
Far Support Level: 46,077.85 (Low from 4th June 2024)
Far Demand/Support Zone (Daily): 44,633.85 - 45,750.40
Supply/Resistance Zones
Near Supply/Resistance Zone (Daily): 49,230.15 - 50,447.60 (Tested multiple times, current price inside the zone)
Far Supply/Resistance Zone (Weekly): 50,485.05 - 51,979.75
Far Supply/Resistance Zone (75m): 50,904.35 - 51,088.90 (Inside the Weekly Supply Zone)
Outlook
With BankNifty trading within a key resistance zone, a breakout above 50,447 could lead to further upside, while a failure to sustain may result in a retest of lower support zones. The broader trend remains weak, so stay cautious.

BankNifty Support & Resistance Levels for Budget Day 01.02.2025Friday’s session was marked by strong volatility, with BankNifty opening negative and making a day low of 49,031.80 before rallying to 49,674.80. It then dropped to 49,302, only to surge again, closing at 49,587.20, gaining 275 points over the previous close. The Weekly Trend (50 SMA) remains negative, while the Daily Trend (50 SMA) has turned sideways, indicating potential consolidation.
Demand/Support Zones
Near Demand/Support Zone (15m): 49,031.80 - 49,167.90
Near Demand/Support Zone (15m): 48,511.70 - 48,627.95
Far Demand/Support Zone (125m): 47,981.35 - 48,319.20
Far Support Level: 46,077.85 (Low from 4th June 2024)
Far Demand/Support Zone (Daily): 44,633.85 - 45,750.40
Supply/Resistance Zones
Near Supply/Resistance Zone (Daily): 49,230.15 - 50,447.60 (Tested multiple times, current price inside this zone)
Near Supply/Resistance Zone (75m): 49,787.70 - 49,979.05 (Inside the Daily Supply Zone)
Far Supply/Resistance Zone (Weekly): 50,485.05 - 51,979.75
Far Supply/Resistance Zone (75m): 50,904.35 - 51,088.90 (Inside the Weekly Supply Zone)
Outlook
With the Union Budget 2025 set to be presented in Parliament, expect high volatility in Saturday’s special trading session (1st February). For intraday trading, focus on higher time frame zones (75m, Daily, Weekly) instead of lower time frames (30m, 15m, 5m) for better clarity and precision.

BankNifty Intraday Support & Resistance Levels for 31.01.2025Thursday’s session was marked by high volatility, with BankNifty opening flat and making a low of 49,031.80. It then rallied to 49,360.65, dropped again to 49,114.05, and rebounded to a day high of 49,426.20 in the final trading hour, entering the multiple-time-tested Daily Supply Zone. The index closed at 49,311.95, gaining 146 points over the previous close. The Weekly Trend (50 SMA) remains Negative, while the Daily Trend (50 SMA) is Negative to Sideways, signaling potential uncertainty ahead.
Demand/Support Zones
Near Demand/Support Zone (15m): 48,511.70 - 48,627.95
Near Demand/Support Zone (30m): 47,981.35 - 48,195.40
Near Support Level: 46,077.85 (Low from 4th June 2024)
Far Demand/Support Zone (Daily): 44,633.85 - 45,750.40
Supply/Resistance Zones
Near Supply/Resistance Zone (Daily): 49,230.15 - 50,447.60 (Tested multiple times)
Near Supply/Resistance Zone (75m): 49,787.70 - 49,979.05 (Inside the Daily Supply Zone)
Far Supply/Resistance Zone (Weekly): 50,485.05 - 51,979.75
Far Supply/Resistance Zone (75m): 50,904.35 - 51,088.90 (Inside the Weekly Supply Zone)
Outlook
BankNifty is hovering near a strong supply zone, and a breakout above 49,500 could lead to further upside towards 50,000+ levels. However, failure to sustain at current levels may bring support zones into play.

BankNifty Intraday Support & Resistance Levels for 30.01.2025On Wednesday, BankNifty opened with a gap-up, showing initial strength. It made a low of 48,849.80, attempted a rally to 49,165.75, but retraced back to 48,859.70 before recovering again to hit the day's high at 49,199.65. Eventually, it closed at 49,165.95, gaining 299 points over the previous close. The Weekly Trend (50 SMA) and the Daily Trend (50 SMA) remains Negative, indicating overall weakness despite short-term recovery.
Demand/Support Zones
Near Demand/Support Zone (15m): 48,511.70 - 48,627.95
Near Demand/Support Zone (30m): 47,981.35 - 48,195.40
Near Support Level: 46,077.85 (Low from 4th June 2024)
Far Demand/Support Zone (Daily): 44,633.85 - 45,750.40
Supply/Resistance Zones
Near Supply/Resistance Zone (Daily): 49,230.15 - 50,447.60 (tested multiple times)
Near Supply/Resistance Zone (75m): 49,787.70 - 49,979.05 (inside the Daily supply zone)
Far Supply/Resistance Zone (Weekly): 50,485.05 - 51,979.75
Far Supply/Resistance Zone (75m): 50,904.35 - 51,088.90 (inside the weekly supply zone)
Outlook
BankNifty is trading close to a strong supply zone (49,230 - 50,447), making this a crucial resistance level. Failure to break above this zone could lead to another downward move toward 48,000 or lower. However, a decisive breakout above 50,000 could trigger further upside.
With Budget 2025 around the corner, expect heightened volatility in the coming sessions.

BankNifty Intraday Support & Resistance Levels for 29.01.2025On Tuesday, BankNifty opened with a gap-up, signaling strong buying interest. It made a low of 48,449.05 before rallying to a high of 49,247.15. However, in the final trading hour, it gave up some gains, closing at 48,866.85, marking an impressive gain of 802 points over the previous close. Both the Weekly Trend (50 SMA) and Daily Trend (50 SMA) remain Negative, reflecting underlying bearishness.
Demand/Support Zones
Near Demand/Support Zone (15m): 48,511.70 - 48,627.95
Near Demand/Support Zone (30m): 47,981.35 - 48,195.40
Near Support Level: 46,077.85 (low from 4th June 2024)
Far Demand/Support Zone (Daily): 44,633.85 - 45,750.40
Supply/Resistance Zones
Near Supply/Resistance Zone (Daily): 49,230.15 - 50,447.60 (tested multiple times)
Near Supply/Resistance Zone (75m): 49,787.70 - 49,979.05 (inside the Daily supply zone)
Far Supply/Resistance Zone (Weekly): 50,485.05 - 51,979.75
Far Supply/Resistance Zone (75m): 50,904.35 - 51,088.90 (inside the Weekly supply zone)
Outlook
BankNifty's strong rally above 49,200 suggests potential for recovery, but the inability to sustain gains highlights persistent selling pressure near critical resistance levels. The 48,000 - 48,500 zone is a key support area, while resistance near 49,800 - 50,500 could limit upside moves. With the Budget 2025 around the corner, expect heightened volatility in the sessions ahead.

BankNifty Intraday Support & Resistance Levels for 28.01.2025On Monday, BankNifty opened with a massive gap-down of 486 points, reflecting strong bearish sentiment. It initially dropped to a day low of 47,844.15, staged a recovery to hit a high of 48,319.20, but eventually lost momentum again to close at 48,064.65, down by 303 points from the previous close. The Weekly Trend (50 SMA) has now turned Negative, in line with the already Negative Daily Trend (50 SMA).
Demand/Support Zones
Near Support Zone: 46,077.85 (low from 4th June 2024)
Far Demand/Support Zone (Daily): 44,633.85 - 45,750.40
Supply/Resistance Zones
Near Supply/Resistance Zone (Daily): 49,230.15 - 50,447.60 (Tested multiple times)
Near Supply/Resistance Zone (75m): 49,787.70 - 49,979.05 (within the Daily Supply Zone)
Far Supply/Resistance Zone (Weekly): 50,485.05 - 51,979.75
Far Supply/Resistance Zone (75m): 50,904.35 - 51,088.90 (within the Weekly Supply Zone)
Outlook
After briefly breaking below the 48,000 mark (last seen on 13th January), BankNifty managed to reclaim this level by the session's close. With the Weekly Trend turning negative, INDIAVIX surging by 8%, and a major event, Budget 2025 on the horizon, heightened volatility is expected in the coming sessions.

BankNifty Intraday Support & Resistance Levels for 09.01.2025On Wednesday, BankNifty opened flat, touched a high of 50,246.90, and then slid to a low of 49,389.75. However, it recovered from the lows and closed at 49,835.05, losing 367 points over the previous close. The Weekly Trend (50 SMA) remains sideways, while the Daily Trend (50 SMA) stays negative, indicating continued bearish pressure.
Demand/Support Zones
Near Support Level: 49,282.64 (61.8% FIBO retracement)
Far Demand/Support Zone (Daily): 44,633.85 - 45,750.40
Supply/Resistance Zones
Near Supply/Resistance Zone (15m): 50,043.35 - 50,246.90
Near Supply/Resistance Zone (15m): 50,618.95 - 50,813.55
Far Supply/Resistance Zone (125m): 51,082.80 - 51,671.60
Far Supply/Resistance Zone (125m): 52,010.65 - 52,368.30
Far Supply/Resistance Zone (125m): 52,709.40 - 52,911.10
Far Supply/Resistance Zone (Weekly): 52,264.55 - 53,775.10
Outlook
BankNifty exhibited mixed momentum with a recovery from the day’s low, but the overall trend remains under pressure. A break below 49,282 could trigger further bearish action, while the resistance zone at 50,043 must be cleared to hint at any recovery.

BankNifty Intraday Support & Resistance Levels for 08.01.2025On Tuesday, BankNifty opened with a gap-up and traded within a range, making a low of 49,969.30 and a high of 50,447.60. It closed at 50,202.15, gaining 280 points over the previous close. While the Weekly Trend (50 SMA) remains sideways, the Daily Trend (50 SMA) continues to show negativity.
Demand/Support Zones
Near Support Level: 49,282.64 (61.8% FIBO retracement)
Far Demand/Support Zone (Daily): 44,633.85 - 45,750.40
Supply/Resistance Zones
Near Supply/Resistance Zone (15m): 50,618.95 - 50,813.55
Near Supply/Resistance Zone (75m): 50,904.35 - 51,088.90
Far Supply/Resistance Zone (125m): 52,010.65 - 52,368.30
Far Supply/Resistance Zone (125m): 52,709.40 - 52,911.10
Far Supply/Resistance Zone (Weekly): 52,264.55 - 53,775.10
Outlook
BankNifty managed to close above 50,000, showing some recovery. A breakout above 51,100 could indicate further upside, while a dip below 49,282 might bring bears back into control.

Banknifty prediction technical-fundamental analysis|30-Dec-2024Nifty technical & fundamental analysis F&O Intraday |30-Dec-2024
Query:-
message us for any stocks related information.
follow us for more updates information.
arrowindex.live

Banknifty Intraday Trade Setup,technical analysis |27 Dec 2024Bank nifty moments for option and future trading 27th/Dec/2024
follow us for more updates information. message us for any stock
