Bankniftytrading

[INTRADAY] #BANKNIFTY PE & CE Levels(12/06/2025)Today, a gap-up opening is expected in Bank Nifty near the 56550–56600 zone. If the index manages to sustain above this range, it may trigger an upside move toward 56750, 56850, and 56950 levels. A further breakout above 57050 could extend the bullish rally toward 57250, 57350, and possibly 57450+ during the session.
However, if Bank Nifty fails to hold above 56550 and begins to trade below 56450, a downward move could unfold toward 56250, 56150, and 56050 levels. Any sustained weakness may increase selling pressure, dragging the index further down intraday.


[INTRADAY] #BANKNIFTY PE & CE Levels(11/06/2025)Bank Nifty is opening with a slight gap-up around the 56650–56700 zone, continuing its consolidation phase from the previous sessions. The index has been oscillating within a narrow range, reflecting indecision among market participants. Today’s early movement suggests that unless there is a clear breakout or breakdown, the sideways momentum may persist. If Bank Nifty manages to sustain above the 56650 level, it could attempt an upside toward 56750, 56850, and possibly 56950+.
A stronger bullish breakout would be confirmed only if the index crosses and holds above 57050. On the other hand, failure to hold above 56600 and a breakdown below 56450 may trigger a short-term correction toward 56250, 56150, and 56050.
Given the tight structure, traders should remain cautious, avoid aggressive entries, and focus on quick trades with defined stop-losses and targets.

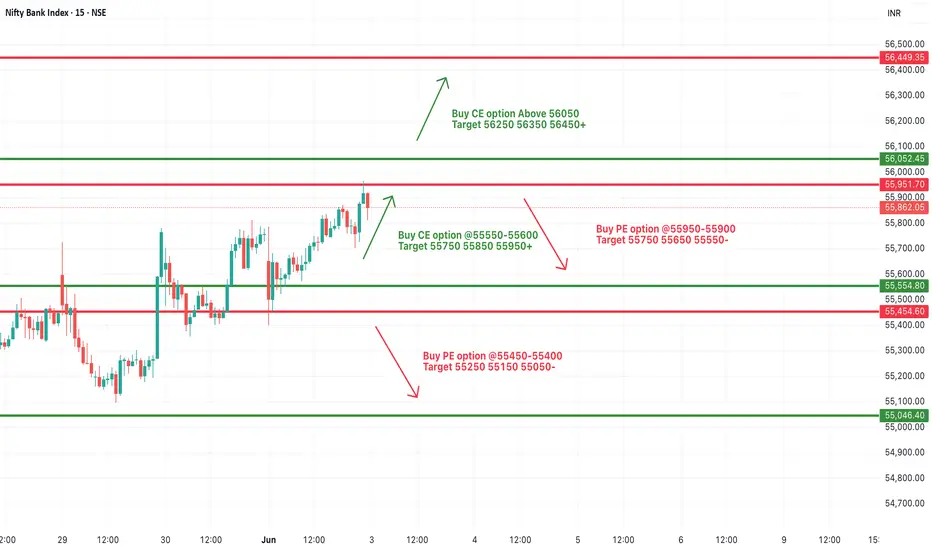
[INTRADAY] #BANKNIFTY PE & CE Levels(06/06/2025)Bank Nifty is opening with a slight gap-up around 55800, but continues to consolidate in the same range that has held for the past few sessions. Despite attempts, no significant breakout or breakdown has occurred, indicating indecision and a potential buildup for a larger move.
Upside continuation will only be confirmed if the index sustains above 56050, opening room for a move toward 56250, 56350, and 56450+.
On the other hand, if price starts slipping back below 55900–55850, the index may retrace toward 55750, 55650, and 55550. Breakdown below 55450 will be a clear sign of weakness, targeting 55250, 55150, and 55050.

[INTRADAY] #BANKNIFTY PE & CE Levels(03/06/2025)Bank Nifty is expected to open flat around the 55850–55900 zone, continuing near the same levels as the previous session. The index is currently trading in a tight range, indicating potential breakout or reversal zones are nearing.
If Bank Nifty sustains above the 55550–55600 zone, bullish momentum could continue toward 55750, 55850, and 55950+. A clear breakout above 56050 would confirm a fresh upward leg, with extended targets at 56250, 56350, and 56450+.
On the downside, if Bank Nifty slips below 55900–55950, a minor correction is possible with short targets at 55750, 55650, and 55550. Further weakness would only be confirmed below 55450–55400, exposing the downside to 55250, 55150, and 55050.
[INTRADAY] #BANKNIFTY PE & CE Levels(27/05/2025)Today, Bank Nifty is expected to open flat near the 55550 level. If it sustains above 55550, we may see further bullish momentum with upside targets of 55750, 55850, and 55950+. This breakout level may trigger strong buying interest.
On the downside, if Bank Nifty fails to hold above 55550 and drops below the 55460–55400 zone, then a bearish move may be seen toward 55250, 55150, and 55050 levels.
If it slips further below 55100, another buying opportunity may come near the 55050–55100 zone for a possible bounce targeting 55250, 55350, and 55450+.

[INTRADAY] #BANKNIFTY PE & CE Levels(26/05/2025)Today, Bank Nifty is expected to open with a gap-up above the 55550 level. If it sustains above this zone, we may see a strong upside rally toward 55750, 55850, and 55950+. This level breakout can trigger bullish momentum for the session.
However, if Bank Nifty fails to hold above 55550 and slips below 55450–55400, then a short trade opportunity arises with downside targets at 55250, 55150, and 55050.
Further weakness can be expected only if Bank Nifty breaks below 54950, opening downside levels of 54750, 54650, and 54550.

BANKNIFTY : Trading levels and Plan for 26-may-2025📊 Bank Nifty Trading Plan – 26-May-2025
Timeframe: 15 Min | Reference Spot Price: 55,389
Gap Opening Threshold: 200+ Points
🚀 Gap-Up Opening (Above 55,589) – 200+ Points
If Bank Nifty opens above 55,589, it will directly enter or hover near the crucial Opening Resistance Zone of 55,417–55,510 and potentially head toward the upper Profit Booking Zone: 55,834–55,999.
🟥 This zone has shown signs of supply in the past and may act as a trap for early breakout buyers if price action isn't strong.
✅ Plan of Action:
– Avoid aggressive longs immediately after the gap-up.
– Wait for price to sustain above 55,510 and then break and close above 55,834 on a 15-min candle to confirm strength.
– If this happens, you may look for long entries targeting 55,999 – 56,065 with stop loss just below 55,700.
– However, if Bank Nifty faces rejection in the red zone (55,834–55,999), then Sell-on-Rise opportunity can be considered with a downside target back to 55,510 – 55,417 and eventually 55,136.
– Use a bearish reversal pattern (like Evening Star or Engulfing) in the red zone to trigger shorts.
🎓 Educational Insight: A gap-up into resistance often gives a false breakout if momentum and volume are not supportive. Always wait for confirmation before going long.
📈 Flat Opening (Between 55,189 – 55,589)
This keeps Bank Nifty between the Opening Support (55,136) and the Opening Resistance Zone (55,417–55,510).
🟧 This is the choppy zone. Expect mixed emotions in the market during the first 15–30 mins.
✅ Plan of Action:
– Avoid early trades in the first 15–30 mins.
– Wait for directional cues.
– If price holds above 55,417 and gives a strong bullish breakout above 55,510, you can ride a potential move toward 55,834–55,999.
– On the downside, if price slips below 55,136, expect momentum to pick up toward 55,005 and possibly 54,758.
– Only trade if clear breakout or breakdown candle appears with volume support.
🎓 Educational Insight: Most fake breakouts happen in flat openings. Let the market show its hand—follow only when structure and strength align.
📉 Gap-Down Opening (Below 55,189) – 200+ Points
A gap-down below 55,189 would bring prices near key demand zones: Opening Support: 55,136, Intraday Support: 55,005, and Last Strong Support: 54,758.
🟩 These levels can either absorb the fall and bounce or lead to further decline if broken decisively.
✅ Plan of Action:
– Observe price action near 55,005 and 54,758.
– If bullish reversal candles (like hammer or bullish engulfing) form and price sustains above support, consider a long setup targeting a bounce back to 55,136 – 55,417.
– On the other hand, if price decisively breaks 54,758, then consider short entries with next downside target in swing low regions (can extend 100–150 pts down).
– Stop loss for longs: below 54,700.
– Stop loss for shorts: above 54,850.
🎓 Educational Insight: Gap-downs to support can offer great R:R long entries if price shows strength. But wait for candle structure to confirm reversal before entering.
🛡️ Options Trading – Risk Management Tips
✅ Don’t rush into trades at the open —allow price structure to develop.
✅ Use slightly ITM options instead of deep OTM for better delta movement and less decay.
✅ Don’t overleverage —risk only 1–2% of your capital per trade.
✅ Always define your stop loss based on spot levels , not just the option premium.
✅ Exit after 2 consecutive stop-losses to maintain discipline and emotional stability.
✅ Book partial profits as the trade moves in your favor and trail SL for the rest.
✅ Avoid chasing momentum blindly ; volume and structure confirmation are key.
📌 Summary & Conclusion
🔹 Opening Resistance Zone: 55,417 – 55,510
🔹 Profit Booking Zone: 55,834 – 55,999
🔹 Opening Support: 55,136
🔹 Last Intraday Support: 55,005
🔹 Final Strong Support: 54,758
📈 For Gap-Ups, watch for price rejection near upper zones or breakouts beyond 55,999.
📉 For Gap-Downs, reversal setups at 55,005 or 54,758 are key—don’t short blindly.
🕒 In Flat Openings, let the market settle for 15–30 minutes. Trade only on confirmation.
⚖️ Best trades occur when price moves away from zones with proper volume, pattern, and structure alignment .
⚠️ Disclaimer:
I am not a SEBI-registered analyst. This trading plan is intended purely for educational purposes. Please do your own analysis or consult a SEBI-registered advisor before initiating any trades.

[INTRADAY] #BANKNIFTY PE & CE Levels(22/05/2025)Today, a flat opening is expected in Bank Nifty. After opening, if Bank Nifty starts trading below the 54950 level, a further downside movement is possible towards the 54750, 54650, and 54550 levels during the session.
On the upside, if Bank Nifty begins to trade and sustain above the 55050–55100 zone, it could trigger a bullish move toward 55250, 55350, and potentially 55450+.
However, 55450 will act as a strong resistance for today’s session — any upside rally may face rejection or reversal from this level.
Trade with strict stop loss and keep trailing profits as market can remain range-bound with spikes.

[INTRADAY] #BANKNIFTY PE & CE Levels(21/05/2025)Today will be flat opening expected in banknifty. After opening if banknifty starts trading below 54950 level then possible further downside upto 54550 level in today's session. Upside movement expected if banknifty starts trading and sustain above 55050 level. Upside 55450 level will act as a strong resistance for today's session. Any bullish side rally can be reversal from this level.

[INTRADAY] #BANKNIFTY PE & CE Levels(20/05/2025)Today will be flat opening in index. Currently index trading in the consolidation zone. Upside movement can expected if banknifty sustain above 55550 level in today's session. Similarly, Downside expected below 55450 level. Downside 55050 will act as a strong support for today's session.

[INTRADAY] #BANKNIFTY PE & CE Levels(19/05/2025)Today will be flat opening expected in banknifty. After opening possible banknifty will consolidate in between 55050-55450 level in today's session. Strong upside rally expected if banknifty gives breakout and starts trading above 55550 level. This upside rally can goes upto 55950+ level after the breakout. Any major downside only expected below 54950 level.

[INTRADAY] #BANKNIFTY PE & CE Levels(16/05/2025)Flat opening in banknifty. After opening if any downside movement can goes reversal from 55050 level. Strong upside rally expected if banknifty starts trading above 55550 level. This upside rally can goes upto 55950+ level in today's session. Any major downside only expected below 54950 level.

[INTRADAY] #BANKNIFTY PE & CE Levels(15/05/2025)Today will be slightly gap up opening expected in banknifty. After opening if banknifty starts trading and sustain above 55050 level then expected bullish movement in index. This movement can goes upto 55450 level and can extend further upto 400-500+ points in case banknifty starts trading above 55550 level. Below 54950 negative movement expected. 54550 level will act as a downside support for banknifty. Major downside movement expected in banknifty below 54450 level.

[INTRADAY] #BANKNIFTY PE & CE Levels(14/05/2025)Today will be flat opening expected in index. After opening if banknifty starts trading and sustain above 55050 level then upside movement expected upto 55450+ level. 55450 will act as a resistance for today's session. Possible banknifty will consolidate in between range of 55050-55450 level. In case banknifty gives breakout of 55500 level and starts trading above 55550 then expected strong upside rally of 400-500+ points. Any downside only expected below 54950 level.

[INTRADAY] #BANKNIFTY PE & CE Levels(13/05/2025)Today will be flat or slightly gap up opening expected in banknifty. After opening if banknifty sustain above 55050 level then expected upside movement upto 55450 and this movement can extend for further 400-500+ points in case banknifty gives breakout of 55550 level. Any downside only expected below 54950 level. Downside 54550 level will act as a strong support for today's session.

[INTRADAY] #BANKNIFTY PE & CE Levels(09/05/2025)Today will be gap down opening expected in banknifty. Expected opening near 54000 level. After opening if banknifty started trading below 53950 level then expected further downside rally upto 53550 level and this can be extend for further 400-500+ points if it gives breakdown of 53450 level. Any upside movement expected if banknifty sustain above 54050 level.

[INTRADAY] #BANKNIFTY PE & CE Levels(08/05/2025)Flat opening in banknifty. After opening if banknifty sustain above 54550 level then expected upside movement upto 54950+ level in opening session. Downside movement expected if banknifty starts trading below 54450 level. Downside 54050 level will act as an important support for today's session. Any major downside only expected below this support level.

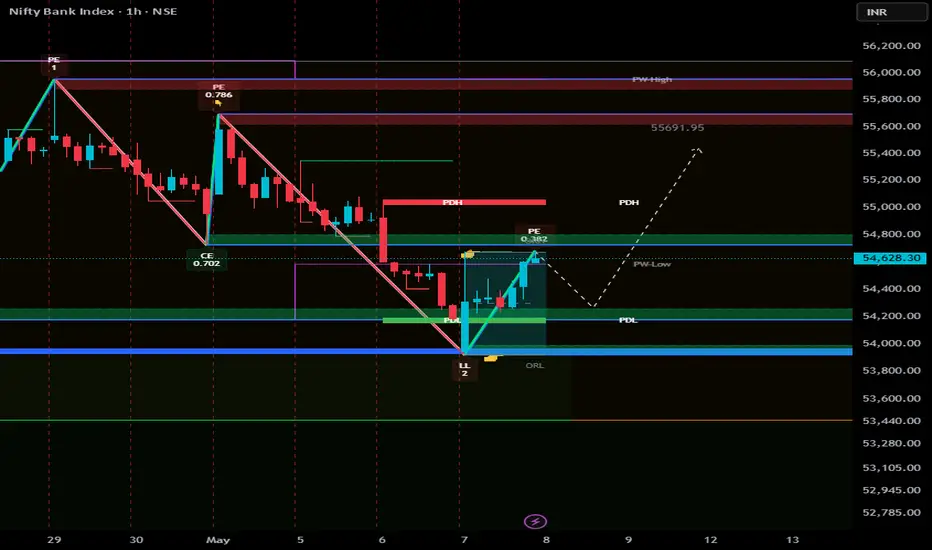
Next strike on 55690Market Update: Bank Nifty Outlook
Today, following news of an Indian Army operation, Bank Nifty witnessed a significant gap-down opening. However, it quickly recovered and moved upward with strong momentum.
Currently, based on the chart structure, we require the formation of a higher low to confirm the next leg of the uptrend toward the 55,690 level. If Bank Nifty opens flat in the next session, there is a strong potential for a sustained rally on the upside.
We advise closely monitoring price action around key support zones for confirmation.
[INTRADAY] #BANKNIFTY PE & CE Levels(06/05/2025)Today will be flat opening in index. After opening if banknifty starts trading and sustain above 55050 level then expected upside movement upto 55450+ level in opening session. Major downside expected if banknifty not sustain above level and starts trading below 54950 then possible downside upto 54550 support level.

[INTRADAY] #BANKNIFTY PE & CE Levels(05/05/2025)Today will be gap up opening in banknifty. After opening if banknifty sustain above 55050 level then upside movement upto 55450+ level expected and this can be extend for further 400-500+ points in case banknifty starts trading above 55550 level. Any major downside only expected below 54950 level.

Bank Nifty Breakout 56100 or breakdown 54250 .. what next !!Bank Nifty Technical Outlook:
Bank Nifty is currently forming a lower high and higher low pattern, indicating a symmetrical triangle formation. The trading range is getting increasingly narrower, suggesting that a decisive breakout is imminent on either side.
Downside Scenario:
If Bank Nifty breaks down below 54,200, we could see a retracement towards the 52,930 – 52,300 levels, where multiple virgin CPRs (Central Pivot Ranges) are present, potentially acting as support zones.
Traders should closely monitor price action near the current range boundaries for confirmation of direction.
