NEAR the Bottom? - The Crash Ends HereBack in October 2023, NEAR embarked on an incredible bull run lasting 147 days, surging from a low of $0.971 to a high of $9.01—an astounding +828% gain. Following this euphoric phase, the market sentiment shifted dramatically. Over the subsequent 392 days, NEAR retraced to around $2, marking a -78% decline. Now, with the market at a critical juncture, the question remains: when does the madness of the crash end, and can we finally see a reversal?
Harmonic Patterns & Fibonacci Confluence
Chart Pattern Analysis: The XABCD Framework
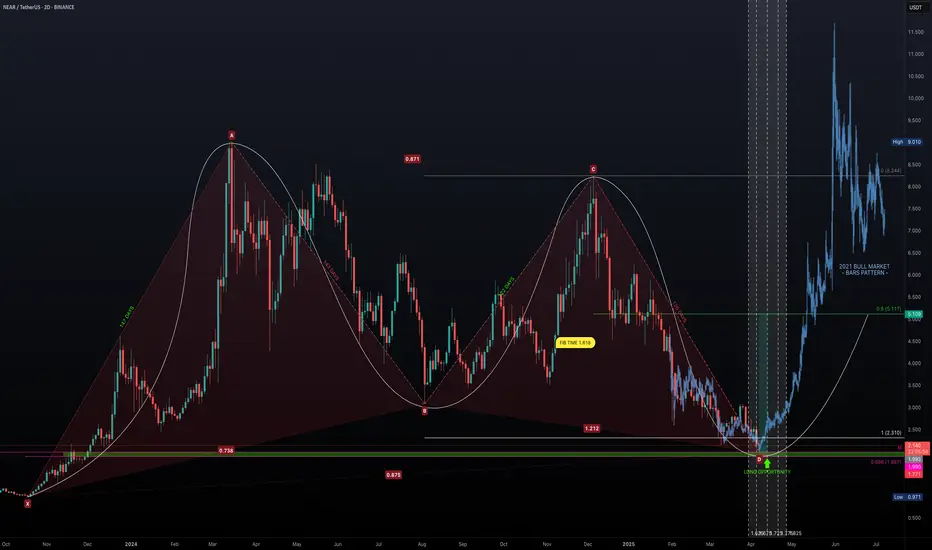
Using the XABCD pattern tool, we identify the following key points:
Point X: $0.971
Point A: $9.01
Point B: $3.076
Point C: $8.244
Point D: $1.978
Durations:
X-A: 147 Days
A-B: 143 Days
B-C: 122 Days
C-D: 126 Days
These durations show remarkable symmetry—with the up-move phases (X-A and A-B) nearly matching in time, and similarly for the correction phases (B-C and C-D). This time symmetry supports the presence of a harmonic structure, and the retracement levels help validate the potential for a reversal.
Fibonacci Implications
Fib Retracement of XA: Point B is at 0.738
Fib Retracement of AB: Point C sits at 0.871
Fib Retracement of BC: Point D lands at 0.875
Fib Extension of BC: Point D is at 1.212
While Point D’s retracement at 0.875 is slightly deeper than the classic 0.786 level expected for a Gartley Harmonic, it remains close enough to validate a harmonic correction, especially considering market noise. Additionally, the expansion of BC at 1.212 is close to the 1.27 range, lending further credence to this being a Gartley-type pattern.
Time Factor: Fibonacci Time Extensions & Exhaustion
147-day Bull Run: NEAR rose from $0.971 to $9.01 in 147 days.
392-day Bearish Correction: Since hitting $9.01, the price has retraced for 392 days.
Fibonacci Time Extensions:
1.618 multiplier: 147 × 1.618 ≈ 238 days. A Classic "golden ratio" reversal target. This period coincided with a +135% surge in November.
2.618 multiplier: 147 × 2.618 ≈ 385 days. High-probability exhaustion point. This is nearly equal to the current 392 days, suggesting that time-based exhaustion may be imminent.
The alignment of these time-based measures with the price retracement (approximately 87.5% retracement of the original move) signals a critical juncture where the bearish phase could soon be over.
Identifying the Support Zone & Long Opportunity
Based on harmonic and Fibonacci analyses, the confluence of key support levels points to a potential bottom:
Harmonic Point D: Trading near $2.
Monthly Level: $1.99 acts as a strong support benchmark.
Fibonacci Retracement (0.886): at $1.887.
These levels create a long opportunity window between $1.99 and $1.887. This confluence offers a solid entry region for long positions.
Additionally, other confluence factors include:
Fibonacci time extension at the 2.618 level (around 385 days) aligning with the current duration of the bearish phase.
The symmetry of the XABCD pattern adds to the reliability of the support structure.
High-Probability Trade Setup
Long Entry:
Entry Zone: Accumulate positions in the $1.99 to $1.887 range.
Target: Aim for the 0.5 Fibonacci retracement level of the bull run, approximately $5.00, which represents a potential +150% gain from current levels.
Risk-to-Reward (R:R): With the setup targeting a substantial rebound, the risk-reward ratio is very attractive, particularly if entry is taken in the defined confluence zone.
Market Outlook:
Current Sentiment: NEAR is in a significant downtrend, evidenced by a dramatic -78% retracement after an explosive bull run.
Reversal Indicators: The harmonic pattern, Fibonacci retracements, and time exhaustion (392 days approaching the 2.618 extension) all point towards a possible bottom formation in the coming month, particularly during April.
Potential Reversal: If NEAR holds within the $1.99 to $1.887 window, a reversal back towards $5.00 appears plausible, echoing the conditions seen at previous market cycle reversals.
Key Takeaways
Historic Run & Severe Correction: NEAR surged over +828% in 147 days only to retrace -78% over the following 392 days.
Harmonic Confluence: The XABCD pattern and Fibonacci levels create a compelling argument for a turnaround.
Time & Price Alignment: Fibonacci time extension around 385 days combined with an 87.5% price retracement suggests market exhaustion.
Solid Long Entry Zone: The support between $1.99 and $1.887 offers an attractive risk entry point with the potential to target a move back up to $5.00.
After decades in the trading arena, one thing is clear—the market often cycles through periods of euphoria and despair before turning a corner. NEAR's confluence of harmonic symmetry, Fibonacci retracement, and time-based exhaustion is almost too aligned to ignore. With a defined long entry window between $1.99 and $1.887, this might be the moment to consider a high-probability long trade. As always, manage your risk diligently and wait for clear confirmation.
Wrapping it up here, happy trading =)
If you found this helpful, leave a like and comment below! Got requests for the next technical analysis? Let me know.
Barspattern
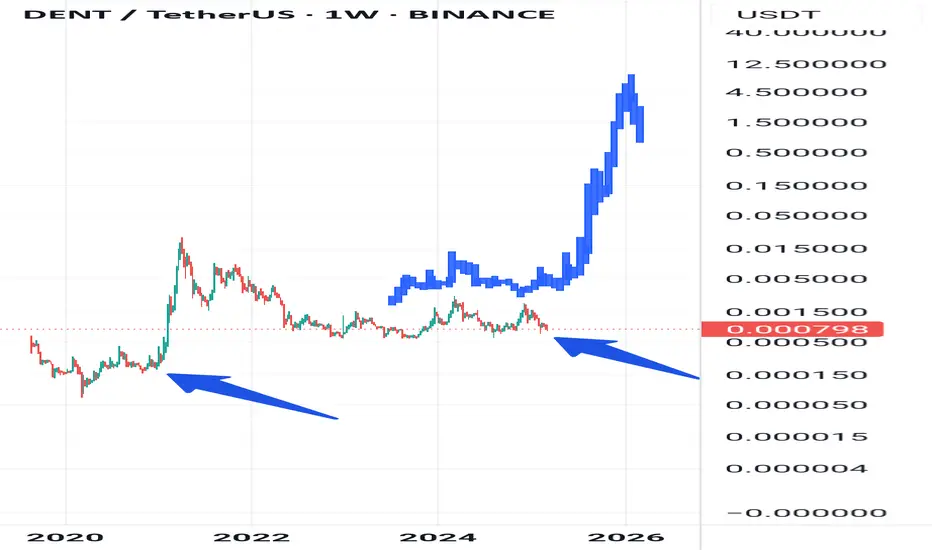
Is this pattern on Dent repeating?Look at the chart above. The bars pattern looks EXACTLY like the one from 2020/2021, but is a bit extended (which is in line with lengthening cycles).
Target: 0.08$ (which is about a 100x from here)
Stoploss: 0.0007$
Is this the one for you for altseason 2025?
Rustle
Will this same bars pattern on CHZ repeat?Welcome back dear reader, for another Chilliz post.
As i've been analyzing the chart further my eye fell on the bars pattern from May till October 2020, and noticed that it looks ALOT like the current bars pattern.
The market structure it would form would also make alot of sense from a traders perspective. Allow me to explain while i have your attention.
The only sellers remaining now are from 2021 or earlier, so we might stay in this area for a couple of weeks for people to capitulate. Those that got in earlier are eager for a break-even and will probably get that end of this month or beginning of April. Then around the latter half of May we might see 0.20$ followed by a retest of the lower bounds forming a perfect W as traders suspect it to be the absolute end of the bullmarket. Only for it to be followed by a quick recovery and a massive blowoff top!
Target: Remains around 3$ (The fractal would indicate 17$ and a market cap of 160B, at 3$ it would be 28B which isn't too farfetched)
Stoploss: 0.032$
Final remarks: Do i know for certain that it will happen? No, but the charts tell us a different story.
Rustle

Will this bottoming pattern return you 300%?Dearest reader, superrare has been showing tremendous strength during the recent downtrend by which RARE captured my eye. A whopping 4000% increase in volume in just one day might be a sign for things to come.
Looking at the above chart a couple of things stand out. Looking at the current bars pattern is looks eerily similar to the one from August 2024 (blue arrows).
I expect resistanceline A to be hit in the near future, from current price this would be 100% gain. If broken the sky is the limit but be aware of resistanceline B. If that is broken... expect massive gains!
Target: 0.35$
Stoploss: 0.046$
Rustle

BTC market cycle tops inverted onto current price, date targets.I mapped the bars pattern from the BTC market cycle tops. I projected where the price action might go by inverting the top pattern and then matching it to the current price action by stretching the pattern. It says we will stay around this range until July, then will pull back to 20k by sep/oct, rally Oct/Nov to 25k, pullback dec, 15.5k lows through march 2024. Price action will spike at the BTC halving on 4/22/24 from 17.4 - 23.7 beginning an uptrend. There will be a pullback to 19.3k in the beginning of June before we rally to 28k to AUG. Then we go sideways and down for 220days. 11months after the halvening we will breakout. June 09 2025 we will break out to 44k and continue much higher. According to this theory I just charted today, could be invalidated in the next couple of months.

Thoughts on $AMD moving like this?Any thoughts on $AMD following this bars pattern? Seems to fit too perfectly with my trend lines. Of course the timing could be off slightly but I have $AMD trading sideways/sideways down for a day or two before moving up to a PT1 of $83.16 and a PT2 of $85.55 then moving back down to potentially test ~$75.

ppd contraction, ml strat consolidative, musashi crossthese strategies are signaling the consolidative move isnt over, and revisiting mean and regression is likely
theres no way to prove at the moment we will go through a phase like this, but if the opportunity presents itself its a path that mathematically makes sense

BTCUSD midterm (3-4 months)Hello guys
the pattern is repeating itself again, we can expect a bearish market for the short term ( max 1 month) then it will be a bullish market.

$BTC 👀 Possible wykoff accumulation fractal layover 🌊🌋Using the bars pattern to lay the fractal of the 2021 bar run over today's recent bear market, we can see some pretty good similarities between the two. This suggests that $BTC could be due for its relief really now, more than likely rejecting off of the $35K-$38K region, then finding its last area of support just under $30K, then finishing its accumulation and sending back towards ATH.
Leave a comment with your thoughts!
**This is my opinion based off of chart data and is not financial advice. **

USOIL Bars Pattern IdeaIf a deleveraging like 1999 is happening, perhaps we will see 1999-2008 in oil play out in a similar fashion? Not saying it will or won't happen, but it currently looks like oil is setting up momentum for a future breakout.
I copied the bars pattern from 1999 to 2008. Maybe it's too bullish? Or maybe not bullish enough. I would venture to say that it seems so much worse than 1999, the prediction isn't bullish enough, but I'm not sure.
What do you think?
Good luck and don't forget to hedge your bets :)

Bitcoin Bars Pattern Projection 1h ChartA projection of a possible scenario using bars pattern from a recent historical price action.

Bitcoin repeating the same price action?
Hello traders,
I was going over prior price action when I noticed some similar movements from the beginning of this run when we all were historically waiting for the $10,500 price to be broken and become support. In the beginning of the run we had very similar price action to where we are at now. So I just wanted to share a bars pattern with you from the highlighted area on the chart shown here placed over the current price action that we are in now. Let’s see if it plays out.
Have a green week folks!

AMC -- Threading The GatesHave you ever watched slalom skiers? The way they weave down the mountain and pass between gates? AMC has been doing something similar for 8 straight trading days.
What you have here is the same chart we've been looking at from the Accumulation Within The Spring that I first shared on Dec. 2. Once it seemed we'd reached bottom, I went to my The Cycle, Redux chart and wondered what it would look like if I tried to sync the low on Dec. 3 with the low on Jan 5. So, I took bars patters from a handful of timeframes and pulled them into place on this chart. Then, I just watched.
What emerged a few days ago was that the daily bars pattern, squished to mimic the quicker timing of the print currently, was most accurate. And, my "most accurate" I mean, so far -- eight days straight -- perfect. We've even hit 5 bullseyes in those 8 days, which seems statistically impossible.
You are actually seeing two different bars patterns overlaid on one another to mimic the shape of a daily candle and wick. For the white candle, I used an HL pattern and for the yellow a OC pattern. Because the bulk of the past price action took place between candle open and close, I consider this "body of the candle" to be the bullseye, but in reality passing through the gate seems like an improbability after just a few trading days. I'll also note that this holds a fairly Wyckoffian pattern as this micro accumulation consolidates after SOS, before exiting into Phase E and pushing the price action back into the master trading range we've been in since June.
This is something I'll continue keeping an eye on.
All charts referenced are below.
As always, feel free to click "Make Chart Mine" and enjoy tinkering with it for yourself.

BTCUSDT Hello friends❤️
The price is in a downtrend, now trading directly at the resistance level . After a strong movement, I do not think that a breakdown and growth is possible. I expect the price to fall to the support level . My target is 41560
Do you agree with me?

Coincidance ? I think not ( hystorical theory )Hi guys
the daily chart is going the same way that it went at april
look at the ichimoku lines cross and compare with now
look at the position of price , near the cloud
and if this theory is right , I expect a dump tp 38k
and beyond that . Where is wave C ? :)
good luck
*****THIS IS JUST THEORY *****

Re distribution Next event!Welcome to thunderboy21 technical analysis,
Here you see 2 parts on the chart that are very similar to each other, as i have said is my previous Post i was looking at this fractal from above distribution and projected it on this price action.
i shorted the top via this fractal for a 20% move down ( Did not expect that fast )
i think this is just going to play out, first on the rise up to 49k ish everyone gets ultra bullish and fomo longs, only to sell into the bigger sell orders that are waiting at these levels.
in the next post i will post the picture of this .618 - .66 fib with all the confluence i found! Make sure you check it out!
SMASH that like button !
Follow for more great insights!
that is thunderboy21 signing out

An Introduction To Trading Inside Bar SignalsToday’s lesson is an introduction to the inside bar signal and how to trade it. It’s really one of my favorite patterns to trade, especially on the daily chart time frame. Why, you ask?
It’s simple. The inside bar pattern shows a pause or indecision in the market, and depending on the surrounding price context it formed within, this provides us with an extremely valuable clue about what a market is about to do next.
The inside bar is yet another “tool” in your price action toolbox that will add to your trading strategy which when mastered will help improve your chances of long-term trading success.
Let’s get started with some introductory concepts and theory on inside bars…
What is An Inside Bar?
An inside bar pattern is a multi-bar pattern that consists of a “mother bar” which is the first bar in the pattern, followed by the inside bar. An inside bar pattern can sometimes have multiple inside bars within the same mother bar.
Here is what standard inside bars look like:
As you can see by the image below, inside bars can form exactly in the middle of the mother bar or close to either the high or low, there is not an EXACT way they have to look, just as long as they are contained within high to low distance of the mother bar
4 Variations of Standard Inside Bars
1. Double (multi) inside bar
The “double inside bar” consists of two inside bars within the structure of the mother bar. They are pretty common and often times you will even see 3, 4 or sometimes (rarer) even more inside bars within the same mother bar structure. These patterns signify a prolonged period of indecision in the market and they can come before very powerful breakout moves…
2. Coiling Inside Bars
Coiling inside bar patterns occur when 2 or more inside bars are “coiling” up tighter and tighter like a spring, within one another. Pay special attention when you see these because they mean the market is contracting and just like a spring wound up tighter and tighter, eventually it’s going to “release” and explode into a powerful move (in many cases).
3. Fakey Pattern (inside bar false-break )
The fakey trading pattern is very important in regards to inside bars because there is an inside bar pattern within a fakey. As you can see below, a fakey is actually a false break out from an inside bar pattern. It’s literally where price initially breaks one way from an inside bar pattern, but then quickly reverses, sucking everyone out who was wrong and then charging back the other direction. Obviously, these are giving us VERY intelligent clues as to the next potential direction in price.
4. Inside Bar Pin Bar Combo Pattern
As we all know, pin bars are one of the best price patterns you can trade and when it’s when you get a pin bar that is also an inside bar, that you have an inside bar pin bar combo pattern.
When you combine a pin bar into an inside bar, you are getting both a “wind-up” that is going to be released and a pin bar with a tail / shadow that indicates the next potential direction of the market. Hence, an inside bar is not just a pause in the market, it’s a pause with an extra piece of confluence behind it, and as a result, a more powerful price action signal.
Trading Inside Bar Patterns
There are essentially two main ways we can look to trade inside bars, as with most other patterns; as a continuation signal or as a reversal pattern.
Now, I prefer to trade them as continuation signals in trending markets on the daily chart, because that’s the easiest way to trade them quite frankly. However, inside bars CAN indeed be very powerful at major support and resistance levels as reversals. Let’s look at some examples:
1. Trading Inside Bars as Continuation Move s
The “classic” way to trade an inside bar pattern, and the way that I love trading them the most, is within a trending market, as a continuation move.
An inside bar is much easier to take in a trending market because the odds are already in your favor for trading with the trend. The inside bar will many times lead to a breakout or continuation in-line with the existing trend direction. They can provide a good structure to try to pyramid your trade into a huge win.
Tip : Avoid trading inside bars at major levels until the level has cleared, because many times such inside bars will create a false break at the major level.
2. Trading Inside Bars as “Stall Patterns” / Reversals
Sometimes, you can trade an inside bar as a reversal / stall pattern where price “stalls” out at a level and that leads to a reversal back the other direction.
In the chart below, we can see an example of a good inside bar reversal signal. Notice that the inside bar formed at a key chart level, indicating the market was hesitating and “unsure” if it wanted to move any higher. We can see a strong downside move occurred as price broke down past the inside bar’s mother bar low..
Please note that trading inside bars as reversal patterns should ONLY be tried after you have successfully mastered trading them in-line with the daily chart trend as continuation / breakout plays, as we discussed above.
Special Inside Bar Trading Tip s
Here are some of my tips and tricks when trading inside bars. These are things that I learned over the years that will improve your chances of success when trading this pattern:
1. Tighter inside bar patterns and coiling inside bar patterns often lead to explosive large break out moves. This is because of the “stored energy” that took place as the market “coiled”, that energy typically gets released in the form of a strong breakout move…
2. Patterns containing smaller inside bar patterns allow tighter stop losses and great risk reward, these are the ideal candidates.
3. Be wary of patterns with both very large mother bars and large inside bars, these can often be difficult to trade due to lots of false signals and they make it more difficult to manage risk.
4. My favorite 2 patterns are – Fakey signals and – Inside bar pin bar combos.
5. We must learn to filter inside bars because the one bad thing about them is that a lot of them form across all time frames. However, with proper training and experience on the charts, you will learn to differentiate.
CONCLUSION
This was a basic introduction to the inside bar signal and how I trade it, I cover this pattern and much more in my advanced price action trading courses. Upon joining, some of what you will learn is:
1. More inside bar variations and how to trade them.
2. More example charts.
3. Members trading discussion forum, including inside bar discussion
4. Daily members on-going daily and weekly market commentary where we discuss potential inside bar trade setups as they form.
5. Members trading videos and articles library that includes more in-depth inside bar trading training.
6. Email coaching & Support line.
7. On-going updates for free
I hope you found today’s lesson helpful and inspiring. Inside bars are truly one of the most interesting and powerful price action signals so I hope you enjoyed learning about them and that you’ll continue to do so.
Please Leave A Comment Below With Your Thoughts On This Lesson…
If You Have Any Questions, You can drop your question as comment or message me privately.


Explaining Bars, Graphic Guide Part 8As one of the most popular types of business charts, a bar chart provides a lot of information to technical analysts. As a result, it enables traders and investors to come up with thoughtful trading strategies, designed to take advantage of the market, allowing traders and investors to profit from different values.
To better understand a bar chart, you must learn its different parts.
High - is at the peak of a single bar. Represents the highest price for the day or time period you are using.
Open - This is the first price a security first trades at and only occurs when the stock market opens for trading. This is represented by a horizontal bar near the foot of the vertical bar.
Low: As the lowest price traded during the day, it is at the foot of the vertical bar.
Close: As the last traded price of the day, it is represented by a horizontal bar that projects towards the ad on the right located near the top / peak. During this time, traders are supposed to exit a trade or complete transactions before the market closes.
Direction: The bar graph indicates the direction and is represented by the opening and closing feet. What you need to know is that if the opening foot is above the closing foot, it indicates upward progress. When the closing foot is below the opening foot, this indicates that the price has moved down.
Range: is represented by the location of the top and bottom of the vertical bar. The Range value is calculated by subtracting the minimum from the maximum.
A bar chart belongs to OHLC charts or Open-High-Low-Close chart types and as such is formed through the connection of a series of price points. As a result, the chart is plotted on the X and Y axes. The X axis represents time which is represented in terms of days, while the Y axis represents price.
Bar Chart (OHLC)
OHLC = Open,High,Low,Close
Well, for simplicity, let's look at an example of the OHLC bar.
Now let's see how this bar is created:
The first thing that forms is the horizontal bar that appears on the left side.
Then a vertical line begins to form that will be in motion for the duration of the time interval that we have chosen. The upper end of the bar will be the maximum price, while the lower end will be the minimum price.
Finally, once the vertical bar is formed, a horizontal line will appear on its right side that will indicate the closing price of the bar.
Let's remember. Always, always, the opening price is on the left, regardless of whether it is above or below the horizontal line on the right.
If the horizontal bar on the left is below the horizontal line on the right, we will say that it is a bullish bar, since the price has closed above the one it opened.
On the contrary, if the bar on the left is above the bar on the right, we will say that it is a bearish bar, since the price closed below the opening price.
Let's better see an example of each one:
The left horizontal line informs us of the opening
The right horizontal bar informs us of the closure
Finally, comment that there are different types of bars and sizes. It is possible that the opening and closing prices are the same, or that the bar has no maximum or no minimum or, absence of both. What we have to be clear about is that it will always have a price that opens and another that closes the bar.
Here are some examples of bars for clarification.
1- Opening and closing at the same level without any movement occurring.
2- Opening and closing at highs
3- Minimum opening and closing
4- The closing coincides with the minimum
5- Opening at the maximum
5- Open coincides with the high and close coincides with the low
6- The open and close coincide, but the bar makes lows and highs
There are more types of bars, for example with the opening at the lows and the closing at the highs, among others.
Finally, although the bar chart provides us with all the price information, it has the disadvantage of not being so visual and can be confusing if we are not used to it.
Bar Features:
It is a unit of measure within different trading platforms. Considering it more or less the size of the predetermined time.
You are looking at a 1d period graph. The Bar will have the value of 1d. Period.
If you see it in graph 1min, the bar will have the value of 1min.
- Bars in 1d time.
- Bars in time 1min.
If we realize Bars does not have "Shadows" they are only lines which already includes the shadow within its line and its crossing to the next Bar would be the closing price.
This would be a way to see at which closing price for more accuracy. In any case, you are not interested in seeing the shadows and only visualizing the movements of the asset's value.
Keep in mind that this is a guide that I am developing from the most basic, until I advance to where I know, if you are interested, follow me.

Ethereum blueprintI noticed a W pattern was forming like before so i copied the price movement and extended it. Let just say it helped alot


$CASI KST Buy Signal CASI Pharmaceuticals, Inc., a biopharmaceutical company, develops and commercializes pharmaceutical products and various therapeutics in China, the United States, and internationally. The company's product pipeline includes EVOMELA, a melphalan hydrochloride for injection primarily for use as a high-dose conditioning treatment prior to hematopoietic progenitor cell transplantation in patients with multiple myeloma. Its product pipeline also comprise CNCT19, an autologous CD19 CAR-T investigative product for the treatment of patients with B-cell acute lymphoblastic leukemia (B-ALL) and B-cell non-Hodgkin lymphoma; CID-103, an anti-CD38 monoclonal antibody being for the treatment of patients with multiple myeloma; ZEVALIN, a CD20-directed radiotherapeutic antibody, to treat patients with NHL; and Thiotepa, a chemotherapeutic agent, which has multiple indications including use as a conditioning treatment for use prior to hematopoietic stem cell transplantation. In addition, the company offers MARQIBO, a microtubule inhibitor, approved by the FDA for the treatment of adult patients with Philadelphia chromosome-negative ALL; and Octreotide LAI formulations for the treatment of acromegaly and for the control of symptoms associated with various neuroendocrine tumours, as well as developing a portfolio of 25 FDA-approved abbreviated new drug applications. It has licensing agreements with Black Belt Therapeutics Limited; Juventas Cell Therapy Ltd.; Pharmathen Global BV; and Cleave Therapeutics, Inc. The company was formerly known as EntreMed, Inc. and changed its name to CASI Pharmaceuticals, Inc. in June 2014. CASI Pharmaceuticals, Inc. was founded in 1991 and is based in Rockville, Maryland.

