Mutant Bart Will Hit BTC with a retest and break of 3000$ soon. Are you ready?
There is literally no reason or usage for Bitcoin to be over valued.
Currently 30-40% miners already unplugged and today there is a 14-15% drop in difficulty in Bitcoin network.
insights.glassnode.com
Transactions dropped under 300k per day and continues to drop.
Activity is only between exchanges and very few whales. Otherwise BTC is a No Mans Town.
Bart
Using OBV Divergence To Detect Barts And Wyckoff DistributionBarts (AKA bull or bear traps) are a common pattern in cryptos. The OBV indicator can be useful for detecting Wyckoff style accumulation or distribution.
It's especially useful for Barts which have a very flat section of price action which makes the OBV divergence very apparent in some cases. If you see a flat zone that looks like a potential bart, track it on a couple different time frames and see if a divergence pops out, it might show which wyckoff mode it's in.
Bull TrapLast night our trade didnt really play out until a few minutes ago and looked like a bull rally, yet we just double top at 7398, which is interesting, yet retraced all the way back down to the 50ema on the hourly, which has held support and been resistance through out this market cycle. The question is now are we going to go lover?
Let's get our facts out of the way.
1. From 14k to now we been creating higher lows till are next leg down.
2. Macd as of this time is bearish
3. RSI is netrual, yet it is still up to grab so no help
4. we are in a new downward channel that was broken now, yet we fully retraced it.
5. OneCoin still has btc to sell
6. TradingView indicators are flipping bullish and bearish atm, which I would say we are in for a pretty massive move. Projected date is January 7th or could be before on the 6th.
7. Bitmain, one of the largest mining farms and distributors are laying off half of the employees. Could be a sell off in the near future to pay bills and cut project loses. I find this one interesting cause in the summer with he run up to 14k, they soldout of there new miners. Looks like insider stuff about to be bearish with Bitcoin and China due to the trade deal with USA which phase two is happen pretty soon.
8. One thing we need to keep in mind is even with the halving the stock market is having its time of its Life and with presidential candidates trying to win over Trump with the economy doing so great. It might not be good for bitcoin since Trump is againist anything that isnt the USD, so another 4 years of sideways movement could gloom over if he wins.
9. The halving should push for an upside in btc price, yet would this time be different? The problem with looking forward for a "written price increase" isn't smart financial logic if you don't read the space at its fullist. BTC trades like a forex currency with political news outside the space and between projects development. Price increase comes down to one thing, demand. I do believe the demand is there, yet sitting at over a 133bil mc is pretty crazy even in the stock market. So another 4 years of acculation very possible and buying under 7k is a great idea. Right now leverage trading at your own risk.
I still shoot for 5200 and after Sunny video a few days ago saying we been going sideways for 40days and the last we went sideways it was 70ish days. Only a month away, yet with the halving I see it sooner. Again stay safe and dont overleverage trade.
Bitcoin on the weirdest movementHey guys I’m back from the holidays and now bitcoin is on a weird projectile movement. Overall pretty bearish as of now it looks like a bart head and shoulders. Last night around 9pm Central weird volume came up and could have put a 50x long and made killer gains today.
The market atm looks overly bullish on holding the 6900, yet it’s pretty weak if we keep going back wouldn’t you agree? Longs have dropped as shorts are picking up atm, yet all the support lines you see have been getting hit going up and down. We can assume we are sideways channel till 5200
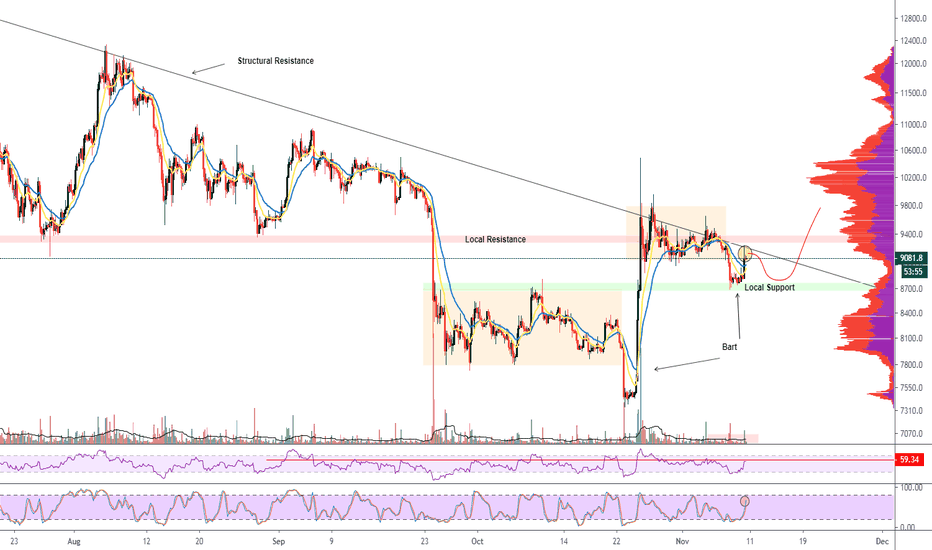
BTC Bart Fractal|Strong Resistance|Need Volume Follow Through!!Hello Traders,
Today’s update will be on Bitcoins recent developments, where a possible fractal is playing out with a confirmed Bart pattern. BTC is now trading at a very strong resistant point which can only be broken with strong bull volume.
Will bulls have enough in the tank to break resistance or is a retracement back to support more probable?
Points to consider,
- Trend confirmed Bart pattern
- Local Support Respected
- Local Resistance is in Confluence with Structural Resistance
- RSI Neutral
- Stochastics Projected upwards
- EMA yet to turn bullish
- Volume needs follow through
The recent trend in Bitcoin’s price has been following a fractal with a confirmed Bart from local support. BTC consolidated before an impulse move down, where bulls instantaneously showed up to move price right back in to resistance. The current level that is being tested needs to break for strong bullish momentum.
Local support was respected by Bitcoin, confirming the S/R flip. This signalled that buyers were strong, putting in a healthy retest of previous resistance. Local Resistance however is in confluence with the macro structural resistance. This is a very strong area that Bitcoin needs to break for continued bullish momentum. For this to come to fruition, we need strong follow through with bull volume, otherwise price will retrace back to local support.
RSI is currently testing resistance in neutral territory; it is not in overbought nor oversold at current given time. The Stochastics is projected upwards, we still have momentum stored to the upside if Bitcoin is capable of breaking the strong resistance.
The EMA’s are yet to turn completely bullish, the yellow EMA needs to cross the blue EMA to confirm bull momentum. Volume is very important right now for Bitcoin, we need an increase in bull volume, currently it is looking very weak.
Overall, In My Opinion, local support has been tested and respected, but we do have very strong resistance levels that need to break. Volume is very key right now, like I mentioned, it does look quite weak but it is too early to tell. A retest of local support again is quite probable at current given time before an impulse break of major resistance levels.
What are your thoughts on the recent developments of Bitcoin?
Please leave a like and comment,
And Remember,
“Opportunities come infrequently. When it rains gold put out a bucket not a thimble.” – Warren Buffet
Are we headed for another Super Bart? Or are we ready to launch?The way I see it, there are 3 possible scenarios.
1) (Orange line) BTC pulls back to the bottom of the green region of the pitchfork then dramatically moves higher with enough momentum to break out of the pitchfork and the green resistance line. This is what the moon boys dream about every night.
2) (Red Line) We are headed for a Super Bart. The 3k rally we had from 7.3k was another whale playing games again. Why do I say that? Take a look at the volume since November. It has dropped off significantly. The retail buyers are not in control and they are not buying. It is like someone has shot a model rocket into the air and it has gone up 3,000', reached its apogee and now is slowly descending. Unless it has a booster rocket to take it higher, it will come down. The fuel is spent. Expect it to hit the ground at 7.3k where it was launched from. This will complete the Super Bart formation. You know this has happened without even looking at the chart because you will hear the moon boys in the next room sobbing in their pillows. I expect the whale to push the price up to the near the top of the pitchfork before dropping it like a rock, to sucker in more retail buyers (bull trap).
3) (Blue Line) This is where it can get nasty. The whale uses the momentum of the fall from 9.2k and takes the price down to 6k or even lower. This is to shake out the bitcoin from the weak hands. It churns around here for the rest of the year in order to inflict as much mental anguish to the hodlr's as possible.
Summary:
Unless the price breaks out of the pitchfork, then forget about a breakout. Same goes for the green descending line that acts as resistance. Unless this happens, the moon boys might as well hibernate for the winter. Put an alarm on the green descending line to wake them up if something happens.
is XRP about to Bart its way UP? to recovery and beyondXrp had a nice trendline that lasted several weeks, but it get out of there and now is showing some signs of recovery;
could we see xrpbtc forming a bart way up to the 0.000038 and continue gaining more value?
with Swell just around the corner I think the answer is probably yes, we'll see
not financial advice, trade carefully
BTC - SHORT - DEVILISH BARTWe were hoping for the price to reach 8k7 or more, but atm looks like the local top, wouldn't be a bad idea to hedge here. 4h candle, just closed below a 3D level, but we believe a touch to the 4h resistance is possible.
Entry: 8233
TP 1: 8001
TP 2: 7461
SL: 8361
CryptoCue is not providing investment advice and is not taking subscribers’ personal circumstances into consideration when discussing investments. Investment involves a high degree of risk and should be considered only by persons who can afford to sustain a loss of their entire position.
CryptoCue is not registered, licensed or authorized to provide investment advice and is simply providing an opinion, which is given without any liability or reliance 1.71% whatsoever. The information contained here is not an offer or solicitation or recommendation or advice to buy, hold, or sell any security. CryptoCue makes no representation as to the completeness, accuracy or timeliness of the material provided and all information and opinions provided by CryptoCue are subject to change without notice and provided on a non-reliance basis and without acceptance of any liability or responsibility whatsoever or howsoever arising. You hereby irrevocably and unconditionally waive, release and discharge: (a) any and all accrued rights and/or benefits you may have against CryptoCue in respect of any opinion expressed or information conveyed by CryptoCue at any time; (b) any and all Claims you may have against CryptoCue arising out of any opinion expressed or information conveyed by CryptoCue at any time; (c) CryptoCue from all and any claims (whether actual or contingent and whether as an employee, office holder or in any other capacity whatsoever) including, without limitation, Claims you may have against CryptoCue arising out of any opinion expressed or information conveyed by CryptoCue at any time. ("Claims" shall include any action, proceeding, claim, demand, judgment or judgment sum of whatsoever nature or howsoever arising.) You hereby agree to indemnify and hold harmless CryptoCue in respect of any and all Losses paid, discharged, sustained or incurred by CryptoCue in the event of bringing any Claim against CryptoCue. (“Losses” shall include any and all liabilities, costs, expenses, damages, fines, impositions or losses (including but not limited to any direct, indirect or consequential losses, loss of profit, loss of earnings , loss of reputation and all interest, penalties and legal costs (calculated on a full indemnity basis) and all other reasonable professional costs and expenses and any associated value-added tax) of whatsoever nature and/or judgement sums (including interest thereon).)
The bear scenario should the pattern prove to be a diamond top.A big red candle has taken us well below the diamond pattern and just under the 4hr 50ma where it is currently retesting and finding resistance....if that resistance solidifies and continues to maintain resistance then we are most likely confirming the pattern as a diamond top in which case its breakdown target is 10628. This may only be the beginning of the downtrend if that were to occur because it could also trigger a bart from the 1 day bull flag with the incredibly long pole which would give us a bart target all the way down at 8968. If this were to happen it would invalidate our adam and eve double bottom chances and potentially allow our double top to still trigger which could lead to yet even more downside so let's hope it doesn't. I think If we were to revisit 8968 we will be very very likely to fill the 8.5k and possibly the 7.2k gaps and then se a huge influx of buyers launch the price back up before it has a chance to trigger the double bottom bu of course we will have to wait and see if we even reach that low first and then how price action behaves once we do. there's still a chance this can be yet another bear trap and the price action could still bounce back up at the last second and break above the diamond/symmetrical triangle pattern but for now as long as the 4hr 50ma is maintaining resistance probability now favors at least a diamond top breakdown. Let's hope that changes but are fully prepared for if it doesn't.
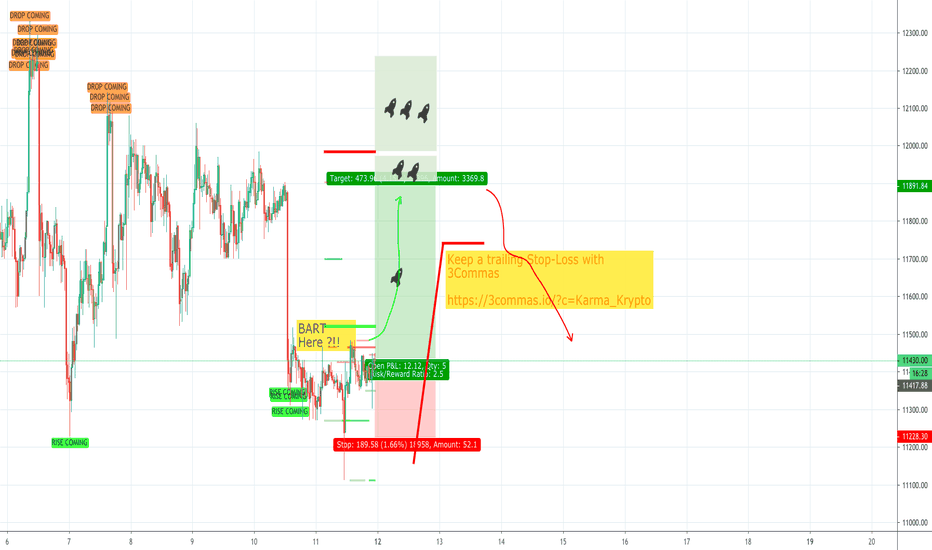
Bart Eyeing Bitcoin Heading to 11400We've got an unimpressed bart pattern. He's eyeing our current price sandwiched between the two violet S&R bars; we'll likely be sticking around this area for a bit then heading down to test 11400 (noting the low volume). Currently shorting from 11775 after closing long from 11680.
Alternative route indicated above the upper resistance is indicated by the smaller arrows.
Week-end possibility, read description.Not very keen of this price action, I would typically wait for the week-end close / Monday open before forming any directional bias.
That said, from a ranging standpoint, a break and close above 9470$ would open the door for scalp-longs towards 9800$ with a stop below Sunday low.
Tiny size if I ever trigger, will probably half risk it considering I would typically sit this out.
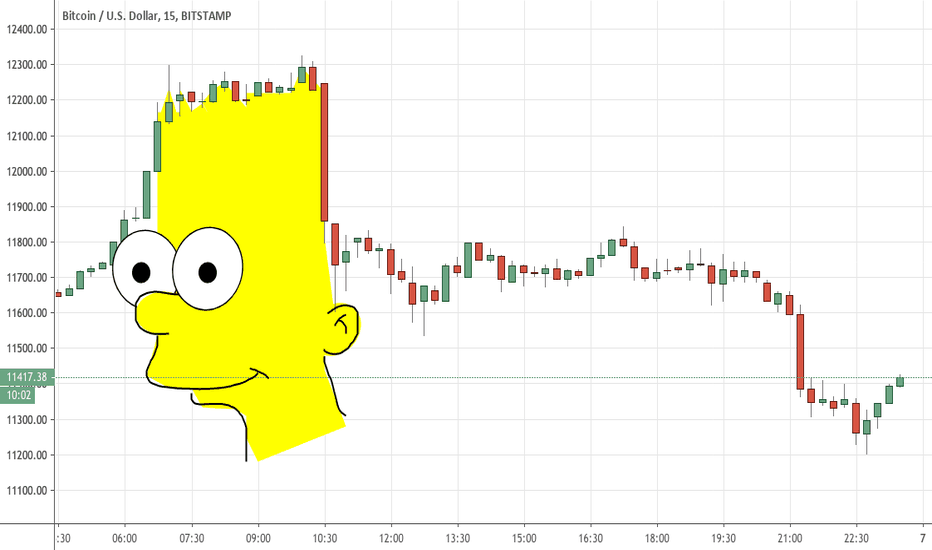
We have been trolled by yet another Bart Simpson pattern!We have been trolled by a textbook Bart Simpson pattern! What does this mean for bitcoin? Will we go up now for a double whammy back to back bart-man trolling pattern? will we fall back down to 9k again now?
I have no idea, i just wanted to draw a bart face on tradingview.. But you write down what you think is going to happen in the comments below!
Also did i do a good bart?
The "Bart" pattern in crypto-- Eating Shorts!!Last year, Bitcoin whales relying on technical analysis added a new weapon to their trading arsenal. This weapon is a chart pattern, known on social media as simply Bart.
It all started after the big boom of 2017 when Bitcoin showed its first signs of weakness. The price collapsed and so did the liquidity on all cryptocurrency exchanges. The bull market was over.
As a result, whales and exchanges alike had to come up with a different way to make money and survive. What followed next can be seen clearly on the Bitcoin (BTC) price chart.
At first glance, it looks like a regular pump-and-dump scheme — and, to some degree, it is exactly that. Cryptocurrency critics gave the pattern a catchy name, turning it into a meme on all social media: Bart.
www.google.com
Bart Incoming for BitcoinSo since we have this continual cycle of pump, consolidate, pump, consolidate; then dump, consolidate: I am expecting a Bart down. It could however go up instead. I am 100% sure though that we WILL see a massive candle very soon. If you want to short/long then flip a coin and put a tight stop loss.
The reason I am expecting a Bart down is because this (according to my previous TA) could be the final leg down to the support at the low 3000s before we see good upwards movement. If we look at the 2014 bull run then we see that there is a possibility of a bart up before continual barting to the support. We see what happens soon I guess.
Neutral position: waiting for btc to hit support before I buy more.
* "The Simpsons" Theme starts...*The more this price action unravels, the more this scenario looks somewhat coherent with what we're used to in the crypto-sphere.
Of course there's nothing technical in this, just a nice-looking drawing. Enjoy, 'guys
My only advice would be to stop using leverages altogether for a while. We never know. One thing's sure, next move will be... unsettling


