Waiting for ConfirmationIf you're seeking shorting opportunities on EURUSD, I've got two potential setups for you.
Remember, always wait for candlestick pattern confirmation before making your move.
Bearish Shark Pattern: Look out for completion at 1.0917.
Bearish Bat Pattern: This setup is more intriguing to me, as the Potential Reversal Zone (PRZ) aligns with the bearish trendline.
Be patient and let the market confirm the patterns. Share your thoughts and trade plans on EURUSD below!
Bat


Potential Long Opportunity GJ BAT Think I spotted a bat on Daily time frame also see higher highs and lows being printed. Still growing my craft so critique is welcome.
Here is my bat:
X @ 180.742
A & C @ 188.261 ( c leg retraced to 100%)
D @ 181.611 ( I shorted from C to D leg)
TP's are based on Fib then adjusted to the quarter points:
-184.000
-185.750
-186.750
-188.000
Let me know what you think. Thanks, Happy Trading!!

BAT/USDT Possibility it could back to retest the strong resist!!💎 BAT's recent market performance has been impressive. After a strong bounce from its support area, there's a real possibility it could continue its upward trajectory and retest the strong resistance area, potentially breaking through it.
However, should BAT struggle to ascend soon, it might retreat back to its support area, necessitating a new buildup of momentum. If BAT returns to this support zone, maintaining its level will be crucial. A failure to hold above the support could lead to a downturn, sending BAT towards the critical demand area of $0.196.
This demand zone is pivotal for BAT's market trajectory. A breach below this level could signify a shift to a bearish trend, leading to further declines. On the other hand, if BAT manages to hold within this area and demonstrates a strong recovery or bounce, it will need to reclaim its position above the support level to resume its upward movement.

Prosper (PROS) about to complete a setup for upto 32.50% pumpHi dear friends, hope you are well and welcome to the new trade setup of Prosper (PROS) with US Dollar pair.
Recently we more than 115% pump of PROS as below:
Now on a 2-hr time frame, PROS has almost formed a bullish BAT move for the next price reversal.
Note: Above idea is for educational purpose only. It is advised to diversify and strictly follow the stop loss, and don't get stuck with trade.

Multi-Pattern Analysis - A Comprehensive ViewMonths ago, I shared insights into the impending Bearish Fib-3 Bat Pattern on the weekly chart, offering substantial profit potential (over 10,000 USD/lot). Check the detailed analysis within the TradingView post.
Presently, my attention is drawn to a potential Head and Shoulders formation, indicating a shorting opportunity of more than 1,000 pips on the weekly chart.
However, for those seeking a buying opportunity, observe the Bullish Shark Pattern completing at 143.71.
My stance: Bearish in the short-term, Bullish for the long-term.
Share your thoughts and trade plans below!

Exploring OpportunitiesGiven the current consolidation phase in the market, I'm open to exploring various trading opportunities this week.
For counter-trend traders eyeing a shorting opportunity, the completion of a Bearish Bat Pattern at 1.2803 is a crucial level to watch.
Alternatively, for those in search of a buying opportunity, a retest on the trendline, conveniently aligned with the 1-hourly chart, could provide an entry point.
What's your strategy for GBPUSD? Share your insights!

VBTYZVBTYZ create postive BAT Harmonic patern
Buy area : 108 ~ 115
T1 : 123 (1.HEDEF)
T2 : 128.8 (2.HEDEF)
STOP LOSS : close below < 108
THIS IS NOT A RECOMMENDATION IT'S JUST MY VISION ABOUT THE STOCK
GOOD LUCK

Bullish breakoutWe've broken from consolidation highs with HTF confirmation. As there isn't much room to the upside before the next key structure and a 4H bat pattern completion, I would like to see a deep retracement before continuing higher.

Marathon Oil Corporation: Bullish Bat with Bullish DivergenceMRO on the intraday is showing signs of Bullish Divergence on both the MACD and RSI at the potential HOP level of a Bullish Bat. If this plays out I think it could make a move up towards $25

MATICUSDTMATICUSDT follow Bullish Bat Pattern indicate that it moves upward
SL , TP mention in chart
Analysis at 4 hour


BAT/USDT Preparing for a Bull Run? 👀🚀BAT Analysis 💎 Paradisers, prepare for an exciting phase in #BAT's market evolution, signaling a potential bullish rise from its current demand zone.
💎 After encountering resistance at a significant supply zone at $0.264, BasicAttentionToken has notably moved through buy-side liquidity. This development may lead to a short-term dip before embarking on a bullish resurgence from the key demand zone at $0.195.
💎If BAT builds sufficient bullish strength at this point, we could see an assertive move towards, and potentially breaking through, the established supply zone above.
💎 Given the dynamic and ever-changing nature of the crypto market, a versatile and proactive strategy is crucial. If #BAT meets resistance in securing its position within this important support zone, a swift and strategic shift might be necessary for success.
💎 In this event, we would activate our alternate strategy: aiming for a bullish movement from a lower demand level at $0.166. This level becomes critical, as breaking below it could signal the onset of a bearish trend in #BAT's market journey.

Bullish Outlook with Retest OpportunityIf you caught the short opportunity on the previous Fib3 Bat I mentioned months ago, congrats on the 836 pips (~8,360 USD/lot) gain! (Link to related analysis available in post)
My overall stance on USDJPY remains bullish. For those eyeing buying opportunities, keep an eye on the daily chart for a potential market retest at 142.47 (refer to the left chart).
What's your strategy or trade plan for USDJPY? Share your thoughts below!

Potential Short Opportunity on Bearish PatternsDespite GBPUSD demonstrating a Weaker Bull Trading setup, my analysis suggests a more bullish outlook compared to EURUSD.
However, I'm currently eyeing a shorting opportunity on a lower timeframe. The emergence of a Bearish Gartley Pattern retesting at 1.2752 or a completion of a Bearish Bat Pattern around 1.2803 appears promising for a potential short position.
What are your thoughts or trade plans for GBPUSD?
Share your insights below!

HarmonicsHarmonic Bat Pattern
Harmonic ButterFly Pattern
Harmonic Crab Pattern
Shark & 5-0 Pattern
www.geocities.ws

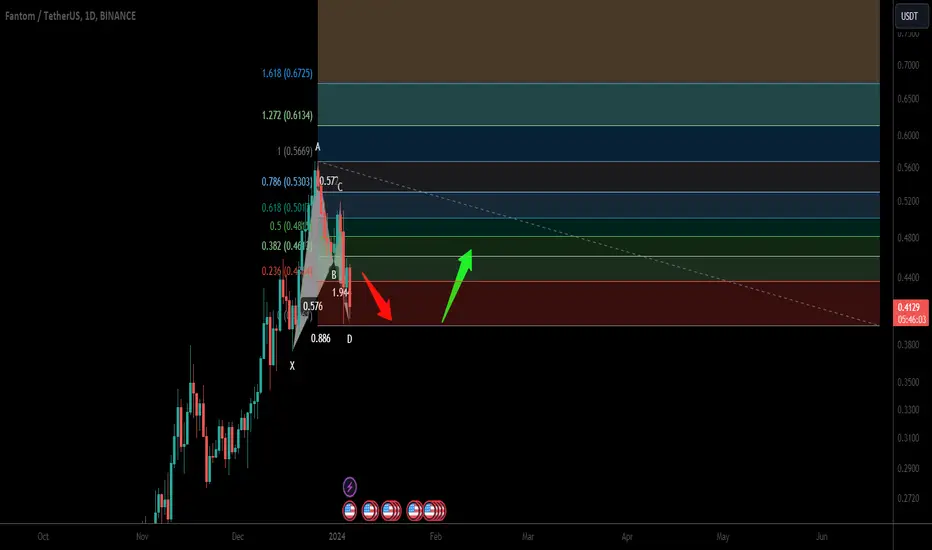
Trade signal | Fantom (FTM) a setup for upto 41.50% rallyHi dear friends, hope you are well and welcome to the new trade setup of the Fantom (FTM) coin with US Dollar pair.
Previously we caught almost 100% pump of FTM as below:
Now on a daily time frame, FTM has almost completed a bullish BAT move for the next pump.
Note: Above idea is for educational purpose only. It is advised to diversify and strictly follow the stop loss, and don't get stuck with trade.
Walgreens: Quarterly Bullish Piercing Line at PCZ of Bullish BatThere is a Bullish Piercing Line at the PCZ of a Bullish Bat that is visible on the Quarterly time frame. We also have MACD and RSI Bullish Divergence to go along with it as well as Increasing Volume. This could be the start of something big for the price action and I speculate that shares of Walgreens could rise up to around $58 over the coming months.

BATUSDT Signals Bullish PhaseBATUSDT's recent breakout above the downtrend trendline and respect for the demand zone affirm its ongoing bullish phase.
With Basic Attention Token currently trading near the downtrend trendline, which could act as support, we anticipate a potential continuation of the uptrend.
A target at the 261.8% Fibonacci resistance level suggests the potential for a substantial 60% rise from the current demand zone.

CHFHKD Bearish Bat Within Bullish ChannelCHFHKD have displayed Bearish Bat Within Bullish Channel, which completed Type 1.
It is best to short as price and HSI as expected to going down.

BakeryToken (BAKE) completed a setup for upto 46.50% pumpHi dear friends, hope you are well and welcome to the new trade setup of BakeryToken (BAKE) with US Dollar pair.
Recently we caught almost 316% massive pump as below:
Now on a 4-hr time frame, BAKE has formed a bullish BAT move for the next price reversal.
Note: Above idea is for educational purpose only. It is advised to diversify and strictly follow the stop loss, and don't get stuck with trade.

Analysis of NEOGEN (NEOGEN Corporation)Support at Rising Trendline:
The daily chart indicates that NEOGEN has found support at a rising trendline. This is a positive signal, suggesting that buyers are stepping in at this level.
RSI Support and Positive Divergence:
The Relative Strength Index (RSI) is showing good support. Positive divergence in RSI implies that, while the stock price is making new lows, the RSI is not, suggesting potential upward strength.
Harmonic Bat Pattern:
The identification of a Harmonic Bat Pattern adds a technical aspect to the analysis. Harmonic patterns are used by traders to identify potential trend reversals.
Proposed Trade Strategy:
Entry: Consider entering a long position at the current market price (CMP) of 1500, given the support at the rising trendline, positive RSI indications, and the presence of a Harmonic Bat Pattern.
Stop Loss (SL): Implement a stop loss at 1480 to manage risk and protect against unexpected price fluctuations.
Target: Set a target at 1553, aiming for a potential price increase based on the identified technical factors.
Conclusion:
The technical analysis suggests a bullish outlook for NEOGEN, with the stock finding support at the rising trendline, positive RSI signals, and the presence of a Harmonic Bat Pattern. However, it's crucial to conduct further research, consider overall market conditions, and apply risk management strategies before making any trading decisions.
Please note that trading involves risks, and it's advisable to seek advice from a financial advisor or do further analysis based on your risk tolerance and investment goals.
