BAT - The FRACTAL No One Talks About💥Hi Traders, Investors and Speculators of the Charts 📈📉
For the longer term, Basic Attention Token BATUSDT is another altcoin I am extremely bullish on - and it's currently trading in an ideal accumulation zone ! What I expect for BAT is similar to a scenario that played out in November 2020 - April 2021. Notice that this occurs over a longer period, where the price of BAT went from $0.16c parabolic to $1.64 at its highest point. Therefore, the price must first fall lower towards the bottom of the support zone where there is a large demand zone . In other words, DOWN first, then UP.
And remember.. Don't be a Bob-Trader:
The continues market cycle between Bitcoin and altcoins can clearly be seen at the moment. It goes something like this:
🤩 Bitcoin goes UP ... Bob Fomo buys the rally
🤔 Bitcoin corrects ... Bob panics and sells
🤑 Altcoin rallies ... Bob thinks, screw BTC , I'm going all in on this altcoin
😨 Altcoins correct ... Bob panics. Altcoins are scams! Sells everything
🤩 Bitcoin goes up .... Bob Fomo buys the rally
Moral of the story...Don't be like Bob. Don't try to FOMO in whilst the price is going up. Plan your trade, preset your TP and SL.
While you're here 👀 Check out this idea on Bitcoin:
_______________________
📢Follow us here on TradingView for daily updates and trade ideas on crypto , stocks and commodities 💎Hit like & Follow 👍
We thank you for your support !
CryptoCheck
Bat

Contradictory Patterns & Potential Buy SetupIt seems that the USDJPY is presenting challenges in trading decisions.
Despite the presence of a valid bearish fib-3 bat pattern, your interest lies in seeking a buying opportunity, expected to materialize potentially by Tuesday based on further market development.
You've also noted the invalidation of a Bullish Gartley Pattern on the 1-hourly chart, cautioning against trading this setup without proper understanding, suggesting seeking guidance if unclear.
What trade plan or strategy are you considering for USDJPY? Feel free to share your insights or plans below!

TLT: Bearish Bat with Bearish DivergenceThere is a Bearish Bat with Bearish Divergence on the TLT, which could perhaps be signaling that the 20-year Bond Auction is going to demand higher yield than the current level.

AMZN Daily Bat Pattern AMZN has a completed bearish bat pattern that has gone to Target 1 and has come back to entry to form a TYPE 2 entry. We are at a daily level or resistance.
I won't be looking for any positions until price closes below the 141.51 level.

Balancing Bullish Trends and Counter-Trend PossibilitiesGBPAUD seems to be in a Bullish Trend, and you're focusing on potential buying opportunities. Here are three strategies you're considering:
Type2 Bullish Fib-3 Bat (1-hourly chart) : This setup aligns within the support level of the 4-hourly chart at 1.9053, providing an initial buying opportunity.
Bullish Deep Gartley Pattern (4-hourly chart) : Should the market decline further, your plan includes waiting for the completion of the Bullish Deep Gartley Pattern at 1.8948 on the 4-hourly chart, presenting another potential buying opportunity.
GBPAUD appears to offer multiple setups for potential long positions based on your analysis.
What are your thoughts on GBPAUD, and what trade plans or strategies are you considering for this pair?
Feel free to share your insights or plans below!

USDJPY: 3 Line Strike at the PCZ of a Bearish BatSimilarly to around the same time last year when USDJPY was at these levels, it had developed a 3 Line Strike at the PCZ of a Bearish Harmonic, and if it goes like last year, this will result in at least a few months of downside on this pairing.
There is also some Bearish Divergence formed on the RSI at this level.
Additionally, there is a much bigger Macro Bearish Butterfly setup that can be seen here:

Can $BAT Do It This TIme?BAT looking good for a long. Weekly Timeframe so higher than usual SL & the Targets are very juicy!

Trade signal | Harmony (ONE) coin is ready for upto 19.50% pumpHi dear friends, hope you are well and welcome to the new trade setup of Harmony (ONE) coin with US Dollar pair.
Previously we caught more than 80% pump of ONE as below:
Now on a 4-hr time frame, ONE has completed a bullish BAT setup for the next price reversal.
Note: Above idea is for educational purpose only. It is advised to diversify and strictly follow the stop loss, and don't get stuck with trade.

USOILUSOIL Seems to have a harmonic pattern on the daily timeframe. We can also see we have a developing divergence with the RVI struggling to make a new low despite oil price falling rapidly. 81.64 Seems most probable in this circumstance.

Exclusive Insights Inside!Last week, I issued a warning: "it's not a good idea to short the USDJPY!" Despite months of anticipation, the bull run on USD is not yet complete. If you're still waiting for a shorting opportunity, keep an eye on the 4-hourly chart for the development of the bearish shark pattern—a potential entry point for this counter-trend trade.
Now, let's discuss trade plans and your thoughts on the USD trend. What's your approach to USDJPY, and where do you see the US Dollar heading? Share your insights below!

Dive into GBPUSD Trading InsightsGBPUSD currently exhibits a Weaker Bullish Trend on the weekly chart, introducing interesting dynamics.
On the 1-hourly chart, a bearish shark pattern emerges, presenting a counter-trend trading setup. Simultaneously, the 4-hourly chart showcases a bullish bat pattern within the buy zone.
My preference in this scenario is clear—I favor the bullish bat pattern on the 4-hourly chart.
Now, I'm curious about your preference. What's your take on these setups? Feel free to share your insights below!

Money Making Opportunities in EURUSDEURUSD is currently navigating a weaker bullish trend on the weekly chart, adding an interesting layer to the market dynamics.
On the daily chart, a bearish flag pattern setup unfolds, creating an intriguing scenario. Furthermore, the 1-hourly chart reveals a bullish bat pattern, while the 4-hourly chart showcases a bearish bat pattern.
In the week ahead, I'm poised to engage in whichever trading setup comes to fruition first.
Now, I'm keen to hear about your trade plan. Do you carry any trend biases, and if so, what factors influence them? Your insights matter—please share them below!

Aggressive Counter-Trend PlayI've identified a Bat Pattern retest on the NZDJPY, representing a counter-trend trading setup. This trade is categorized as a combo trade due to the presence of a bearish shark pattern retest on the weekly chart.
In this instance, I've opted for an aggressive approach , meaning I'm engaging in the trade before waiting for candlestick confirmation.
The profit potential for my final target is quite remarkable.
A gentle reminder: Never follow any trade blindly and refrain from overtrading, regardless of your confidence in this trade or in me.
Wishing you successful trading!

2 patterns converge in the same regionIn this trade, I'm taking a counter-trend approach, spiced up with a touch of adventure on my second target.
The convergence of the Fib-3 Bat Pattern with the Deep Gartley Pattern setup is a remarkable alignment. The addition of RSI Divergence serves as the icing on the cake.
Once the market reaches my first target, I'll be making the prudent move of shifting my stops to entry, securing the gains made thus far.
May the market be in our favour!

Is Tesla Bat Ready To Fly Into Space Like SpaceX?the detail is shown in the above Chart.
I made this Idea based on Candlestick Analysis and Fibonacci Tool.
TSLA sellers were able to break the support line for buyers at the 0.618 gold level.
Therefore
we can expect that TSLA buyers are ready in level 1.27 and 1.618
and buyers at the level 195 $ were able to rise TSLA price to around level 0.786 (225 $)
and now two scenarios are on the way
TSLA price will fall again and buyers will be ready with stronger power .
TSLA price will fall to the next golden level ($168) and TSLA bat will help the
buyers to fly to the sky like spacex .
a Bullish BAT Pattern Will Start at 168.

Potential Bullish and Bearish SetupsThis week, GBPAUD introduces an element of confusion into the FX market.
On the Daily Chart, two opposing trading setups vie for attention. There's the Bearish Flag Pattern, offering a shorting opportunity, yet simultaneously, a Type2 Bullish Fib3 Bat Pattern emerges. With the right filter, one can discern which trading setup is likely to be the more profitable choice.
For those inclined towards a shorting opportunity, the Bearish Bat Pattern on the 1-hourly chart presents a viable trading opportunity.
Now, it's decision time. What's your pick? Your insights matter. Please share your perspective below!

Potential Bearish Setup on Weekly ChartThe Bearish Fib-3 Bat formation on the Weekly chart certainly catches the eye, particularly with the presence of a long-shadow candle.
However, it's important to acknowledge that the trading setup remains unconfirmed. Waiting for confirmation may entail missing out on potential profits, to the tune of 200 pips.
Here are some strategic considerations:
Option 1: Shorting Opportunity from Lower Timeframes
One approach is to anticipate a shorting opportunity on lower timeframes, thus potentially capitalizing on a downside move without waiting for full confirmation.
Option 2: Trading Within the Range (1-hourly Chart)
Both sellers and buyers find opportunities within the 2 zone. This entails engaging with the Resistance at 150.49 and the Support level at 149.00.
The pivotal question arises: What's your trade plan? Your insights matter. Please share your perspective below!

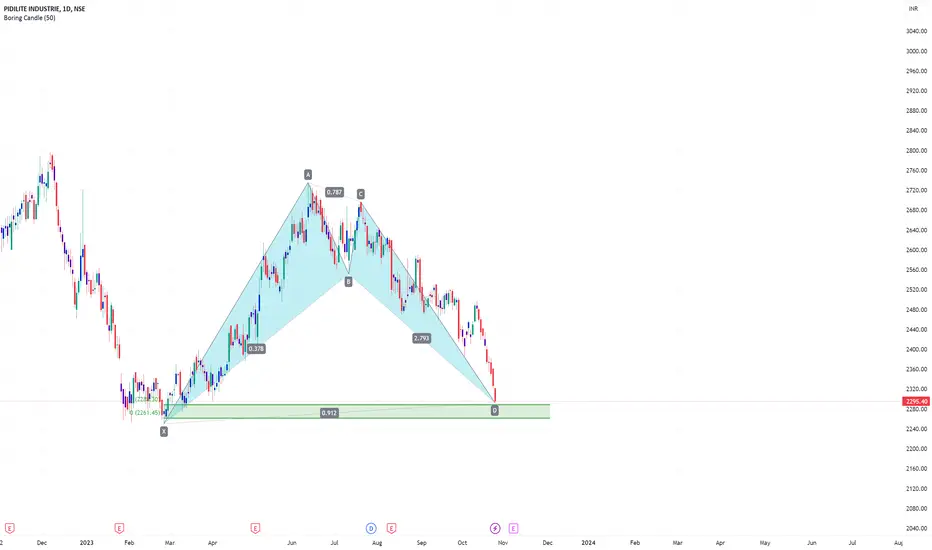
Pidilite industriesHarmonic bat pattern in 1DTF
=> Price hits reversal zone
=> Price near weekly demand zone
USDJPY Weekly Short Trade:USDJPY Weekly Short Trade:
Bearish Bat completed
US 10 yr Yiled Reversed
NFP data is bad
Bearish Pin bar Formed
Therefore, Short USDJPY
TP1: 142.10
TP2: 136.40
TP3: 129.76
TP4: 116 (Long Term Target)
Cheers

GOLD 🪙) traget ▶️✔️hello traders what do you think about this analysis gold 🪙🥇
support Levi's??
resistance Levi's??
👇👇👇🚨
Gold price enjoyed a good two-way price movement on Wednesday, advancing toward the $2,000 mark ahead of the Fed policy announcements, as the US Dollar stalled its recovery mode amid sluggish US Treasury bond yields and a mixed market mood. However, Gold price changed course and tested the $1,970 round figure, in a knee-jerk reaction to the Fed’s policy inaction, as widely expected. The US Federal Reserve left the key policy rate unchanged in its current 5.25%-5.50% range.
It was Fed Chair Jerome Powell’s press conference and his response to the questions that smashed the US Dollar alongside the US Treasury bond yields, triggering an impressive comeback in Gold price. Although Powell did not rule out another hike, markets perceived his words as not quite as hawkish as they expected. He acknowledged tighter financial conditions, a strong labor market, a resilient economy and an elevated inflation level.
The sell-off in the US Treasury bond yields was also in part due to a quarterly Treasury announcement that said the government will slow increases in the size of its longer-dated auctions. The auction of 10-year Treasuries was increased by $2 billion, below the market's expectations of $3 billion. The benchmark 10-year Treasury bond yield tumbled over 20 basis points (bps) to 4.7089%, the lowest in more than two weeks.
support pales my analysis 🤑
FXOPEN:XAUUSD

RIL - Bat pattern is in makingRIL is the process of BAT formation.
Above 2495, a bull will take a control
and Below 2440, bear is going to take a control.
And if bears take a control we can see the stock correcting to almost 2330 levels (a 4.5 % correction) till Mid October'23.
Do keep a watch on important levels of the stock


Technical Analysis & Trading StrategiesIn the upcoming week, the spotlight might be on NZDJPY, particularly for those who lean towards structure-based trading methods.
In this scenario, we marry technical analysis with the art of trading.
Observations:
A keen eye at the support level reveals an ABCD pattern checkback on the 4-hourly chart, situated at 86.84.
For Fib-3 Bat enthusiasts, a buying opportunity may materialize on the 1-hourly chart.
Now, the pivotal question: What would be your approach to NZDJPY? Your insights matter. Please share your perspective below!
