Merit Circle (MC) formed a bullish BAT for upto 35% pumpHi dear friends, hope you are well and welcome to the new update on Metal (MTL) token with US Dollar pair.
Recently we caught almost 57% pump of MC as below
On a 4-hr time frame, MC has formed a bullish BAT move for the next price reversal.
Note: Above idea is for educational purpose only. It is advised to diversify and strictly follow the stop loss, and don't get stuck with trade.
Bat

AUD/USD long positionwe can see a nice harmonic pattern here that will make a nice 0.67.05 target in a long term, we can see in our target the MA200 and the MA100 at that lvl

NZDJPY VS NZDUSD📈💹 Expert Level Trade Ideas: New Zealand Yen and New Zealand Dollar!
🇳🇿🇯🇵 On New Zealand Yen, we have an overall uptrend movement. Daily chart shows a bit of pullback. Four-hour chart indicates increased volatility with new lows and highs. One-hour chart has a retest of previous support level with a bit of RSI divergence.
🔍 Trading Strategy: Hidden trading opportunities within this chart can be spotted if you know the trading rules. Scan the QR code to learn more and share your findings in our traders cafe.
📈 Weekly Chart: Bearish shark pattern already in play, running at 188 pips. Buying opportunity at 5-0 pattern, 84.36 level.
📊 Daily Chart: Bullish bat pattern presents a buying opportunity at 84.25 completion zone.
📉 Four-Hour Chart: Use the staircase trading strategy. Wait for a pullback at 86.91 for a short or a breakout trade below 86.38 to chase the bearish movement. First target at 85.36.
⏰ One-Hour Chart: Similar situation, no need to repeat.
💼 Love Planning Your Trades? Set rules, look for conditions, and spend 15 minutes a day on your market analysis. Drop me a DM if you want to trade smart and efficiently.
#ExpertTradeIdeas #NewZealandYen #NewZealandDollar #Uptrend #BullishOpportunity #BearishSharkPattern #StaircaseTrading #BuyingOpportunity #SetRules #TradeSmart #DMForDetails

AMZN: Bearish Bat: Anticpating Potential PPO ConfirmationAmazon has gapped up to complete an 88.6% retrace thus completing the BAMM. Now we can see that the PPO is trading outside the upper bounds, and once the PPO comes back down below the upper bounds, it will confirm a Bearish PPO signal at the PCZ of this Bearish Bat, therefore confirming the Bearish Entry. I think it will target $81 from there on, but it could go lower if it ends up being a continuation of a much more bearish ABCD Pattern from years ago.
I think this rally was stirred on by the positive earnings release, but failed to realize how unprepared the guidance was during the actual call, as they hardly provided any guidance for Q3 all they could provide was their hopes but not much beyond that.

EURUSD - Breaking Down Buying Opportunities for the Week AheadHere's a look at the FX:EURUSD & the potential buying opportunities that I have on my radar for the week ahead.
More specifically what I'm looking at is a potential Bat Pattern with multiple points of confluence that can be used as a strictly in & out type of countertrend trade or an entry into a longer-term continuation setup depending on your big picture view.
As always if you have any questions, comments or just want to share you views on the EURUSD please leave them below & please remember to hit that ROCKET SHIP button before you leave to show me some love.
Akil


STP (STPT) formed bullish BAT move for the next pumpHi dear friends, hope you are well and welcome to the new trade setup of STP (STPT) with US Dollar pair
Previously we caught almost 29% pump of STPT as below:
Now on 2-hr frame, STPT has formed a bullish BAT move for the next price reversal.
Note: Above idea is for educational purpose only. It is advised to diversify and strictly follow the stop loss, and don't get stuck with trade.

Time to Plan Your Currency Exchange!If you're planning a trip to Australia in the next few months, consider changing some Aussie dollars now. For counter-trend traders, it's a great opportunity to look for a buying opportunity in the AUD. Let's analyze the charts!
📊 The market hit resistance and is now in consolidation, making it a concern for buyers. The daily chart shows an M Formation, with the 0.6600 level as a critical watch. It's likely to be violated before any potential reversal. On the four-hour chart, wait for a buying opportunity with magic candle confirmation.
⏰ On the four-hour chart, a bullish bat pattern has already completed, signaling a potential shorting opportunity. Set alerts and observe the Monday market opening for further confirmation.
📈 The setup is clear and objective, leaving no room for subjectivity. Engage your trade with defined stops and targets in mind.
💡 Trade smarter and save time! Spend just 15 mins a day on market analysis, setting alerts, and enjoying life. DM me to learn how.
💹 Follow my only account @raynlim for insightful analysis and updates. Let's trade with confidence! 📈🇦🇺

Bounce Token (AUCTION) formed bullish BAT for upto 27.50% pumpHi dear friends, hope you are well and welcome to the new update on Bounce Token (AUCTION) with US Dollar pair.
Recently we caught almost 300% pump of AUCTION as below:
Now on 2-hr frame, AUCTION has formed a bullish BAT move for the next price reversal.
Note: Above idea is for educational purpose only. It is advised to diversify and strictly follow the stop loss, and don't get stuck with trade.

Dollar Yen: Riding the Bullish Wave!📊 On the weekly chart, a strong W formation with a long tail signals potential upward movement. Daily chart shows another bullish W formation, indicating a powerful uptrend. Four-hour chart proves the market's strength after breaking support. Trend traders wait for confirmation above 141.96.
🎯 Weekly Bearish Bat Pattern at 149.45 presents a trading opportunity. Daily Gartley Pattern at X 133.60 offers buying potential for trend traders. Counter-trend traders eye a shorting opportunity at 149.18 on the rise. Four-hour Bearish Gartley Pattern at 143.06 sets the stage for another trade.
⏱️ Spend just 15 mins a day to spot money-making trades! Join our community to master trend identification. 💪💰
📉 Consider the resistance level at 141.25 or wait for a pullback to 139.91 for a buying opportunity on the one-hour chart.
💡 Follow my only account @raynlim for more insightful trade ideas and updates. 📈💡

📈 Master the Bullish Trend: Earn Income with Effective Trading 📈 The Euro dollar has shifted from a bearish to a bullish trend. On the weekly chart, we can see a violation of the previous resistance, indicating the overall trend is now bullish. However, this doesn't mean you can't consider shorting opportunities, just be more conservative with your targets.
🔍 Moving to the daily chart, the bullish trend is evident, and the RSI near the bottom signals a potential buying opportunity soon as the market is oversold. On the 4-hour chart, those trained in reading patterns might spot some opportunities right away.
💡 Pause the recording and share your findings, entry price, and trading strategy in the comments to learn and grow together. If you're not confident in spotting trends, join our community through the QR code to interact with like-minded individuals and learn how to trade.
💼 My analysis: On the weekly chart, while we're in a bullish trend, the resistance level at 1.1232 suggests both buying and selling opportunities. For a shorting opportunity, I'll wait for a counter trend or confirmation pattern at that level.
📅 On the daily chart, you can look for simple candlestick confirmation to buy at the current level (1.0974). On the 4-hour chart, a secure buying opportunity awaits with candlestick confirmation on the D price completion of the bullish bat pattern. The first target will be conservative, and I'll shift my stops to entry for a risk-free trade.
⏱️ If you'd like to spend just 15 minutes a day and generate additional income, DM me for more information. Let's make trading work for you! 💰🚀 #TradingStrategy #BullishTrend #ShortingOpportunity #JoinOurCommunity #DMMeForInfo
Follow me on my only account @raynlim for more trading insights and updates! 📊📈

GOOGL expected correction and buying areaEven after its earning call Alphabet seems to be having a hard time it pumping. I expect it might have one more push above todays price then it might correct and will be a buying opportunity once it reaches the red box.

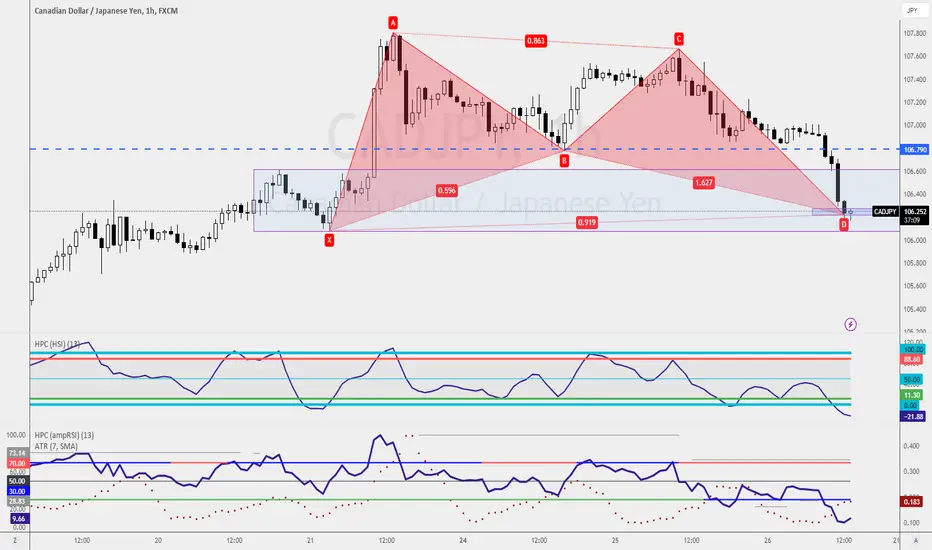
Bullish Bat Pattern within Buy Zone📈 CADJPY Bullish Bat Pattern 📈
Exciting opportunity on CADJPY! 🦅 A Bullish Bat Pattern is forming within the buy zone. 📊 Conservative traders target 106.79, while adventurous traders set their own targets. Remember to manage risk and stay informed. Follow @raynlim for more trading insights. Happy trading! 🚀
🐻📉 AUDUSD Alert! Bearish Bat Pattern Signals Sharp Correction 🚨 Attention traders! We have an exciting bearish setup on AUDUSD that you don't want to miss. Our previous bullish setup on AUDUSD was a resounding success, allowing us to secure profitable gains. Now, it's time to switch gears and capitalize on a new opportunity as the tide turns bearish. 📉🦅 The formation of a bearish bat pattern, coupled with two strong confirmations, suggests a sharp correction is on the horizon.
The bearish bat pattern has emerged, indicating a trend reversal. This harmonic pattern is known for its high success rate and presents an excellent opportunity to capitalize on the downward movement.
confirmation n°1 : Adding to the bearish thesis, the last candlestick has formed a rejection pattern precisely at the resistance level, highlighting significant selling pressure in this area. This optimal entry point allows us to ride the anticipated sharp correction.
confirmation n°2 : Furthermore, the RSI indicator is currently in the overbought zone, signaling a potential shift in momentum. This further supports the bearish setup and increases the probability of a downward move.
To take advantage of this setup, I recommend entering a short position around 0.68775. Our first take profit level is set at 0.67900, which coincides with a liquidity pool where potential support could be found. Our target stands at 0.67000, representing a significant downside potential.
Keep in mind the importance of proper money management. It is essential to respect your risk tolerance and avoid risking more than 2% of your account on any given trade. Stay disciplined and protect your capital. 💰💪
Feel free to share your toughts in the comments section, follow me for updates and don't forget to press the like button if this insight was helpful 🚀

EOSUSDT Bullish Bat PatternTarget is .836$
If 0.7$ support break down occurs, the idea will be invalid

XRP forming a bullish BAT for next pumpHi dear friends, hope you are well and welcome to the new trade setup of XRP coin with US Dollar pair.
Previously we caught more than 105% pump of XRP as below:
Now on a 2-hr frame, XRP is about to complete a bullish BAT move for the next price reversal.
Note: Above idea is for educational purpose only. It is advised to diversify and strictly follow the stop loss, and don't get stuck with trade.

PLUG rises on EV Sector strengthPLUG on the daily chart demonstrates a VWAP breakout having first trended down
into the lowermost VWAP bands from anchored VWAPs originating in November 2022
and January 2023. Fundamentally, PLUG is burning cash but less of it with each
succeeding earnings report. In the past two months price has ascended through a
couple of VWAP lines and has now crossed the mean VWAP in a sign of bullish momentum.
Price bounced up from the POC line of the volume profile in a demonstration of bullish
buying power and buyers defending that support level.
The dual RSI indicator shows that the 3-hour time frame RSI line in blue crossed over the
slower weekly time frame RSI line in black about June 28 and they are both above the
50 level is another bullish sign. On June 30, the zero-lag MACD had its lines descend to the
horizontal zero line and bounce upward over a positive histogram. The relative volume
indicator shows increasing overall volumes with the mean rising from 15M to 26M daily
overall. The presumption is that increasing volume supports price action while decreasing
volumes would cause price and volatility stagnation.
From this analysis, I conclude the time is right for a long-swing trade of PLUG. i will
zoom into a 15-30 minute time frame seeking a pivot low from which to enter using
a stop loss of 12.15 and targeting those upper aVWAP bands/lines.

PHB Phoenix Global formed bullish BAT for upto 23.50% pumpHi dear friends, hope you are well and welcome to the new trade setup of PHB Phoenix Global (new) with US Dollar pair.
Recently we caught more than 26% pump of PHB as below:
Now on a 4-hr frame, PHB has formed a bullish BAT move for the next price reversal.
Note: Above idea is for educational purpose only. It is advised to diversify and strictly follow the stop loss, and don't get stuck with trade.

Finally Bat Breaking out Bat breaking falling wedge In htfs Incase Of successful Breakout expecting Massive bullish rally in Midterm Incase Of successful Breakout expecting Move towards 0.70$

Bullish view on GoldThe weekly chart shows a solid support level at $1919.36 and resistance at $2016.26.
Excitingly, a Potential Bullish Flag Pattern on the 1-hourly chart signals a potential buying opportunity at $1954.80. Brace yourself for a substantial market movement! 🌟💰
Personally, I'm keeping an eye on a Bullish Fib-3 Bat Pattern forming at $1951.93, with a stop-loss set below $1949.10.
Remember, don't follow blindly—make your own trading decision. 🧠💼

Gains Network (GNS) formed bullish BAT move for upto 13.50% pumpHi dear friends, hope you are well and welcome to the new update on Gains Network (GNS) token with US Dollar pair.
Previously we caught almost 35% pump of GNS as below:
Now on a 4-hr time frame, GNS has formed a bullish BAT move for the next price reversal.
Note: Above idea is for educational purpose only. It is advised to diversify and strictly follow the stop loss, and don't get stuck with trade.

USDCHFAfter the correction which actually retrace the 50% on fib level on USDCHF now i taking my short to the down side for some weeks
