Nordex's YoY losses up 133% and Debt/Equity ratio up 54%FUNDAMENTAL ANALYSIS
Current liabilities increased 47% up to €3.4bn in 2022 from €2.3bn in 2021. Non-current liabilities decreased 37%.
Debt to Equity ratio (2022) = 4.42x
Debt to Equity ratio (2021) = 2.87x
Losses YoY increased 133% to €522 million. EBITDA turned negative in 2022 to -€244 million from €52,672 million in 2021.
Almost all Guidance provided in March 2022 was exceeded downwards except for Sales Guidance.
Positive side: Sales increased 4.58%.
TECHNICAL ANALYSIS
Since April 6, the company has entered into a downward trend that in Oct 2022 attempted to turn around. However, the banking crisis and inflation fears persist in a way that Nordex's stock performance graph experienced the appearance of a Bearish Bat pattern whose prophecy together with its recently issued FY 2022 results could materialise in the following days and weeks to come.
Bat

JOE token formed bullish BAT for upto 129% rallyHi dear friends, hope you are well and welcome to the new trade setup of JOE token with BTC pair.
Previously we caugh more than 90% pump of JOE as below:
Now on a daily time frame, JOE has formed another bullish BAT pattern for the next price reversal.
Note: Above idea is for educational purpose only. It is advised to diversify and strictly follow the stop loss, and don't get stuck with trade

GJ BatPossible short before long continuation. I'm looking to trade the C to D leg.
Let me know what you guys think, here are my measurement based on the 4hr chart:
X - 168.040
A - 171.073
B - 169.915
C - 170.943
D - 168.391
Comments and critique welcomed!

$RPD: 3 Rsing Valleys at the PCZ of a Bullish BatRPD has formed a 3 Rising Valleys pattern at the PCZ of a Bullish Bat Harmonic and is backtesting the Moving Averages as the 55 and 200 SMAs attempt to confirm a Golden Cross at the 0.886 PCZ.

BATS/VUKE.... Down 25%!If I held and VUKE (Vanguard FTSE 100 ETF) I would sell it now to buy BATS. BATS is down 25% relative to VUKE and offering 8% dividend yield compared to ~4% for VUKE.

Nvidia Swing ShortThis stock has been doing well recently and has reached significant resistance levels with overbought conditions and bear divs on both RSI and Volume. Along with that its moving up in rising wedge which is bearish structure.
Highlighted the levels for SL and TP (Orange lines) it may not go all the way down because move from bottom to 50% level looks solid and supported by volume acceleration.
We also at the PRZ of a large bat structure, which should start putting downward pressure on the stock's price.
We have notable events coming up (CPI announcement) tomorrow and the day after and if they cause volatility, it's possible to get some good entry into this.
If you like my content then please boost and share this post. I have over 6 years of trading and investing experience and have learned a lot in this time. I like to share what I have learned. If you would like to learn from my experience then follow me on trading view to get notified on my trade, market projections and several upcoming technical analysis and in-depth tutorials on technical Indicators. You can also leave a comment and let me know if you want me to look at any specific asset or want to learn about any specific topic in the world of Technical Analysis. I Will do my best to create a post for it.
Keep learning and Happy trading All.

BUY EURCADPrice action has just completed the bullish Patron Bat pattern and we therefore anticipate bullish momentum seeing price is at potential Demand Region. Buy however dont forget to apply strict Risk Management Rule. Good Day trading

USDCAD Bullish Bat pattern seen. Hoping for long bull run!USDCAD is showing good rejection at support area. We can see the bullish bat pattern is fully developed here. If it works out, we can see long bull move. Waiting for H4 and Daily candle to form before making reentry buy position.
Resistance: 1.36460 - 1.36670
Swap zone: 1.35200 - 1.35350
Support: 1.33020 - 1.33240
Trade at your own risk!

Tesla forming Bat PatternTesla forming Bat Pattern
We can see 20 % more downfall from current prices.
So book your profits and wait for bottom levels to add upon

Orion Protocol (ORN) forming bullish BAT for upto 35.50% pumpHi dear friends, hope you are well and welcome to the new trade setup of Orion Protocol (ORN) with US Dollar pair.
Our last successful trade of ORN was as below:
Now a 4-hr time frame, ORN is about to complete a bullish BAT pattern for the next price reversal.
Note: Above idea is for educational purpose only. It is advised to diversify and strictly follow the stop loss, and don't get stuck with trade

GOLD short BUY View....
AronnoFX will not accept any liability for loss or damage as a result of
reliance on the information contained within this channel including
data, quotes, charts and buy/sell signals.
If you like this idea, do not forget to support with a like and follow.
Traders, if you like this idea or have your own opinion about it,
write in the comments. I will be glad.

Stellar Lumens XLM formed bullish BAT for upto 25.50% moveHi dear friends, hope you are well and welcome to the new trade setup of XLM with US Dollar pair.
Recently we caught nice trade of XLM as below:
Now a daily time frame, XLM has formed a bullish BAT pattern for the next price reversal.
At the moment after the completion of final leg the priceline has slightly moved up, therefore, we can wait for some price correction to catch from the buying zone.
Buy between: $0.0901 to $0.0870
Sell between: $0.0995 to $0.1094
Stop loss: Below $0.0870
Possible profit ratio:
As per above targets there is a profit possibility of almost 25.50% and a loss possibility is upto 4%.
Note: Above idea is for educational purpose only. It is advised to diversify and strictly follow the stop loss, and don't get stuck with trade

bat usdt 4h chartbat usdt 4h chart
falling wedge forming at support zone (trendline and support)
short term long may happen according to blue arrow


Gold Swing Trade UpdateThe trade setup I posted in my last update (link below the post) on gold has already produced a 3% move. If anyone took it, I'd move the stop loss to your entry and secure the trade by taking initial tp. If you haven't entered the I'd wait for a retrace above 2040 and then enter.
I have added a parallel channel and Anti BAT harmonic to my chart. Both are bearish patterns. The Bat pattern is successful if we break below 1953, above that there is always a chance of bounce and continuation withing the channel that's why its important to secure the trade.
Below I have added a clean chart with only levels of interest which can be used for looking for reactions and bounces along the retrace path.
So far Gold has held Macro VAH (Value Area High). Which is the only bullish sign I see right now, everything else technically is bearish. I have highlighted several drives of bear divergences on Daily Time Frame going as far back as last year November. Losing Macro VAH is important for a retract to Macro POC. If we keep holding it for a long time, it will become a good launch pad for the next move up.
I have over 6 years of trading and investing experience and have learned a lot in this time. I like to share what I have learned and if you like my content and would like to learn from my experience hit like and follow me for getting notified on my trade, market projections and several upcoming tutorials on technical analysis and several technical Indicators. You can also leave a comment and let me know if you want me to analyze any specific asset or want to learn about any specific topic in the world of Technical Analysis. I Will do my best to create a post for it.
Keep learning and Happy trading All.


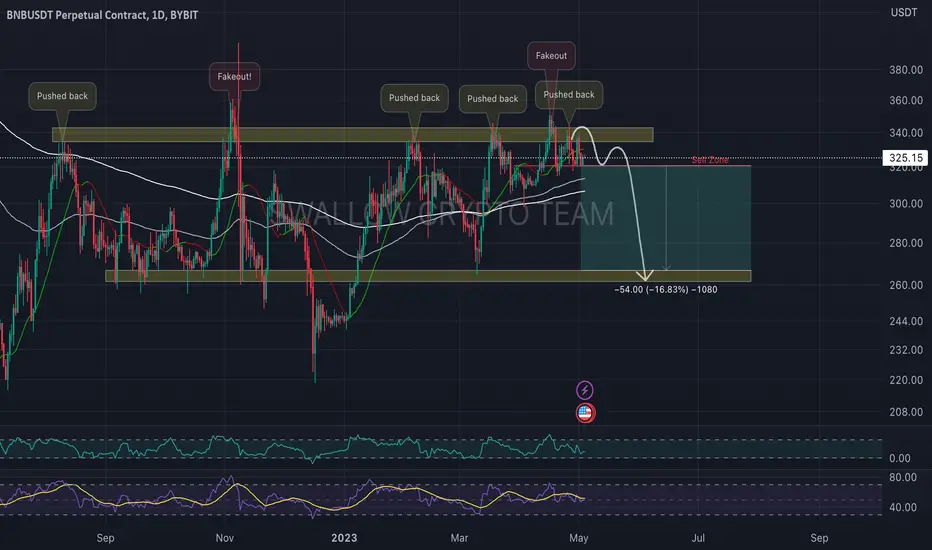
BNB/USDT had another rejectionHey guys 👋
Let's get back to BNB here where we see how price had another pullback from upper resistance zone and now we are on the edge of a cliff just waiting for a free fall. So let's see how we will end up here.
If you like ideas provided by our team you can show us your support by liking and commenting.
Yours Sincerely,
Swallow Team 🔱
Disclamer:
We are not financial advisors. The content that we share on this website are for educational purposes and are our own personal opinions.
USINTR Golden Reversal Level.the detail is shown in the above Idea.
I made this Idea based on Candlestick Analysis and Harmonic pattern.
usIntr Bearish Bat Pattern Will Start at 5.94 % and probably UsIntr Will Fall ( FED Decision).

Bitcoin (BTC) forming bullish BAT for another price reversalHi dear friends, hope you are well and welcome to the new trade setup of Bitcoin (BTC)
Previously we caught nice pump of BTC as below:
Now on a 1-hr time frame, Bitcoin is about to complete a bullish BAT move for the next price reversal.
Note: Above idea is for educational purpose only. It is advised to diversify and strictly follow the stop loss, and don't get stuck with trade

Entanglement and waves(The gold 1-hour level wave counts, the green b wave may end in 2040, and then the green c wave begins to fall.

Binance coin (BNB) formed a BAT for the next price reversalHi friends, hope you are well and welcome to the new trade setup of Binance coin (BNB) with US Dollar pair.
Previously we caught a nice trade of BNB as below:
Now on a 4-hr time frame, BNB has formed a bullish BAT for the next price reversal.
Note: Above idea is for educational purpose only. It is advised to diversify and strictly follow the stop loss, and don't get stuck with trade

SELL BEARISH CRAB ON NZDUSD 15MinNZD/USD has formed a bearish crab pattern on the 1h chart, providing a trading opportunity with a 1:4 risk to reward.
The measurements for a valid crab pattern are detailed below.
XA Retracement: 0.382 - 0.618
AB Retracement: 0.382 - 0.886
BC Projection of D leg: 2.618 - 3.618
XA Retracement of D: 1.618
Confluence: We can see an Elliot wave completion on H1, ABC reversal is anticipated on the 5th impulse wave.
All 3 measurements form within close proximity in the potential reversal zone. as you can see, the shooting star reversal candle formed on 15Min TF confirmed the PRZ.
The price has already been pushed lower to confirm the 3.14 measurement, and as such entry is feasible.
Have a good week everyone!

Bearish Harmonic Bat on NZDCADA bearish Bearish Harmonic Bat found on NZDCAD targeting the prices highlighted on the right.
