AUDCAD BAT PATTERNHarmonic Pattern Trading Strategy:
1. Combine patterns with 2-3 confirmations (e.g., MA, BB, RSI, Stoch) for increased accuracy.
2. Implement proper risk management.
3. Limit exposure to 3% of capital per trade.
4. Exercise caution: Not every Harmonic Pattern presents a good trading opportunity.
5. Conduct thorough diligence and analysis before trading.
Disciplined approach = Enhanced edge.
Bat

USDCHF focuses on buying opportunities at 0.9030On the 4-hour chart, USDCHF is currently fluctuating at a high level. Currently, we can pay attention to the support near 0.9080. If it breaks, it will test the support of 0.902-0.906 area below. When the market reaches around 0.903, we can pay attention to the potential bullish bat pattern.

#CCAP Egyptian stock#CCAP time frame 1 DAY
Created a bearish Gartley pattern
Sell point at 2.57
Stop loss / reentry 2.63 ( estimated loss -2.15% )
First target at 2.44 ( estimated profit 5% )
Second target 2.32 up to 2.24 ( estimated profit up to 13% )
and may prices still going down to around 2.00 .
the profit in this case is saving your invest from losses up to 13% .
in case the prices still rises then re entry for targets 2.75 , 2.83 , 2.93 up to 3.11.
NOTE : this data according to time frame 1 DAY
Its not an advice for investing only my vision according to the data on chart
Please consult your account manager before investing
Thanks and good luck

USDCAD BEARISH BATHarmonic Pattern Trading Strategy:
1. Combine patterns with 2-3 confirmations (e.g., MA, BB, RSI, Stoch) for increased accuracy.
2. Implement proper risk management.
3. Limit exposure to 3% of capital per trade.
4. Exercise caution: Not every Harmonic Pattern presents a good trading opportunity.
5. Conduct thorough diligence and analysis before trading.
Disciplined approach = Enhanced edge.

GBPNZD BULLISH BATHarmonic Pattern Trading Strategy:
1. Combine patterns with 2-3 confirmations (e.g., MA, BB, RSI, Stoch) for increased accuracy.
2. Implement proper risk management.
3. Limit exposure to 3% of capital per trade.
4. Exercise caution: Not every Harmonic Pattern presents a good trading opportunity.
5. Conduct thorough diligence and analysis before trading.
Disciplined approach = Enhanced edge.

EURNZD BEARISH BATHarmonic Pattern Trading Strategy:
1. Combine patterns with 2-3 confirmations (e.g., MA, BB, RSI, Stoch) for increased accuracy.
2. Implement proper risk management.
3. Limit exposure to 3% of capital per trade.
4. Exercise caution: Not every Harmonic Pattern presents a good trading opportunity.
5. Conduct thorough diligence and analysis before trading.
Disciplined approach = Enhanced edge.

XAUUSD short-term focus on bearish bat patternOn the 4-hour chart, XAUUSD is fluctuating upward, with short-term bulls in the lead. The current upward target can be seen in the previous supply area of 2700-2726. When the market reaches around 2710, pay attention to the potential bearish bat pattern, and the downward target can be seen around 2640.

MGPI MGP IngredientsUnder legal issues for securities disclosure issues (or shareholders wanting to re-coop losses)
Not sure if inventory disclosure issues really impact a businesses profitability or is considered enough to reward shareholders for losses, as that doesn't really impact profitability or value as carrying costs is already included in opex, but I'm not a fundamental analysis person
Technically has several reasons this level may offer some medium term support
I personally like higher potential profits but this one has a big cushion in terms of cash on hand (Quick ratio) has 30% insider ownership, has changed the management quickly upon the issue being raised, and is a relatively stable business from a profitability standpoint
Not crazy cheap but has been driven down by bad news only and reaching technical levels of support with patterns emerging with oversold indicators and 18 year highs offering a zone of support meaning the path of least resistance is likely higher as all of the sellers have likely already sold
Not looking to hold this one forever but may do a 1 year trade on it and try to capture the easy 50%

ABB will have correction 30 - 35%?ABB has closed below 200 EMA on day time frame.
It has next demand support at 6600 & 6300.
Close below 6300 will confirm BAT pattern formation and this will lead to a correction up to 4400.
Target: 6600 / 6300 / 5500 / 5000 / 4400

NZDCAD - Using Higher Timeframe Analysis To Pick Bigger TargetsIn this video we take a look art a potential bullish bat pattern on the NZDCAD. However, what makes this potential bat pattern different than most is the fact that it aligns with a potential bearish trend continuation setup on the higher timeframe as well.
What this allows for is 3 different ways to take this trade.
1) As a normal bat pattern with normal targets
2) Using the bat pattern as simply an aggressive entry reason for the bigger continuation trade
3) Taking partial targets off at the bat pattern target 1 level & shifting your secondary targets to the trend continuation target level.
The combinations are honestly endless, but this provides an excellent example of why higher timeframe analysis can be so important.
Akil

Dot Target why 20$ KUCOIN:DOTUSDT BINANCE:DOTUSDT BINANCE:DOTUSDT.P CRYPTOCAP:DOT
---
### **1. Fibonacci Retracement Analysis**
- **Levels Observed**:
- **0% (High)**: **55.081** (all-time high or recent significant high).
- **0.236**: **42.594**.
- **0.5**: **28.625** (midpoint of retracement).
- **0.618**: **22.381**.
- **0.65**: **20.688** (golden pocket).
- **0.786**: **13.491**.
- **1.0 (Low)**: **2.168** (all-time low or recent significant low).
---
### **2. Current Price**
- The price is currently around **7.790**, significantly lower than the golden pocket (0.618–0.65) and closer to the lower Fibonacci levels.
---
### **3. Take-Profit Level at $20**
- **Why $20?**
- **Golden Pocket Zone**: The **0.618–0.65 Fibonacci zone** is considered a high-probability reversal area. Many traders set their take-profit just below this zone to ensure profit capture before significant resistance is encountered.
- **Psychological Level**: The $20 price point serves as a psychological resistance, where many traders might exit, amplifying sell pressure.
- **Confluence with Historical Data**: Previous price action near this level likely showed significant resistance/support, aligning with Fibonacci levels.
---
### **4. Resistance and Support Zones**
- **Major Resistance Levels**:
- **22.381–20.688**: The golden pocket and primary target zone.
- **28.625**: Midpoint retracement, another key resistance level.
- **Support Levels**:
- **13.491**: **0.786 Fibonacci level**, which may act as a strong base for further upward momentum.
- **2.168**: All-time low or significant recent low.
---
### **5. Potential Price Scenarios**
- **Bullish Case**:
- If the price breaks through **13.491**, it could rally toward the golden pocket zone near **20.688–22.381**.
- A breakout beyond **22.381** could extend the rally toward **28.625** or even higher.
- **Bearish Case**:
- If the price fails to hold **13.491**, it may revisit lower levels, potentially near the all-time low of **2.168**.
---
### **6. Strategy and Recommendations**
- **Entry Point**:
- Current prices near **7.790** are ideal if the upward trend continues.
- **Take-Profit**:
- The take-profit at **$20** is conservative and aligns with the golden pocket zone.
- **Stop-Loss**:
- Set below **13.491** to minimize losses if the trend reverses.
---
### **7. Market Psychology**
- Many traders use Fibonacci retracement levels to define take-profits. The golden pocket is a popular area where selling pressure increases, causing potential reversals.

XAUUSD bearish bat patternOn the 4-hour chart, XAUUSD stabilized and rebounded in the short term, and the bullish pattern was dominant. The price is expected to continue to rise, and the upper side is concerned about the previous supply area of 2700-2726. In addition, when the price reaches around 2709.6, pay attention to the potential bearish bat pattern.

EUR/USD Harmonic BD Trade SetupEUR/USD Harmonic BD Trade Setup
Pattern: Harmonic Pattern
Timeframe: 4-Hour Chart (H4)
Entry Levels:
Bullish Scenario: Above 1.05214 for a potential upward breakout.
Bearish Scenario: Below 1.03670 for a potential downward breakout.
Target Levels:
Bullish Target: 1.06300 (first target) and beyond based on further price action.
Bearish Target: 1.03069 (first target) and below based on further price action.
Key Zones:
PRZ (Potential Reversal Zone): Highlighted by the purple lines, indicating areas where the price might reverse or continue strongly in the given direction.
Description: This harmonic BD pattern highlights a critical decision zone for EUR/USD. Traders should watch for a breakout or reversal near the identified PRZ levels. The green arrow suggests a bullish breakout possibility, while the red arrow indicates a bearish continuation.
Risk Management:
For long positions: Place stop-loss below 1.05100.
For short positions: Place stop-loss above 1.03700.

Price rengeBAT/USDT Chart:
Trend: Uptrend Price above moving average (yellow line).
Support: Green zone
Around 0.2317.
Resistance: Red zone Around 0.3778.
Possible Strategy:
Buy: Breaked EMA snd firs resistance
Sell: If price fails to break resistance
Note: Always consider market new and overall trends.

BHEL - Forming BAT or ButterflyBHEL has moved below 20 & 50 EMA.
Also it has closed below Lakshman Rekha to confirm BAT pattern formation.
Possible targets - 283 / 270 / 250 / 230.

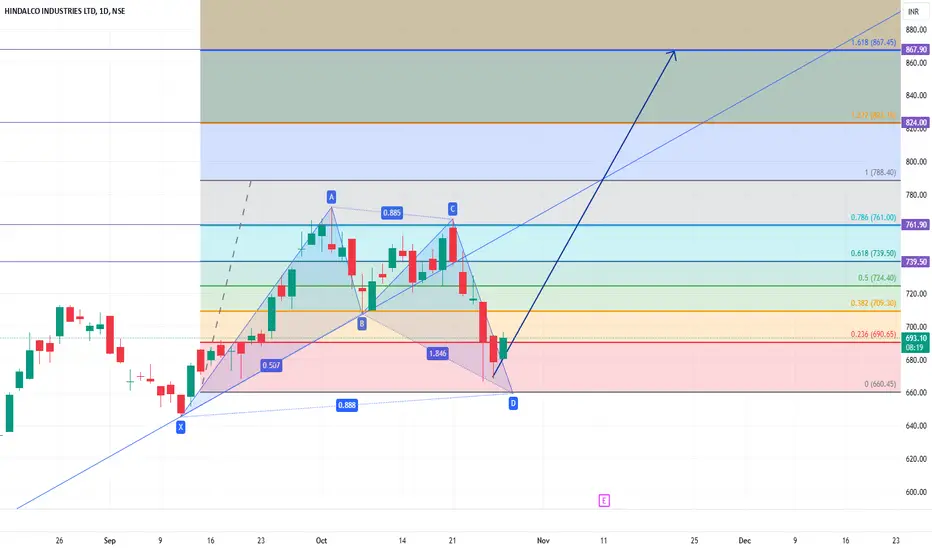
Hindalco - Forming BAT PatternHindalco gas completed BAT pattern formation.
It may take rally up to
Target1: 740 to 760
Target2:823 to 865
Time Frame by beginning of Dec'24
GBPUSD bearish bat patternIn the 4-hour chart, GBPUSD stabilized and rebounded, and the short-term market is expected to continue to rise. At present, we can pay attention to the resistance near 1.2700 above, which is a potential short position for the bearish bat pattern, and this position is in the previous common area.

Tech mahindra - Double Top - Short setupTech Mahindra started reversing from double top zone which confluences with BAT harmonic pattern
Entry around 1730-1740. SL will be 1800, if price settles above this level in weekly timeframe
Can expect price to reach 1560 to 1410 levels.

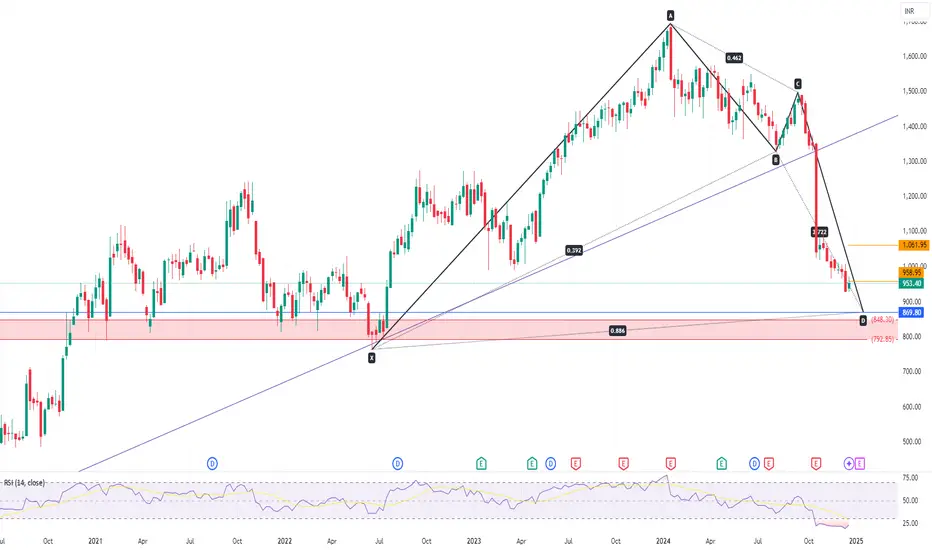
Indusindbank - Long setupIndusindbank broke trendline and reaching towards reversal zone - Half BAT & BAT Harmonic patterns.
Expected reversal at 848.30 to 869.8. Pattern will fail if price settles below 792 in weekly timeframe.
Retracement leg can reach till 960 to 1060
Soluna Holdings Inc - LONGBullish Bat
Soluna Holdings Inc
Idea that needs other confirmations.
Long @ $1.80

XAUUSD bearish bat patternOn the 4-hour chart, XAUUSD stabilized and rebounded. At present, attention can be paid to the resistance near 2655.3 above. After reaching it, attention can be paid to the potential bearish bat pattern. At present, the support below is around 2608. If it falls below, it will continue to fall. If the price breaks through the resistance near 2664.5, it will continue to rise.

BTCUSD Potential Bearish Bat PatternOn the 4-hour chart, BTCUSD is currently fluctuating at a high level. At present, attention can be paid to the resistance near 99600. A break through will be expected to further rise. The upper resistance is around 106525. When the price reaches 106525, attention can be paid to the potential bearish bat pattern. The lower support is around 92000. If it falls below, it will continue to fall.

CADCHF BULLISHWe have high opportunity for bullish because of:
-We have Bat harmonic pattern.
-Have a downtrade channel which broken before touch lower side.
-The price bounced back from liquidity area.
