Will $BB Pick a Direction By Friday?The short term trend suggests a direction will be chosen by Friday and I'm inclined to think BB drops under $4.50. Max pain is $4.50, but there are 9000 call contracts up for expiry this Friday at $5. Should be interesting...
BB

Which way $BB??My sense is BB is going to swing back down to the bottom of the channel, because why not? Whatever is going to happen it'll happen on Monday.
Sure would be nice to see her pop above the channel and keep going...

Upstart Holdings - Reddit Is Not Your FriendI came across this stock because of a Wall Street Journal article focused around some meme traders who were holding bags and bullish despite being on the cusp of a recession and a colossal market crash. So I started to take a look at it.
Fundamentally, UPST is down a lot, like all the other r/WallStreetBets and Reddit cesspool pump and dumps. From the description, this stock sounds like one of the many crypto ponzis, except it trades on the NYSE instead of FTX.
This chart is complete only with monthly bars and a small note for a reason. Look at the monthly bars. It's already at an all time low. You really need to zoom out and understand the macro situation when you trade. Otherwise you're just gambling. Just trying to get rich quick.
Trading is self cultivation and you need to take it a lot more seriously, or you'll destroy yourself.
UPST isn't going to bounce. It's going to $0.
Reddit is something you should stay away from. There is a heavy Marxist-Leninist faction there. Additionally, it is not a social media site. It is a social marketing and social influencing site. You think you are looking at other users organically talking to you, but you're really looking at a botnet and a public relations firm who are bringing in dead money to buy whatever bags the advertisers are paying them for.
Anyways, some scary signs on this stock are:
Earnings are August 8
Dip to buy was granted on July 7
Reddit posts like dude with 79,000 shares and a "2.27M bet" on UPST appear
A number of other chatter appear on Reddit around the same time using reverse psychology encouraging bagholders to HODL
Chatter about shortsqueezes
Company had a good earnings in May and fell 35% because it "slashed its outlook."
Q2 earnings were pre-released also around July 7. They're not good, which generated the dip.
Week before earnings it starts to pump, which takes out short sellers
Maybe you think that it will rocketship up because it's down so much
Anyways. You should know that nobody on Reddit wants you to be financially secure, wealthy, happy, and rich.
Instead, they seek to bankrupt you, corrupt you, and have you destroy your life while you hold their bags.
For example, a few months ago, the London School of Business analyzed options trading data using OPRA codes that allowed them to pinpoint retail activity. They found retail lost $5 billion trading options during the biggest bull run in stock market history.
Much of the losses were correlated with times that memestocks were being promoted on r/WallStreetBets. The promotions started when things were already up, so you'd go buy calls on HOOD, it would dump, you'd lose all your money, they'd laugh at you and then go to the strippers.
Google "WallStreetBets and Gamestop Crowd Lost $5.27 Billion" and read the study yourself if you don't believe it.
Be careful.

BB Wants to RiseWell $BB didn't go parabolic, but she still wants to get higher. There are key trend lines to cross and we're at a cross roads in the current pattern. But after we break out, I could see her trading sideways before another, more significant break to the upside.

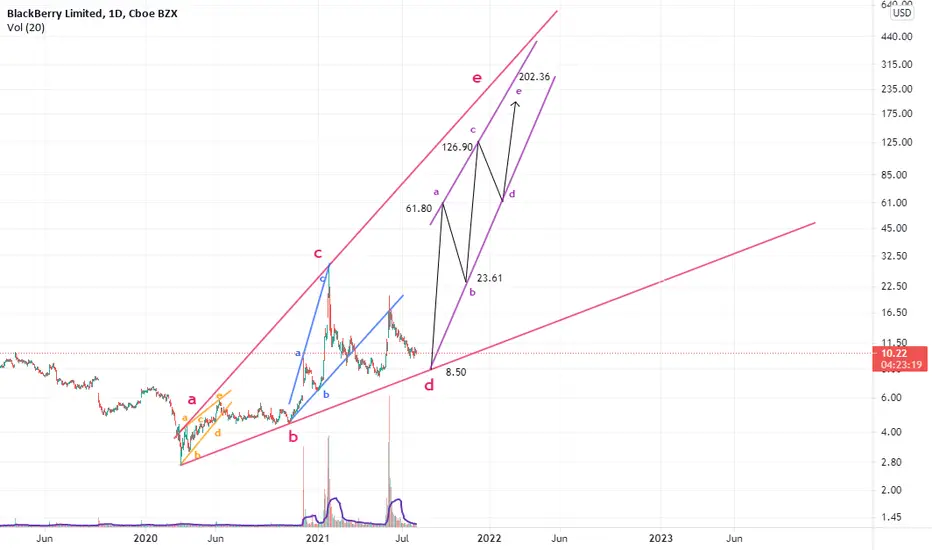
Blackberry Fibo levelsFibo levels:
AB=0.61 XA
BC=0.61 AB=$6.65
0.78 XA=$63
1.6 BC=$70
0.88 XA=$94
2 BC=$120
2.24 BC=$169
1.13 XA=$250
2.6 BC=$288
1.41 XA=$763
3.6 BC=$1189
1.6 XA=$1752

BB BlackBerry Limited Options Ahead Of EarningsLooking at the BB BlackBerry Limited options chain, i would buy the $5.5 strike price Calls with
2022-10-21 expiration date for about
$0.25 premium.
Looking forward to read your opinion about it.

BB - Double Bottom Update I believe BB will undergo a double bottom
This double bottom will take place with the second bottom hitting the middle line of a strong down channel
This adds to my previous BB post
Blackberry / BB - 'Tis No Bubbling Volcano, But 'Tis a Geyser.I'm not a big fan of the meme stocks and I'm not a big fan of speculating. However, I was scrolling through the charts and I noticed that Blackberry BB had a unique tell in its monthly chart, which I will show inline since I have to make the post on the weekly candles, otherwise it won't display:
Simply put, BB has never broken its pre-meme pump and dump lows from the times it was front ran by the Marxist-Leninist PR brigade on Reddit/WallStreetBets.
It also has three months of relatively equal, subdued prices, before experiencing a small breakout this month.
And this pattern is something of a fractal to what we find in the weekly candles of our good friend BBBY Bed Bath and Beyond, but only on the weekly chart. Note it also never broke its weekly lows:
What's really notable is that Citadel Securities, which is more or less the dark pool market maker that keeps Robinhood, where retail lost $5 billion "Apeing" calls on memestocks during the biggest bull run in stock market history , in business, bought 1.966 million shares of BB, reported in June 30 disclosures.
Citadel also bought 2.265 million shares in BBBY, which was also reported in June 30 disclosures.
I said in my recent BBBY call that the fact that Citadel hasn't unloaded their BBBY bags (yet) is the real thing to watch, while Ryan Cohen's exit was a mere red herring.
All of that is just circumstantial stuff, but Blackberry did break out of its three month consolidation, took out a new high early in the month, and has made a healthy retrace without any particular bearishness:
The July --> August run was like 35%, which is pretty good in anything.
As of now, there's exactly zero chatter on Reddit about BB pumping, except for this one thread titled "BlackBerry is the next play by the apes" from last week, which was downvoted to oblivion and filled with mocking comments such as "Hahaha… how heavy are your bags???" and "People have been saying this since gamestop lol."
I've said repeatedly that social marketing, not social media, venue Reddit will not begin to promote a stock until it has already pumped and you're already paying way too much for options.
You aren't looking at organic posts by fellow college kids, but instead you're looking at a hybrid botnet/public relations firm pretending to be normal people for the purposes of having you inculcate yourself with atheism, leftist Party narratives, pornography, and to come and lose your inheritance to the market makers paying them.
So a lack of social hype, in combination with price action, in combination with Citadel taking a significant position, gives good pause to consider if BB is set for another fat pump and dump style weekly wick that will burn the hands of suckers who buy the tops.
Personally, I think it is, and the target is around $15. I expect it to be the usual lackadaisical long candle with marginal hype and a quick cooling off period that accompanies some other things going moon and then collapsing all at the same time.
So, when you see BB go up, don't chase it. Your "fear of missing out" will turn into an expensive spot on your Roth IRA's shelf.
And my usual reminder: Reddit is partially owned by Tencent, an arm of the Chinese Communist Party. Reddit wasn't your friend before Tencent took a stake, but they're even less anything but a filthy Marxist maelstrom to fall into now that the Evil Party has its hand around several of its ribs.

BB About to Go Parabolic?BB is repeating the accumulation algo prior to January, 2021 and it's moving about twice as fast.
In Dec 2020, #BB broke above the (red) downtrend and within 6 sessions gapped up 60% before retesting a major support level. We've been in this same cycle for about 7 months and we're about to pierce the (red) downtrend. If the algo is going to repeat itself, we'll gap up within 3-6 sessions before retesting back onto the parabolic curve.

Fruit shoot? BlackBerry
Short Term
We look to Buy at 6.18 (stop at 5.57)
Previous resistance, now becomes support at 6.20. Price action looks to be forming a bottom. There is scope for mild selling at the open but losses should be limited. Further upside is expected although we prefer to set longs at our bespoke support levels at 6.20, resulting in improved risk/reward.
Our profit targets will be 7.95 and 8.49
Resistance: 7.96 / 8.50 / 12.00
Support: 6.20 / 5.25 / 5.00
Disclaimer – Saxo Bank Group. Please be reminded – you alone are responsible for your trading – both gains and losses. There is a very high degree of risk involved in trading. The technical analysis, like any and all indicators, strategies, columns, articles and other features accessible on/though this site (including those from Signal Centre) are for informational purposes only and should not be construed as investment advice by you. Such technical analysis are believed to be obtained from sources believed to be reliable, but not warrant their respective completeness or accuracy, or warrant any results from the use of the information. Your use of the technical analysis, as would also your use of any and all mentioned indicators, strategies, columns, articles and all other features, is entirely at your own risk and it is your sole responsibility to evaluate the accuracy, completeness and usefulness (including suitability) of the information. You should assess the risk of any trade with your financial adviser and make your own independent decision(s) regarding any tradable products which may be the subject matter of the technical analysis or any of the said indicators, strategies, columns, articles and all other features.
Please also be reminded that if despite the above, any of the said technical analysis (or any of the said indicators, strategies, columns, articles and other features accessible on/through this site) is found to be advisory or a recommendation; and not merely informational in nature, the same is in any event provided with the intention of being for general circulation and availability only. As such it is not intended to and does not form part of any offer or recommendation directed at you specifically, or have any regard to the investment objectives, financial situation or needs of yourself or any other specific person. Before committing to a trade or investment therefore, please seek advice from a financial or other professional adviser regarding the suitability of the product for you and (where available) read the relevant product offer/description documents, including the risk disclosures. If you do not wish to seek such financial advice, please still exercise your mind and consider carefully whether the product is suitable for you because you alone remain responsible for your trading – both gains and losses.

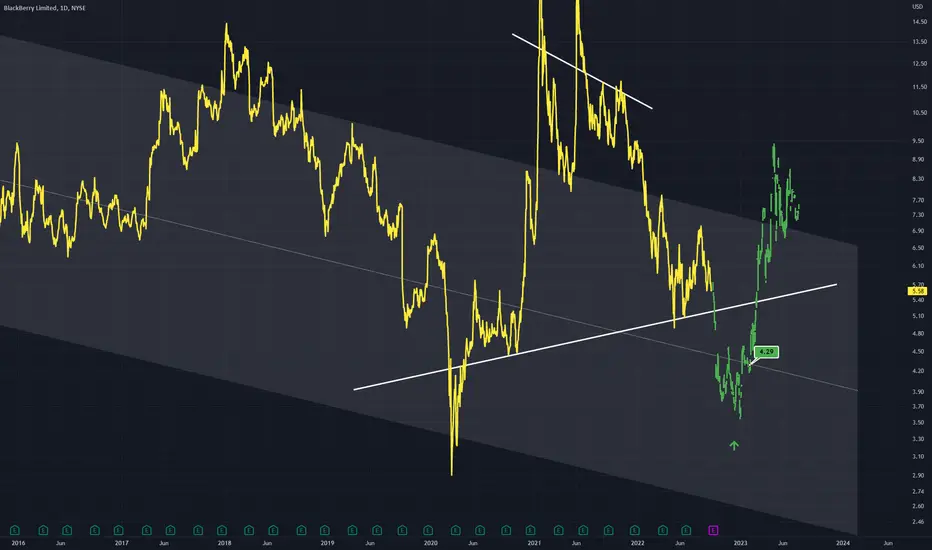
BB - Similar BottomsBB has formed a similar bottom (green arrows)
This is a possible break out of a larger formation
I expect bullish results on this 4D chart


$SPY BB OptimizationUsing @KioseffTrading BB Optimizer on SPY, really loving the data I am seeing on this. SPY is seeming to have a hard time currently at $410 and the BB optimizer has an exceptionally well win rate %, will be eyeing this down for an entry in the near future using this optimization tool!

HOW TO SWING TRADE USING BB - MACD!Today im going to show you how to use Bolinger Bands and MACD together to understand where the price is going.
So you can swing trade easily.
By the way swing trade is holding assets for profit for more than a day.
So this strategy is suitable for novice investors. But you will need practice before applying this to your trading strategy!
First of all i do not recommend betting against the market.
Do follow the trend when using this strategy. If the trend is upwards do not short the asset.
But there can be breakout from the existing trend.
Therefore we can also use trendlines to have better understanding of the market.
Lets identify indicators that we are going to use then i will explain how to use them to swing trade.
MACD measure specific EMAs and their relations. EMAs are mainly 12 period EMA and 26 period EMA.
There are 2 lines and 1 histogram on MACD. They are called, MACD line, Signal line, Histogram.
MACD line = 12 EMA - 26 EMA
Signal line = 9 EMA of MACD line
Histogram = Difference between MACD line and Signal line
We use MACD to identify trends so we can trade accordingly.
If the MACD line is above 0, we are in a uptrend.
If the MACD line is below 0, we are in a downtrend.
If the MACD line is above or crosses above signal line it is a buy signal.
If the MACD line is below or crosses below signal line it is a sell signal.
Longer histograms and being too far away from zero line means momentum of the trend is high.
These are the basic of MACD.
Bolinger Band is easier to grasp than MACD.
There is an upper channel and lower channel calculated with volatility and 2 Standard Deviations from 20 Simple of MA line.
Generally if the price is closer to the upper band, market is considered overbought and vice versa.
If the market is highly volatile bands widen and if volatility is low bands contract.
The most important thing about BB is 20MA. Generally price will test 20MA line after it hits the upper or lower band.
If price breakout or rejceted from it, trend is established.
So how can we combine both of them to swing trade successfully?
1- We have to identify the market trend. We can simply draw a trendline on the chart to identify it.
2- Use 20 MA as entry-exit
3- Look MACD histogram for momentum
4- Use lower - higher band as SL-TP
Example;
Look at the chart on the left!
Feb 04 19, uptrend started and MACD signal buy.
But there is no momentum.
MACD far away from zero line and price far away from 20MA.
Wait until price breakout from 20MA.
1- is the confirmation of trend with momentum rising and price breakout above 20MA line. BB start to widen meaning high volatility.
You can enter long trade here since price and momentum rising with volatility.
2- is the upper band of BB. This is take profit levels.
If you are seasoned enough you can open short position here with 20MA area TP.
3- Test of 20MA. You can enter short or long here with lower BB being SL - TP.
But with MACD signaling sell and losing positive momentum in histogram, short seems to be the RIGHT CHOICE .
4-Price cant hold 20MA. Drop to the lower band. SL-TP zone.
If you are seasoned enough, potential entry zone for long trade. TP being with 20 MA zone.
Lets take a look at the chart on the right.
Same chart, after a couple of weeks from chart 1.
There is a clear uptrend that started 09 March 20.
1- At 20 April MACD signal buy but there is no momentum and price was still below MA20.
It is logical to wait for confirmation which is the breakout of MA20.
2-Price breakout MA20 after a week.
Between 27 April - 05 Oct, there are more than couple times that market offers good entry zones.
Between this time, MACD momentum and lines are rising to the positive-buy zone.
3- Price is around upper band for a long time. Could be a TP zone.
Price also lost %25 value 2 in weeks. Some people use here as TP zone.
But MACD lines and histogram were positive.
Price didnt test the 20MA.
Also BB is still widening. Meaning high volatility in a bull market.
Opening short is not logical here.
4- Last time price touched the upper band.
Histogram started to lose momentum.
Potential TP zone and short entry.
To be honest this seems to be a good point for short trade but didnt work out.
Price went up (2. ATH) couple of weeks later with MACD momentum nearly finished.
Therefore always put SL-TP with your orders.
5- MACD signaling sell.
Low negative momentum.
If open short here, it could be like NO.3 on the chart.
Wait for confirmation.
6- Price test MA20.
After couple of weeks we broke down MA20. Bear confirmed.
Momentum rapidly increase to the negative zone.
Potential short entry.
7-Price cant hold MA20.
Lower BB reached.
Possible SL-TP area.
So sign from MACD to enter a long trade just yet.
8- Possible long entry with MA20 breakout above.
MACD signal buy with low momentum. Therefore wait for confirmation is logical.
After a week momentum rises.
Long entry seems logical.
New ATH for BTC.
So in short,
Identify a trend!
Check MACD for momentum and trend strength.
Enter when price breakout MA20.
Confirm the breakout before enter!
TP-SL at the MA20 and Band limits.

SAND Short SetupSAND Short Setup
Sell Momentum
Please noted this setup is HIGH RISK because its already hit fibo 1,68 (Take profit of sell momentum area)
Entry:
Sell market high risk
Sell limit 4.2082 - 4.3809
Target:
TP1 4.0355
TP2 3.7561
TP3 3.3040
Stoploss:
You decide
Always do your own research!

$BB - Blackberry - investment idea 💡 ⚠️ - This idea is based on my technical analysis only. Do your research and trade on your own risk!

BTCUSD All time Frames have touched the Bottom BB Ready to move All time frames have touched the bottom BB and this is possibly ready to move to the upside. I placed a red line where the Daily Bottom BB is now but just know its already hit it and not neccessary for this to be touched again.
by iCantw84it
02/27/22

BlackBerry Falling? BlackBerry - Short Term - We look to Sell a break of 8.38 (stop at 8.97)
Previous support located at 8.50. The primary trend remains bearish. The trend of lower highs is located at 9.50. A break of bespoke support at 8.50, and the move lower is already underway.
Our profit targets will be 6.53 and 5.80
Resistance: 9.50 / 10.00 / 12.00
Support: 8.50 / 8.00 / 6.50
Disclaimer – Saxo Bank Group. Please be reminded – you alone are responsible for your trading – both gains and losses. There is a very high degree of risk involved in trading. The technical analysis, like any and all indicators, strategies, columns, articles and other features accessible on/though this site (including those from Signal Centre) are for informational purposes only and should not be construed as investment advice by you. Such technical analysis are believed to be obtained from sources believed to be reliable, but not warrant their respective completeness or accuracy, or warrant any results from the use of the information. Your use of the technical analysis, as would also your use of any and all mentioned indicators, strategies, columns, articles and all other features, is entirely at your own risk and it is your sole responsibility to evaluate the accuracy, completeness and usefulness (including suitability) of the information. You should assess the risk of any trade with your financial adviser and make your own independent decision(s) regarding any tradable products which may be the subject matter of the technical analysis or any of the said indicators, strategies, columns, articles and all other features.
Please also be reminded that if despite the above, any of the said technical analysis (or any of the said indicators, strategies, columns, articles and other features accessible on/through this site) is found to be advisory or a recommendation; and not merely informational in nature, the same is in any event provided with the intention of being for general circulation and availability only. As such it is not intended to and does not form part of any offer or recommendation directed at you specifically, or have any regard to the investment objectives, financial situation or needs of yourself or any other specific person. Before committing to a trade or investment therefore, please seek advice from a financial or other professional adviser regarding the suitability of the product for you and (where available) read the relevant product offer/description documents, including the risk disclosures. If you do not wish to seek such financial advice, please still exercise your mind and consider carefully whether the product is suitable for you because you alone remain responsible for your trading – both gains and losses.

Closing the Week (1/14) Above The Trend Line with MA's Curled UpTrade at your own risk.
My analysis is bullish. We've got a green week candle about to close above the trend line, the 100 & 200 day moving averages on the week chart about to cross, the Mac D & Stoch RSI on the week looking decent to pump, moving averages strongly curling & trapping on the month, similarly on the 3 month. My target would be 200 day moving average on the day chart (as it hit during last years run) or slightly lower due to the MA coming down sharply on the 3 month, right around $14.50.

Do you feel it?are we seeing a moment of cool down on IWM? if we are this is how i think this thesis could play out like my drawings but if you agree please drop a like!
cheers

BB Canadian Chart Geo MathsLets see if this GEO chart can get up to that price target on the top of the cypher.

BB Idea for the BullsBB has formed a familiar structure (in yellow) under this channel that can be drawn
A break out of this will send the bulls on a rally like the initial one
Lets see what happens, a long with no leverage would be the play on this weekly chart
