There is a trading opportunity to buy in IOTABTCMidterm forecast:
While the price is above the support 18.20995, beginning of uptrend is expected.
We make sure when the resistance at 26.50000 breaks.
If the support at 18.20995 is broken, the short-term forecast -beginning of uptrend- will be invalid.
Technical analysis:
A trough is formed in daily chart at 18.29715 on 05/07/2020, so more gains maximum to Major Resistance (26.50000) is expected.
Price is above WEMA21, if price drops more, this line can act as dynamic support against more losses.
Relative strength index (RSI) is 71.
Trading suggestion:
. There is a possibility of temporary retracement to suggested support zone (0.00002171 to 0.00002090). if so, traders can set orders based on Price Action and expect to reach short-term targets.
Beginning of entry zone (0.00002171)
Ending of entry zone (0.00002090)
Take Profits:
TP1= 0.00002650
TP2= 0.00003084
TP3= 0.00003450
TP4= 0.00003911
TP5= 0.00005960
TP6= 0.00008280
TP7= 0.00011400
TP8= 0.00018494
TP9= 0.00023550
TP10= 0.00028590
TP11= 0.00045020
TP12= Free
Trade Setup:
We opened 12 BUY trade(s) @ 0.00002182 based on 'Valley' entry method at 2020.03.27.
Total Profit: 4824 pip
Closed trade(s): 468 pip Profit
Open trade(s): 4356 pip Profit
Closed Profit:
TP1 @ 0.00002650 touched at 06.04.2020 with 468 pip Profit.
Open Profit:
Profit for one trade is 0.00002578(current price) - 0.00002182(open price) = 396 pip
12 trade(s) still open, therefore total profit for open trade(s) is 396 x 11 = 4356 pip
❤️ If you find this helpful and want more FREE forecasts in TradingView
. . . . . Please show your support back,
. . . . . . . . Hit the 👍 LIKE button,
. . . . . . . . . . . Drop some feedback below in the comment!
❤️ Your Support is very much 🙏 appreciated! ❤️
💎 Want us to help you become a better Forex trader ?
Now, It's your turn !
Be sure to leave a comment let us know how do you see this opportunity and forecast.
Trade well, ❤️
ForecastCity English Support Team ❤️
BC

Major altcoins consolidated index updateHi guys,
Price keeps trading near the previously stable uptrend trendline that was breached on April 20. As you can see from the chart, there were 6 consecutive attempts on that line in the last week, but the consolidated price index could not return above it.
Still, it is slowly moving North towards our target of $735, which is also where the next major Fibonacci retracement from the downtrend is situated. Let's see if a second visit to that resistance will result in a rebound and a continuation of the downtrend or will be the trigger of the reversal to the upside.
On the 1-h chart we are in a downtrend corridor since April 26, but what we see today is a potential breakout, which is still in the making, so let's see how this evolvs.
Cheers,


BC - Ascending ChannelStock is exiting an oversold condition while maintaining an RSI above 50 & remaining in its existing ascending channel. This stock is gaining some strength against the SPX as is the Discretionary sector.
I am targeting the channel resistance line or the $65.20 price level as my profit zone.


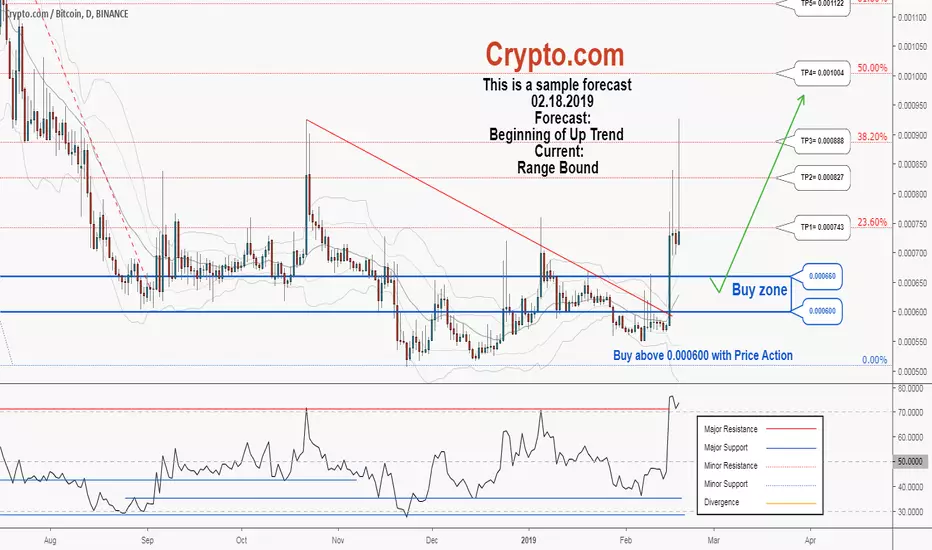
There is a possibility for the beginning of an uptrend in MCOBTCTechnical analysis:
. CRYPTO.COM/BITCOIN is in a range bound and the beginning of uptrend is expected.
. The price is above the 21-Day WEMA which acts as a dynamic support.
. The RSI is at 73.
. The price downtrend in the daily chart is broken, so the probability of the resumption of an uptrend is increased.
Trading suggestion:
. There is a possibility of temporary retracement to suggested support zone (0.000660 to 0.000600). if so, traders can set orders based on Price Action and expect to reach short-term targets.
Beginning of entry zone (0.000660)
Ending of entry zone (0.000600)
Entry signal:
Signal to enter the market occurs when the price comes to " Buy zone " then forms one of the reversal patterns, whether " Bullish Engulfing ", " Hammer " or " Valley " in other words,
NO entry signal when the price comes to the zone BUT after any of the reversal patterns is formed in the zone.
To learn more about " Entry signal " and the special version of our " Price Action " strategy FOLLOW our lessons:
Take Profits:
TP1= @ 0.000743
TP2= @ 0.000827
TP3= @ 0.000888
TP4= @ 0.001004
TP5= @ 0.001122
TP6= @ 0.001288
TP7= @ 0.001500
TP8= @ 0.001710
TP9= Free
4600 next 2 weeks 1 week chart shows sar will most likely turn green in a few weeks price rages 4k 4200 even 4600 target back to predump prices at 6400k

4hr deathcross nears…can 2 bull patterns be enough to reverse itWe currently have 2 4hr chart bull patterns forming a little falling wedge bull pennant pattern(in yellow) and a potential small 4hr inverted head and shoulders pattern....a breakup at the right point from the falling wedge pennant could give the bulls enough breakup momentum to get above the neckline of the 4hr inverted head and shoulders and even potentially trigger it...if this were to occur we could see a brief trip back up to the 3950 range. However even if this were to occur I don't think the momentum will be big enough to prevent the 4hr death cross or even flip it quickly back to a golden cross...so while both these patterns may very possibly break bullishly I think the end result is still going to be a sustained 4hr death cross and a bearish drop in price action to go with it. If they don't break bullish and it just continues to break down from here then I think we may see a double bottom bounce at the 1 week chart's 200ma around 3260 or so...if we do break upwards and hit the inv h&s target of 3950 or so there may be enough fomo generated at that point to get above the neckline of the much bigger inverted head and shoulders pattern around 4k at this point...I could potentially see this setting a huge bull trap at this point and if we did inch above the neckline I think there would be such a spike in longs that it would set the perfect bull trap for a big capitulation candle inv h&s fakeout crash from there...one that could drop to 2.8-2.9k or possibly even lower. Of course I always gotta also factor in the slim possibility however that it could actually legitimately trigger that bigger inverted head and shoulders pattern as well and take us to over 5k but that seems very improbable at this point especially with the 4hr deathcross on track to happen in the enxt 8 hours or so. Of course with crypto nothing is impossible so I can't discount the possibility entirety. Thanks for reading and understanding this is not financial advice!

diamond bottom now diamond kite bottom; same target as bull flagI see confluence in the current bull flags breakout target and the price target of the diamond kite breakout giving me confidence we will hit tis target...in order to do so we will need to break above the inverted head and shoulder neckline...while I think we will come within at least 1-2 pips of this price target I'm not so certain on whether or not we will actually trigger the inverted head and shoulder breakout....if we were to come close to hitting this target and then had a sudden huge whale dump right after the candle that reached the trget could still close under the inv h&s neckline and cause a fakeout/dump instead. I will be paying very close attention to the volume levels once we get near the price target...if we do indeed trigger the inverted head and shoulder pattern afterwards we can climb as high as 5.2k also a possibility we stay just above the neckline or dont even get above it before a dump. Best to consider all bearish and bullish outcome potentials to be best prepared for which direction it decides to ultimately go. I'm still anticipating one last capitulation dump candle but that could come immediately or not until we reach 5.2k it could even continue up one more leg after 5.2k before the capitulation dump and also a slight possibility capitulation has already happened...so best just to play the charts for their current condition instead of trying to be certain of thigns that are still speculation at this point.

VERIBTC , Veritaseum would probably begin a new uptrend !!VERITASEUM/BITCOIN
Technical analysis:
VERITASEUM/BITCOIN is in a range bound and Beginning of up trend is expected.
The price is below the 21-Day WEMA which acts as a dynamic resistance.
The RSI is at 37.
Trading suggestion:
*The price is in a range bound, but we forecast the uptrend would begin.
*There is possibility of temporary retracement to suggested support zone (0.0111 to 0.0080), if so, traders can set orders based on Price Action and expect to reach short-term targets.
Beginning of entry zone (0.0111)
Ending of entry zone (0.0080)
Entry signal:
Signal to enter the market occurs when the price comes to "Buy zone" then forms one of the reversal patterns, whether "Hammer" or "Trough" , in other words,
NO entry signal when the price comes to the zone BUT after any of reversal patterns is formed in the zone.
To learn more about "Entry signal" and special version of our "Price Action" strategy FOLLOW our lessons:
Take Profits:
TP1= @ 0.0150
TP2= @ 0.0186
TP3= @ 0.0210
TP4= @ 0.0270
TP5= @ 0.0408
TP6= Free

Consolidation station.It is looking it will consolidate for quite some time, however, they have just acquired the license for a facility in Aldergrove B.C. It will be interesting to see if it remains bearish during the primary phases of that operation. There's an indication it might retrace the .236 Fibonacci, where it intersects the upward trend line at this point, because support has already been established twice there. Hopefully it bounces off and keeps going in the right direction.

BC- Flag or Double TopHigher low today may be an area to short against, but a hold against the bottom between highs and a break of the higher lows trend could send this stock higher.


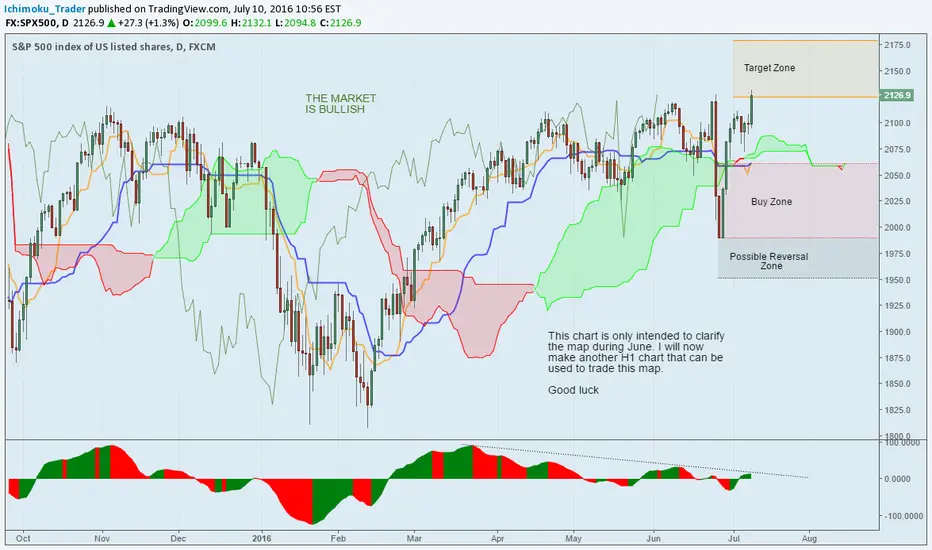

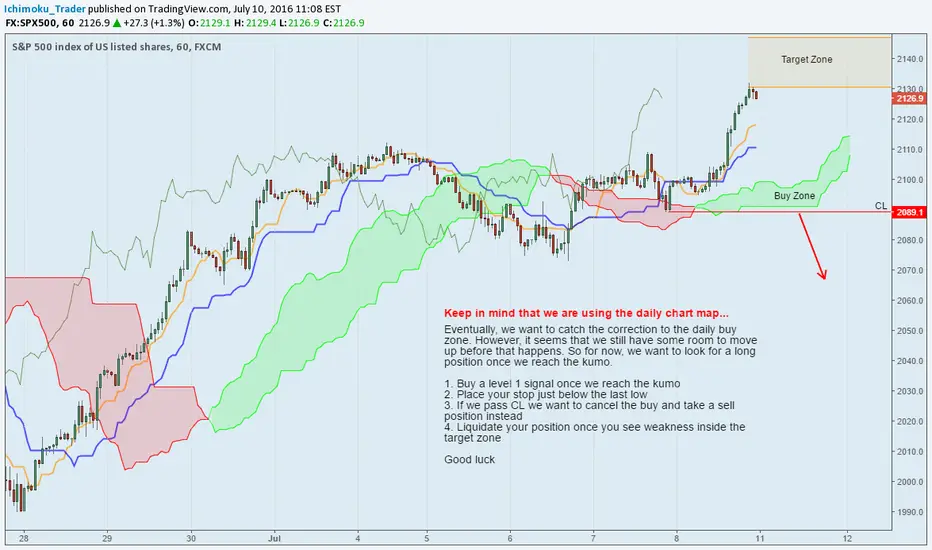


WOW .. Not 1 BUT 2 Trades...INSERT TEXT IN "GOOGLE TRANSLATE": translate.google.com
Trade 1:
1. Wait for price to retrace to the sell zone.
2. Sell a level 1 signal with stops just above the last high. If you get stopped repeat unless we close above the kumo
3. Target the buy zone
Trade 2:
1. Once inside the buy zone buy a level 4 signal
2. Stops just below the last low
3. Target to be decided
Good luck

Going down...Don't miss today's webinar with @Fxprotrader on harmonic patterns! He will show you how to draw them (Fibonacci ratios), a simple way to identify them into the charts and most importantly which qualify to trade.
Please register using the link below:
attendee.gotowebinar.com
