BCH

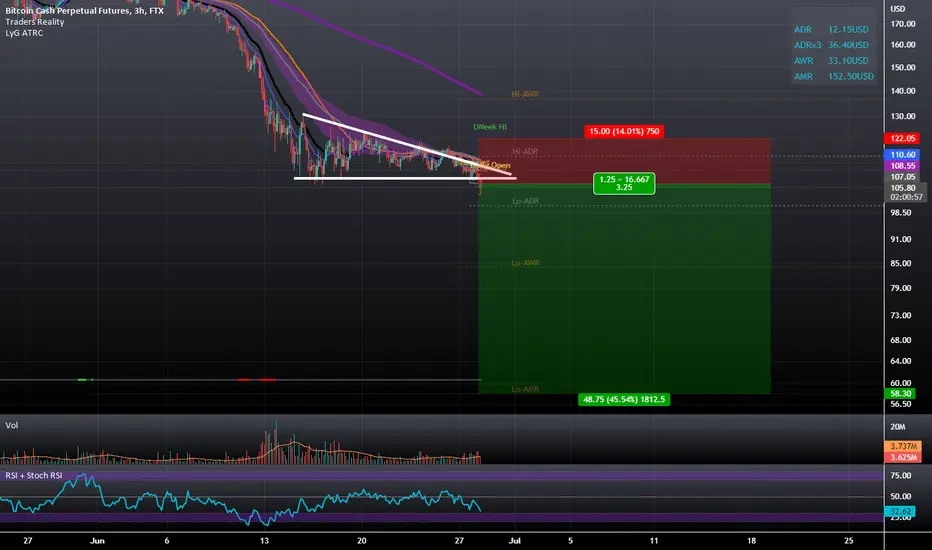
Bitcoin Cash: Strong Downtrend (Possible Gap Lower)The Williams Alligator moving averages have fanned open, indicative of strong bearish momentum.
Looking at the chart, there is a likelihood that BCH (and all other cryptocurrencies) are about to gap lower. If this occurs, we're looking to short BCH down to $64.

Long BCHBCH has moved in a descendant channel for more than 3 weeks. It broke now this channel and ready to go upward. The RSI broke also its trendline. In 1D TF, we can see a bullish divergence (see screenshot below) which reinforce the (short-term) reversal.

BCHUSDT 1H: Possible SHORTOn the hourly chart, #BCHUSDT has the potential for an downtrend to 106$
SL 110.10$

Bitcoin Cash 165% Target On 10X Lev. (Over 1500% Potential)We have the Bitcoin Cash (BCHUSD) trading pair before the bullish signals are really in, we are early...
Notice the marked candle, 30-June.
This is a reversal candle.
Now, after the reversal signal how do we know if there will be follow up?
Notice the immense volume yesterday...
Can you see it?
That huge green volume bar is the confirmation.
We see BCHUSD growing.
We are active with 10X.
165% total growth on 10X can lead to 1500%+.
Remember, this is not financial advice.
We only share what we see coming from the charts.
Leveraged trading is ultra-high risk.
We recommend spot trading only unless you are an expert.
Thanks a lot for your continued support and remember to leave a comment if you have any questions.
Namaste.

Recurring Pre-emptive Moonshot StructureThis structure is all over the place LTC, LINK, Bitcoin Cash and these two, Status (SNT) and NEO
I am assuming it is a pre-emptive bull moonshot structure, so all these coins can moon at the same time
Observational post
Links into one of my previous posts below

Will Bitcoin Cash see $25.00?BCH has always followed in the foot steps of Bitcoin rightfully so consider BCH is a soft fork of Bitcoin itself, hence the name Bitcoin Cash. Over this past cycle Bitcoin Cash has managed to perform above average in my opinion. I am one of those people whom believes that BCH will follow the price of Bitcoin itself and will one day be worth over $20K although that depends heavily upon financial regulations that could unfortunately put an end to BCH, an highly unlikely scenario, but none the less could happen.
Now the purpose of this chart is to show the major downward angles and how BCH is building them into support. It appears as if we have made it out of a strong resistance barrier. Although we are hovering around $101.20 as of the time of writing this. I am not to optimistic about the price of #BCH at this moment I am eye balling the low at around $25 to $75
We can see on the chart that BCH seems to be stuck below the $103.00 resistance level and is looking to take a leg lower. I am going to go out on a limb here and say that Bitcoin Cash will be dropping some time before Wednesday. I normally don't throw a day out like this, but I feel confident saying that considering all the charts and news that I have reviewed recently.
I also have a nice buy order set up below $25 In my opinion if Bitcoin takes this next leg down as I have been expecting than we will see Bitcoin Cash do the same as well. When this happens Bitcoin Cash should bottom out as well. When Bitcoin itself was around this point age wise on a lot of exchanges the price dropped to .01 cents for a moment. I would of liked to have bought #Bitcoin at that price, but I didn't get a chance to.

BITCOIN CASH 100 DOLLARS?! REBOUNCE 🚀Bitcoincash on a 100 buks in 2022 i letterly insane.
Never tought to see 100 bucks ever again.
Those who are looking for an entry point, you got one now...
I basically piss a 100 bucks, im buying no doubt! What a world... 😆

Important BCH Support BoxHello to all members of TradingView and my followers.
BCH recorded its 11th consecutive weekly bearish candle last week, with a minus 9% drop.
As long as the price remains within the support range of $103-$93.6 and the market trend breaks out of bearish mode, there is potential for the price to rise rapidly within the current range.
If it is helpful to you, please like it. If you have a comment, I'll be happy to know. Respectfully.


BCH The Forgotten SoldierBCH is the first fork of btc with a real world usecase. Fast transactions, adoption, you can buy/pay with it, etc.
Right now we have Bitcoin Cash at the major support and ATL of 2018.
Weekly RSI at 25, I expect a bounce once Dxy, spx, nasdaq and btc bottoms.
It has a chance to go at 80$ and lower if bitcoin goes sub 17k of course.
Starting to accumulate BCH at 100$ and below. It will have its pump day.

BCH Breaking Down a Descending Triangle and Losing to LitecoinThe LTCBCH pair has been showing signs of bullishness for many months now and in that time LTC has rallied while BCH has gone down and stood still now we see here BCH is breaking down a descending triangle while LTC is still trading near the highs of the rally. I expect that we may see BCH meet Litecoin halfway and come down near the $30-$65 price range as LTC either slowly goes down and consolidates or as LTC potentially goes up and surpasses BCH.
BCH camarilla pivots monthly futurethese are the next BCH camarilla and monthly pivot levels. I expect a reversion up to the Pivot or H3 before more downside

BCHHello everyone, today I sorted out the BCH coin, this pair made good savings, and now it is under the resistance line, I don’t see the reaction now, I will take it on the demolition of stops, I showed it in more detail on the chart, I also noted the level where there will already be violations of the scenario, I will throw a limit wait for a reaction. Have a nice day and trading

BCH is breaking outBCH breaking out its trendline and promises a rally.
Breakout is confirmed with a 4H candle closing above the trendline.

BCH - Your time to shine⭐️Reasons to take long if BTC will be bullish:
⭐️ Range for 10 days
⭐️ Trendline is clean
⭐️ 5th touch
⭐️ Price is squeezing to the level
⭐️ Volume at bottom
⭐️ 40 ATR
⭐️ Over VWAP
Will enter when price squeezes to the level on 5m timeframe, the base will form and the tape will get faster.
If you don't understand the previous sentence, just use swing stop-loss 3-5%
Fix profit by parts:
1% - 1/3
2% - 1/3, stoploss to breakeven
What's left, hold to the maximum
What do you think of this idea? What is your opinion? Share it in the comments📄🖌
If you like the idea, please give it a like. This is the best "Thank you!" for the author 😊
P.S. Always do your own analysis before a trade. Put a stop loss. Fix profit in parts. Withdraw profits in fiat and reward yourself and your loved ones

Bitcoin Cash To Grow Strong (70% Mapped Short-Term)We have Bitcoin Cash starting to wake up...
We are looking at the BCHBTC pair.
We have this descending channel which is very likely to break soon but still holding.
Today we have a new All-Time Low followed by a recovery while prices lurk above EMA10.
I believe we already looked at the bullish divergence with the MACD and RSI...
Once we reach bottom... What follows is UP!
Bitcoin Cash Ready To Grow!
Namaste.

Bitcoin Cash Oversold, Bullish Divergence + ATLBitcoin Cash hits a new All-Time Low while at the same time hits oversold on the RSI.
We have a strong bullish divergence with the MACD.
Based on other market factors not visible on this chart, we believe that Bitcoin Cash can bounce at this support level.
The last low around $107 should be the stop-loss in a manual way as we use it.
Any trading above this price and we are strongly bullish.
We are active on this one with leverage as well.
This is recommended for experts only as leveraged trading is ultra-high risk.
We are also active on this pair through SPOT trading and the BTC pairing below.
Remember to hit like, follow & comment for more.
Namaste.

LTC On Track to Outperforming The Rest of The Crypto MarketAs i would have hoped LTC has recently begun to outperform other coins as a few months ago it showed an edge against Bitcoin Cash and has since significantly risen in value against BCH; Along with that we've also seen LTC make big gains against Ethereum and now we're finally seeing it move against BTC even during this bear market. if all goes smoothly we will see LTC front run the market and gain significant marketcap dominance.
Link to the LTCBCH chart are in the related Ideas tab below.

Bitcoin Cash Descending Channel, New ATLBitcoin Cash vs Bitcoin (BCHBTC) just hit a new All-Time Low while trading within a descending channel.
We believe that this new low will work as support and can lead to a trend reversal.
The last low at 0.005210 should work as the stop-loss.
A full candle close below this level and the above analysis is invalidated.
Trading above this level opens the door for growth (green arrow).
Stay patient.
The cryptocurrency market will recover.
Bitcoin is also preparing to grow.
Namaste.

BCH scalp - bounce from zone of interest📈Reasons to take short
⭐️ Buyer on BTC
⭐️ We came to liquidity zone
⭐️ Volume increased
⭐️ 3rd touch
⭐️ 110 ATR
Will enter when price squeezes to the trendline on 5m timeframe, the base will form and the tape will get faster.
If you don't understand the previous sentence, just use swing stop-loss 3-5%
Fix profit by parts:
1% - 1/3
2% - 1/3, stoploss to breakeven
What's left, hold to the maximum
What do you think of this idea? What is your opinion? Share it in the comments📄🖌
If you like the idea, please give it a like. This is the best "Thank you!" for the author 😊
P.S. Always do your own analysis before a trade. Put a stop loss. Fix profit in parts. Withdraw profits in fiat and reward yourself and your loved ones

Bitcoin Cash BCH short Entry Range, Take Profit and Stop LossBCH/USDT
Entry Range: $130 - 145
Price Target 1: $119
Price Target 2: $105
Price Target 3: $95
Stop Loss: $167

Is shorting the way to go forward for BCH tradersBitcoin Cash has been subjected to heavy sell-offs in the last six weeks post an up-channel (yellow) breakdown on 30 April. The price has been hovering near the lower band of the Bollinger Bands (BB) for the most part ever since.
A convincing close below the two-month trendline support (yellow, dashed) would open doorways for an extended retracement. Any close below the $148-zone would delay the bullish revival chances in the near term. At press time, BCH was trading at $151.9, down by 7.75%in the last 24 hours.
Given the aggregated fear sentiment, it has been relatively simple for BCH sellers to find fresher grounds to rest on. A reversal from the $362-zone in April chalked out a two-month trendline support on the daily timeframe.
Since then, the coin has been on a steady fall. The broader liquidations pulled BCH down to its 27-month low at the time of writing.
With BB’s lower and upper bands looking opposite ways, the bears would now strive to push for a high volatility phase in the coming days. As the trading volumes were in a decline phase, the trend was yet to take a compelling shape.
Any close below the 148-support would pull BCH for a further downside toward the $136-level. Post this, the bulls would likely aim to counter the selling pressure for its multi-yearly lows. A near-term bullish revival would likely be short-lived by the south-looking basis line of BB.
