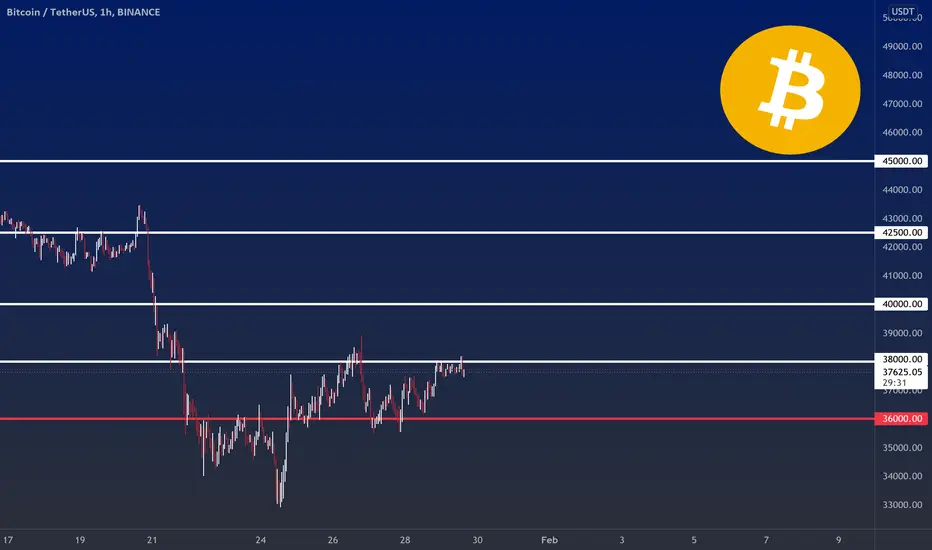
BITCOINOn an hourly TF, Bitcoin has reached a critical resistance of $38,000 and has strong sellers due to the price movement structure, and to confirm an uptrend, you can enter $38,000 for the $40,000, $42,500, and $45,000 targets with a correct break of $38,000.
BCH
BSVUSDT SHORT - LONGLooks to me BCH didn't find bottom yet. Two levels to watch and even butterfly pattern can be filled.

BCHI do not prefer presuming about future and also analyze in a way which could be a trading signal. Hence use your ideas according to market and your trading system.


BCHUSDTHello Crypto Lovers,
Mars Signals team wishes you high profits.
We are in the daily time frame. Te price has had a sharp fall in the bearish channel. It has shown reaction to the S1 line. You can set a Buy order here for the R1 area which is a supply area and also R2. The S2 zone is also another good area where you can set another Buy order. You can set two Buy orders. One at the S1 line and the other at the S2 zone for the next resistance.
Warning: This is just a suggestion and we do not guarantee profits. We advise you to analyze the chart before opening any positions.
Wish you luck

BCH is about an easy 120% longtarget is 181 and you can leverage 20x if you want also i think, it may doesn't go up fast because of btc dump if it happens at that point of time but this price is very good price to buy to see what happens so, you may hold for an easy +100%

⚠️ Read this if you trade ⚠️The impact of the subconscious and emotions on trading with simple solutions.
Why can't we make a profit even though we have a correct analysis of the chart?
Why does the price return from where we sell it?
Why do all those who enter with a small volume make a profit which is also a small one, but when the same one is entered with a large volume, it becomes a loss?
Why do we get scared and sell soon?
Why are we so hopeful when we are at loss, but still close our position in the same situation?
Maybe these and similar questions have arisen for you in your trading, but where is the problem?
Why is it that even though we know everything and predict everything correctly, we still don't make much money?
The answer to all these questions lies in the subconscious. As you know, the subconscious is programmed by us, and an important duty of the subconscious is taking the necessary actions when the conscious is not able to, and these actions are taken according to the plan.
The ones we give ourselves come into being.
The subconscious mind usually appears when we are experiencing emotions (happiness, excitement, fear, anger, sadness, etc.) and takes the necessary actions.
For example, when we make a lot of money, we feel happy, and from here on, the decisions are based on emotions, or when we lose and get upset or angry, and from now on, our decisions are still based on emotions.
So here is the problem.
What is the solution that emotions take the permission to function correctly from us and we can not do the necessary work properly?
In order to solve this problem, we must point out the cases that cause emotions to be extremely dominant and decisions to be sent from the subconscious.
1- No entry strategy: Many only listen to the news for trading, which is certainly harmful, there is news for friends who have no entry and exit strategy, and they are the first group to be easily preyed upon by whales.
What is the strategy? Strategy means selecting an entry, exit, and stop-loss point based on specific techniques and conditions. This is done before entering and opening the position. The problem is that many of us only think about the entry point and we never know where we are going to sell. We just want to sell whenever we go up a little, or we may even have a price for sale, but we do not place an order for that price, and we want to sell whenever it reaches that price.
Rest assured, in the second case, you will never sell at a good profit because the subconscious does not allow it, and a voice in your ear says: it is going up, do not sell!
So strategy in one sentence means knowing what I am doing and to know how much I will gain before I enter a share or cryptocurrency and also if I've made a mistake, how much I will lose.
So if you do this before buying, you won't have to deal with feelings and you will find the correct and logical points to enter and exit.
If you are going to decide what to do after the purchase or when you are at a loss or a profit, be sure that all your decisions are made unconsciously. And you can not have the correct performance and in 90% of cases, your position is closed with a loss.

Bitcoin Cash - BCH - Seriously BullishI Can see a 138%^ Projected bullish uptrend in the coming months, you will see.
The block size being increased will allow for this to accelerate.
COINBASE:BCHUSD
KRAKEN:BCHUSD
BINANCE:BCHUSD
BITSTAMP:BCHUSD
BINANCEUS:BCHUSD
BITMEX:BCHUSD
FTX:BCHUSD
PHEMEX:BCHUSD
BITTREX:BCHUSD
GEMINI:BCHUSD
TRADESTATION:BCHUSD
CAPITALCOM:BCHUSD
POLONIEX:BCHUSD
As you can see from various Ideas I'm never wrong.

BITCOIN - What could happen next?On a daily TF, as I expected, we saw an increase in volume in the areas of $35,000, which could lead to a short return, but this increase is not enough to return to the general trend, and after the return, It will have a downward trend again.

BITCOINThe trend of Bitcoin is negative, and there is currently a re-testing of the $40,000 range; if you are going to sell, do it in that range; Because the bears will push again. After testing $40,000 and the next drop, the market will return if the market reacts successfully from $ 30,000 to $ 33,000.

Bitcoin Cash (BCH) Buy ZoneBitcoin Cash (BCH) Buy Zone
--------------------
BIAS
Mid-Term : Bullish
Long-Term : Neutral
Risk : Medium
With the bigger picture remaining bullish, the shorter time frame picture has become pretty grim for the bulls. Currently ranging at around $290, Bitcoin Cash has reached the major long-term support we've been forming for the last 3-4 days and one that when broken trend-line will determine where we'll be heading to all targets for the next two weeks.
--------------------
$BCH/USDT LONG SETUP
Leverage : x3 - x5
Entry Price : 270 - 295
TP 1 : 304
TP 2 : 317
TP 3 : 331
TP 4 : 360
TP 5 : 384
TP 6 : 405
TP 7 : 431
TP 8 : 472.5
Stop Loss : 244
*Maximum 3% of Portfolio.
*Unload 12.5% at each TP. Whenever TP 2 hits, Move stop loss to entry.
--------------------

Bitcoin Cash? More Like Bitcoin CRASH!Bitcoin Cash (BCHUSD) has continued to pull back lower and sharper. We have hit a support at around 262, which may be the final low for our GREEN primary pattern.
Green Primary Pattern
Breaking the December 3rd low tells us that we are now pulling back deeper in a more conventional 5-wave C-wave instead of a 3-wave zigzag. If we are done with the correction or close to done, we'll have a to see a sharp impulsive 5-wave structure up really soon! Seeing anything other than this would more or less invalidate the GREEN pattern.
RED Alt Pattern
Turning back up and rallying in a clear 3-wave structure would make it very likely that the RED is the primary pattern in operation. This would call for a corrective bounce back up before a much deeper crash to complete the larger impulsive C-wave down. However, I am seeing this as a smaller and smaller possibility as this leg of the pullback is getting too far stretched downward to be counted as only a 1st wave. Breaking below 219 makes it far more likely that the PURPLE pattern is in operation.
PURPLE Alt Pattern
Stretching directly lower would instantly make the PURPLE pattern our primary. While the chart shows BCH going as low as 115 or so, there are several strong Fibonacci confluences below, any of which could form a bottom. The 186 extension is the point at which the C-wave would be the 1.00 extension of the preceding A-B structure, and this is typically the strongest possibility for the end of a correction. Seeing any kind of impulsive 5-wave rally upward would likely signal the end of the PURPLE correction.
Check out my YouTube explainer vid on BCH!
I use Elliott Wave analysis to project price levels for different assets and asset classes. EW is a form a technical analysis that is absolutely NOT based on fundamentals. Please be aware that this is not intended to act as financial advice. I am not a trained or certified financial professional. You may invest based on a strategy tailored to your own skill and risk-tolerance levels.
#bitcoincash #bitcoin #cryptocurrency #bitcoinmining #bitcoinnews


BCH Bitcoin Cash to test the support lineBCH Bitcoin Cash is close to test the important support lines and most likely it will.
What is the utility of those Bitcoin forks anyway?!
Aren`t they useless?

BCH at support channelBCH price is at ascending long term support zone, it is possible to break out from descending resistance line then pullback to $250 that is around a support zone.
and then head up to resistance zone that is the same with descending trend line

BCH - Hold the line - Where to buy and upside targetNeed to hold the trend or risk move to buy zone and support below.

$BTC to $BCH Swap$BCH support vs $BTC and $BCH support vs $USD evidence of possible paradigm shift away from a store of wasted effort. My nearest crypto ATM takes $BCH for Dollars, but not $BTC. What does your nearest merchant/ATM take?

Keep an eye on support and resistance levelsOn a daily TF, It breaks the major support of $ 150 and now trading below it. The first resistance for SOL is the $ 148 - $ 152 area, and it needs to go above it to gain some bullish momentum. If it is rejected from the $ 148 - $ 152 resistance area, we see a test of the major support of the $ 125 - $ 130 area. SOL needs to hold the support. Otherwise, we may see the price going below the $100 area.


BCHUSDTHello Crypto Lovers,
Mars Signals team wishes you high profits.
We are in the daily time frame. Here is the S1 support line which the price has hit several times and was supported. Now also it is ranging close to it. You can set the Buy order at the S1 line and keep the Stop Loss. If it falls below the S1 line, then there would be more falling. You can sell half of your assets at the R1 line and the other half at the R2 line. If it breaks the R2 line then it can see higher prices.
Warning: This is just a suggestion and we do not guarantee profits. We advise you to analyze the chart before opening any positions.
Wish you luck

What will happen?Ethereum is involved with the support of $ 3,600. If it can maintain this support, #Ethereum will test the $ 4,150 level again. Note that ETH needs to break the $ 4,150 resistance to growth in the short term. Otherwise, it could move in the range between $ 4,150 and $ 3,600. If Bitcoin loses $ 46,000 and drops to around $ 40,000, #ETH could test the levels of $ 3,400 and $ 3,200.


BCH - 2 levels To check out Hello trading friends,
This is a small update for BCH.
BCH is an interesting zone for possible new gain. this depend also on the BTC market.
We could see depending on the simple TA trend that BCH could return to the zone of 400 USD coming time.
If we get a new increase on BCH, then are the next 2 levels very important for a time frame.
Have a great day.
