BTC (Update)BTC broke our resistance level $32177 but as I have mentioned earlier, even though BTC breaks the resistance level, it still needs to break the 100 DMA and the upper trendline.
Currently, the 100 DMA is denying the BTC price and we can see it getting rejected.
Could this be a rejection back to Support 1 or a breakout above the $33k? Let's see!
BCH

BCH/USD - Wave 5 in case of a bullish continuationIn case of a bullish continuation and a wave 5 together with bitcoin, this could lead to a 3k-5k in price considering the fibonacci levels.
It is not certain yet that a wave 5 will follow. If bitcoin does not manage to proceed with a wave 5 during the next month or two, this idea might get invalidated.


A Wonderful Buy The Dip Opportunity of Bitcoin Cash (BCH)Down channel:
On the daily time frame since the month of May 2021 the price action of Bitcoin cash is moving in down the channel. After hitting the support of this down channel on 22nd June the price line reached the resistance and for the past several days, the price action is still moving at the resistance of this down channel and not reaching the support again.
Support and resistance and SMAs:
On the weekly time frame it can be seen that after getting rejected by the strong resistance of $1,600 the price line of Bitcoin cash has moved down drastically. It can be also observed that priceline has finally found very strong support at $400 level and this is key level support for the price action of BCH. Because previously it has been working as a support and resistance as well.
Now the next resistance is at $600, $750, $1000, $1600, $1800, $2200, $3000 and $4000 respectively.
At the same time, the price action is also moving at the 50 simple moving average support and after that, we have the 100 simple moving average support on the same weekly time frame chart.
Big shark:
On the 4-day chart, the price action o BCH has formed a bullish Shark pattern. The priceline has already visited the oversold zone as it was dropped up to $468 and moved up. However, this time the priceline has completely entered the buying zone of bullish Shark and giving another chance to catch it from the buying zone of this pattern. There is also 100 simple moving average support in the potential reversal zone. The buy and sell targets as per the Fibonacci sequence of this bullish Shark are:
Buy between: $530 to $340
Sell between: $789 to $1265.42
The maximum extent of the potential reversal zone at 1.13 Fib level can be used as stop-loss which is $340. As per the above targets, this trade has a profit possibility of 270%, and a high loss possibility of up to 36%.
Conclusion:
Even though recently the price action of Bitcoin cash faced strong downtrend on the short-term and the mid-term. But the way the price and is moving at the resistance and making several attempts to break out the resistance of the down channel and the formation of a very big bull Shark are signaling a massive break out soon.

Bitcoin Cash (BCH) formed a bullish BAT for upto 18.5% moveHi, dear friends, hope you are well and welcome to the new update on Bitcoin Cash (BCH).
On the daily time frame chart, the price line of BCH has formed a bullish BAT.

#HEX is running away is 29 cents incoming!!!this seems to be a bear market
I hope for a V shape recovery
but it may only be a bounce
but HEX is a runaway BULL Market

BCH 1D Waiting for Bitcoin Cash at $20,000 and there is no typo)In our portfolio of ideas, a series of accurate predictions for the BCHUSDT pair have gathered, it's time to continue it)
In January 2021, we wrote about buying BCH at $380 and possible sales at $1200
Further in May, they wrote that growth to $1,700 is still possible, and this is what happened, after which the cryptocurrency market collapsed together.
The price of BCHUSD fell by -77% - a lot, but another thing is interesting, the fall was aggressively bought off twice from $380-400 .
That there is an aggressive buyer, we wrote in the previous ideas.
This combination of information suggests that the real bull run on the BCH chart is yet to come.
We think that below $400, buyers will not let the Bitcoin Cash price drop, that is, it is logical to try to gain longs with a grid on a spot in the $400-450 zone.
The first top targets are $1500-1650.
Correction to $750 and you can dream of moving towards ATH, which is close to $4000.
If the holders of 2017 say: $4000 is not enough for us - this is just our break-even point, but how can we make money?, We will say - it is not a problem)
For you, the market has the levels for growth of $12,000 and $20,000 , respectively)
We will take this global idea as a basis and as we grow, we will add additions to it.
Therefore, write a comment under the idea and put like for that you received update notifications in future
_______________________________
Since 2016, we have been analyzing and trading the cryptocurrency market.
We transform our knowledge, trading moods and experience into ideas. Each "like under the idea" boosts the level of our happiness by 0.05%. If we help you to be calmer and richer - help us to be happier :)

⚠️ HOW TO LOSE your money in a day? ⚠️Hey guys,
I know I've made a chart like this before, but this version is more complete.
We all see too many people having the satisfaction of losing their money every day and sometimes it happens to us too. I think it's best if we share with other people how it's done.
There are 10 effective and original ways to do this:
1. Panic Sell:
This one is a classic. They say "10 years in the forex & stock market is 1 day in the cryptocurrency market".
That's because this market has too many changes in a short time.
Bitcoin literally can pump or drop more than thousands of dollars in 5 minutes, and that's when people start the Panic Sell.
They start to think: what if it drops even more? What if it touches ATH now that I opened my short position?
Well, that doesn't necessarily happen all the time. Currencies like Bitcoin have large price ranges and every single move might look like a big thing. But it isn't!
2. FOMO Buy:
Classic #2! OMG, this new coin just pumped ten times! Ethereum is pumping. What if it reaches 10K? Cardano passed $2. I should get a ton of it and sell around $2000! Bitcoin is going to reach 1 million dollars this weekend!
If something pumped so high that it got your attention, don't you think it's a bit late already?
(I think I made my point here)
3. Don't use Stop Loss
We all know how it feels waking up to see that the market touched our Stop Loss and pump right back up.
Using Stop Loss is very important if you want to protect your assets. If you're willing to protect your positions then you should learn how to play with them, control the risk, know the dangerous zones, be aware of the price range.
If your coin's value is dropping under the predicted area, using SL isn't a bad idea! If you're a true player, then you can recover in no time.
4. Use high leverages
I WANT THAT 50 THOUSAND DOLLARS RIGHT NOW! I'll just set my leverage to 125x. I'm sure Binance won't mind it!
Guys... The safest leverage amounts are 20x or below. If you can't afford to lose the money you shouldn't open a position with more than 20x. Give that price range a little room to breathe. People who are more confident about their forecast and predictions use higher than 20x up to 75x or even 100x! The higher the leverage, the more risk you put your portfolio at.
5. Buy new hype coins
I love this one! I see it every day.
That CEO launched a coin. This CTO made a spite coin. That guy with a big Twitter account mentioned this name. That coin is named after a dog... I LOVE DOGS!
PEOPLE! This is your money we're talking about...! You worked hard for that money, right? Who's to say if these rummers are real? Why would a hype coin overtake Ethereum just because someone tweeted about it?
There are better ways to lose your money. Please don't use this one!
6. Get greedy
Classic #3. I earned 20%... now it's 32%, should I close it? What if it goes even higher? What if I close my position now and it goes up to 500%?
That's when we keep our positions open and then after 5 minutes, we are down 20%. Sounds familiar?
7. Draw meaningless lines on a chart
You open TradingView and WOW, hundreds of charts about different coins with random lines on them.
That's easy, right? I bet we all can do it. Se let's open a chart and then draw as we want... connect the dots? Make a Triangle? A Head and Shoulders on a '5 minutes' chart? I'm sure that predicts the market.
Guys, we can't just paint around on charts... there are rules, there are actual patterns. Check this as an example:
There are more than 50 good patterns that can be used to predict the market in different time ranges.
So that's it... Draw your favorite lines and predict the price AS YOU WANT IT TO BE, and lose a little money here too.
8. Don't use Fibonacci
I'm sure too many experts won't agree with this. But Fibonacci can help Futures traders a lot. You can just put it in the right time range and use it to find the key resistance and support levels. This method is amazing if you want to study a coin before entering for short-term trades.
If you don't, you might end up doing a FOMO Buy or Panic Sell, which helps you lose even more.
9. Believe that you are the smartest person in the room
All I'm saying is that some people do NOT let other ideas come in.
They have a confidence level is amazing. Well, that's not a bad thing, but at least listening to what other people have to say might be a good idea. Maybe they're playing the right card with a different perspective we can't see.
10. It's your turn. Complete the list.
Tell us about all the other ways you know... Share your experiences.
Thank you for your attention.

🆓Bitcoin Cash (BCH) July-13 #BCH $BCHBCH is continuously testing the $480 area but for the past half month this area has been trying to block BCH's declines. If BCH doesn't lose this zone, it will easily rise to the $600 or even $720 zone by the end of July. But if it loses the $480 zone then BCH will fall back to the $400 zone and then surge up to $720 at the beginning of August
📈BUY
🔴Buy : 465-485$. SL if B
📉SELL
🔴Sell : 585-615$. SL if A
🔴Sell : 710-740$. SL if A
♻️BACK-UP
🔵Sell : 465-485$ if B. SL if A
🔵Buy : 390-410$. SL if B
❓Details
🕯Timeframe : 1 Day
📈Red Arrow : Main Direction as BUY and SELL section
📉Blue Arrow : Back-Up Direction as BACK-UP section
🟩Green zone : Support zone as BUY section
🟥Red zone : Resistance zone as SELL section
🅰️A : The Close price of candlestick is Above the zone
🅱️B : The Close price of candlestick is Below the zone

BCH/BTC buy opportunityHi followers,
BINANCE:BCHBTC Formed higher low after big ABC drop,
Now with the break up of the Flag pattern , we maybe ready for another impulsive move up.
Don't forget to manage your risk! 👌
Good luck and trade with care 🙏
If you like my ideas - 👍 Like, 👆 follow and 👉 share!
❗❗❗
Disclaimer: This information is not a recommendation to BUY or SELL. It is to be used for educational purposes only!

$BCHUSDT wont be long to breach this support $BCH $BTC$BCHUSDT wont be long to breach this support $BCH $BTC
it looks like this support around $480 Mark is getting weaker
it wont be long to head to $440 Mark
also it looks like the corrective move has finished and soon we will be seeing an impulse move down to $440
BCH Rank:13
Marketcap: $9,102,185,079
Available Supply: 18,770,988
Max Supply: 21,000,000
USD: $484.9071
BTC: 0.01470892₿
ETH: 484.90708530
Vol: $795,911,424
Vol change: -23.4%
24h: -0.7% | 7d: 0.7%
30d: -18.0% | 1y: 99.2%

BCH broke out wedge#BCHUSDT
$BCH broke out from wedge and confirmed the resistance as support.
In short term price will go up to touch $550.
For upper targets #BCH needs to close above $552.

BTC|USDT UPDATE 🌽Hey hey my friends 👋
---
Ive been traveling and finally back at my computer it feels nice!
---
BTC update here, this is the falling wedgie i was talking about earlier!
If we get an upside break we can look to try and climb to the 40k region

NEED HELP WITH ALTCOINS?Now that we are in the middle of the correction season, lots of you might need help with the altcoins you're dealing with.
I've decided to do a few analyses for you guys.
All you need to do is CLICK LIKE, name a coin, and then tell me if you need the short-term, or the long-term analysis. And I will analyze the most mentioned coins for you guys.
Follow me to get the analysis you asked for.
Happy Trading
Good Luck
Like and Share

BCH Sell the downtrend.BCHUSD - Intraday - We look to Sell at 538.4 (stop at 561.1)
Daily signals are bearish.
20 1day EMA is at 525.0.
Trend line resistance is located at 538.0.
Preferred trade is to sell into rallies.
Our outlook is bearish.
Our profit targets will be 481.1 and 471.1
Resistance: 525.0 / 540.0 / 550.0
Support: 510.0 / 500.0 / 490.0

BCHUSDT triple top#BCHUSDT
$BCH form a triple top pattern.
to complete this pattern price have to close a 4h candle below the support zone.
If it happen #BCH will drop to $440 and $420
But if this zone support the price strongly, $BCH can go up to $430 and $440 again .

BCHUSD Curved ChannelAn idea for BCH
Included how I believe the MA's will play out, they can be identified with the arrow on the end
The curve provides a massive support
Even at the previous ATH it is a massive increase from where we are now

BCH retesting bottom of the channel.hello investors and traders.
if BCH holds the support trendline we could open a long position with a very tight stop-loss right below the trendline that makes it a low-risk setup.
it's not a piece of financial advice always do your own research.

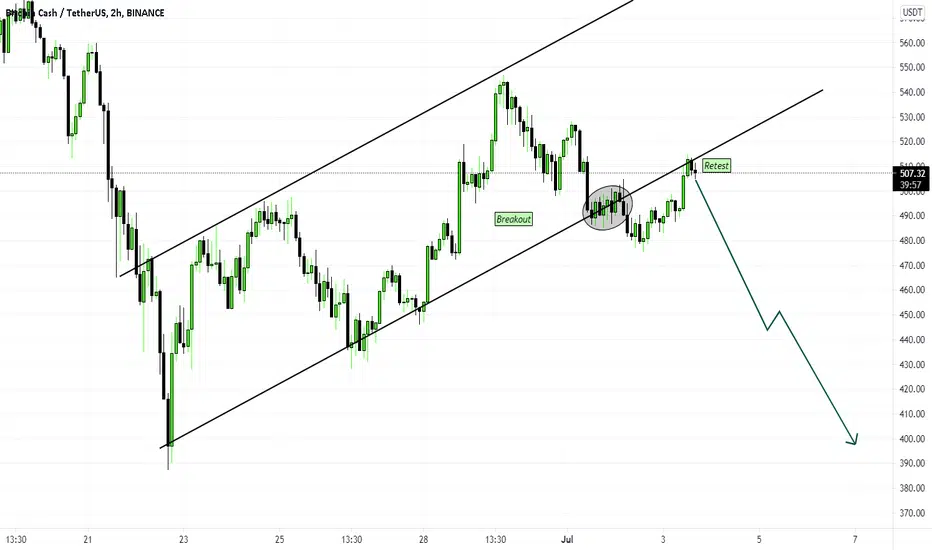
BCH > Parallel Channel Breakout > Going Down!Hi Friends,
This is my analysis on BCH.
BCH just breakout from the Parallel channel and retested. Now, It will go down till next resistance level .
Follow proper risk management and your own research.

Checking in on an old draw, from the depths the old Bear MarketWOW
Look at how we hit the 3.618 Fib Extension!
I'm not an OG Bitcoiner, but became aware of it early maybe in 2012
started doing my research on BTC in 2016 after noticing it was still alive and kicking
and the chart started to look real interesting to me in the mid $400's
and started invested and learning in 2017
we've come a long way since
many inroads & milestone have been made in that time
Now is the s curve adoption phase everything is in place for some unimaginable prices!
(not saying we wont expereince luls, dips, & "crashes" but from what heights!)

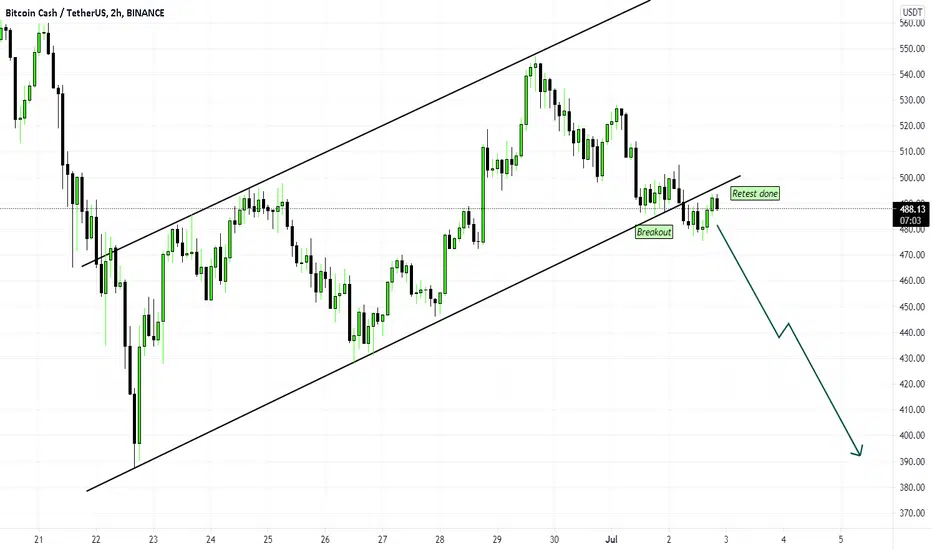
BCH > Parallel Channel Breakout > Going Down!Hi Friends,
This is my analysis on BCH.
BCH just breakout from the Parallel channel and retested. Now, It will go down till next resistance level.
Follow proper risk management and your own research.
🔥 BCH Bearish Break Out From ChannelWith BTC falling, alts are losing value rapidly. One of them is BCH.
BCH has been trading inside a bullish channel since the major sell-off at the end of may, but it appears that a new bullish period has arrived. Keep in mind that BCH is highly correlated to Bitcoin, thus a bullish move could render this break out to be fake. On the other hand, BTC appears bearish in the near future, so a move downwards of BCH is to be expected.
Happy trading!
