BCH 200MA Birth - Volatility Implied BCH has incredible potential
And this observation only exacerbates this potential
When the 200MA becomes visible, it allows the 50 and 100 to adjust to the 200's position
On the Bitcoin pair 1.618 is being tested, potential for a reversal
Incredible long term hodl
BCH

BCHUSDCOINBASE:BCHUSD is bearish. We are likely near the bottom, however, we need to wait for break to upside out of triangle.
Steps to take:
Buy at blue uptrend support OR break of $648 area resistance line if candle open close above OR multiple buy signals
Sell if candle open close below blue uptrend support
If BCH breaks down further below blue uptrend line you would buy at next support of $436 area

LTC/USDT GET READY FOR A BOUNCE 📊Hey hey my friends 👋
LTC looking really good here
Here are some short-term targets i am looking for

Learn to Read Chart (MACD & XRP)✅ The MACD line is the 12-day Exponential Moving Average ( EMA ) less the 26-day EMA . Closing prices are used for these moving averages. A 9-day EMA of the MACD line is plotted with the indicator to act as a signal line and identify turns. The MACD Histogram (Below the chart) represents the difference between MACD and its 9-day EMA , the signal line. The histogram is positive when the MACD line is above its signal line and negative when the MACD line is below its signal line.
✅ MACD's formula:
MACD = 12-Period EMA − 26-Period EMA
✅ MACD is often displayed with a histogram which graphs the distance between the MACD and its signal line. If the MACD is above the signal line, the histogram will be above the MACD’s baseline. If the MACD is below its signal line, the histogram will be below the MACD’s baseline. Traders use the MACD’s histogram to identify when bullish or bearish momentum is high.
✅ The box below the chart has 2 lines which alert traders when a crossover happens:
Crossovers are more reliable when they conform to the prevailing trend. If the MACD crosses above its signal line following a brief correction within a longer-term uptrend, it qualifies as bullish confirmation.
If the MACD crosses below its signal line following a brief move higher within a longer-term downtrend, traders would consider that a bearish confirmation.
✅ TradingView lets you use the MACD for fast and easy forecasting. You can find it in Indicators & Strategies (f(x)) above your chart.

BCH/USD LONGBCH /USD LONG
**Still waiting for entry**
This is literally the exact opposite trade to the idea I posted two days ago - which would've played out great if I had held strong with diamond hands. Lesson learnt.
Here are my reasons for looking to enter a long position on BCH /USD.
The confluences for my entry:
✓ Holding at a key level of support
✓ Double bottom with May low
✓ TD 9 printed on 2hr candle
✓ Higher volume has been entering at these lows
✓ Stochastics crossing upwards - exiting the bearish control zone
✓ Krown Stochastic indicating a buy signal
✓ RSI momentum heading out of bearish territory into neutral
Concerns;
We are still in a strong downtrend on most timeframes. Will manage risk at EMA and Fibonacci levels.
I will enter a long position with a stop loss below the wick of the reversal candle/ TD Sequential 9 after a green TD1 confirmation candle next.
** this is not financial advice **


BCH/USDT SignalEntry: 608-667
Target: 473-497-534-557-576
Lev: 3x
Stop: 700.71
If you liked my idea, follow me for more 🚀


How to LOSE your MONEY in a day!!!Wanna lose your money? Follow these steps:
1. Follow Elon Musk on Twitter
2. Panic Sell
3. FOMO Buy
4. Enter more than 5% of your assets into a single trade
5. Use high leverages
6. Buy new hype coins
7. Get greedy
8. Draw meaningless lines on a chart
9. Don't use Fibonacci
10. Believe that you're the smartest person in the room
Which one of these mistakes have you made?
Share your experience in the comments.

BCHUSD Longs are at record ATH and growing, but why?Today I noticed the spike in BCHUSD longs that has been maintained at a record ATH for weeks and growing. So I checked their website, their telegram, their twitter, and CMCal but there were absolutely no information whatsoever about any announcement or something being cooked... till a friend of mine, provided me with the link:
smartbch.org
And to my surprise, a smart chain is being developed for BCH and the test net is live since April 30th.
If you are Bitcoin Cash fan, you'd say I was living under the rock for now knowing about this. And you're right, I am not a BCH fan. But this fundamental news about BCH smart chain got my attention.
Is it time to jump onboard? Well, I will keep an eye on it... but not sure when the time is right to jump onboard in this blooded market unless a breakthrough announcement is made or BTC shows some strength.
If you have any fundamental info about BCH or SmartBCH, kindly share it below. Thank you in advance.

ETH/USDTHey hey my friends 👋
ETH here looks like we could have a possible ascending triangle but the probability that the symmetrical triangle plays out is a more valid pattern... seems to fit better for me and what the whole market is starting to draw
Spot buy orders @ these support levels

SXP/USDT ALSO KNOWS AS SWIPE 💳Hey hey my friends :)
SXP here didnt breakout like i was hoping for so i looked for another pattern that people could be looking at buying the breakout on and i found this possible ascending triangle
If you entered last break we are still good and you can ignore this

🚀₿𝙞𝙩𝙘𝙤𝙞𝙣 𝘾𝙖𝙨𝙝 at a crossroads ... 🤷♂️●● Mine scenario
● BCHUSD (COINBASE):🕐1D
"Fig.1"
The rise from the orthodox bottom of the triangle ④ formed a five-wave structure in the form of a diagonal, at least this variant of count can be applied to this structure in the context of the highest degree. The subsequent three-wave advance, which is labeled (2) , supports this idea. Cancellation of the scenario and, as a consequence, activation of the alternative wave count, - upon the breakout of the orthodox bottom ④ , the level "invalid" ..
● BCHUSD (COINBASE):🕐4h
"Fig.2"
"Fig.3"
Agree, the wave structure is extremely complex and its interpretation is ambiguous. Figures 2 and 3 show you two options for count, both of which are conducive to continued growth, the only question is: is the correction (2) formed or we are expecting a deeper rollback within the "black" count?
From the level of $ 600 there was a recommendation for a long-position. Upon reaching the levels of $ 880-1020 , we may partially reduce the volume of the long-position and prepare for a price decrease within the framework of an alternative count.
●● Alternative scenario
● BCHUSD (COINBASE):🕐1D
"Fig.4"
The global alternative wave-count suggests a large triangle in the primary wave ④ , within which a three-wave advance of the sub-wave (C) is expected.
The wave marking in the double circle parenthesis corresponds to the green marking in the circle on the chart.

VET/USDT 🔫Hey hey my friends 👋
VET has a nice ascending triangle reversal pattern that we will be buying the breakout on

BNB/USDT 🔥Hey hey my friends 👋
Looking for a break above the 200 ema on the 4hr here and then a re-test before entering bnb
Targets for bnb are high due to NFT mktplace launching soon

BCHUSDTHello to you all. Mars Signals team wishes you high profits at all times.
The price has been able to break its resistance and start moving upwards. We have identified resistance and support for you.
Warning: This is just a suggestion to you and we do not guarantee profits.
Wish you luck!

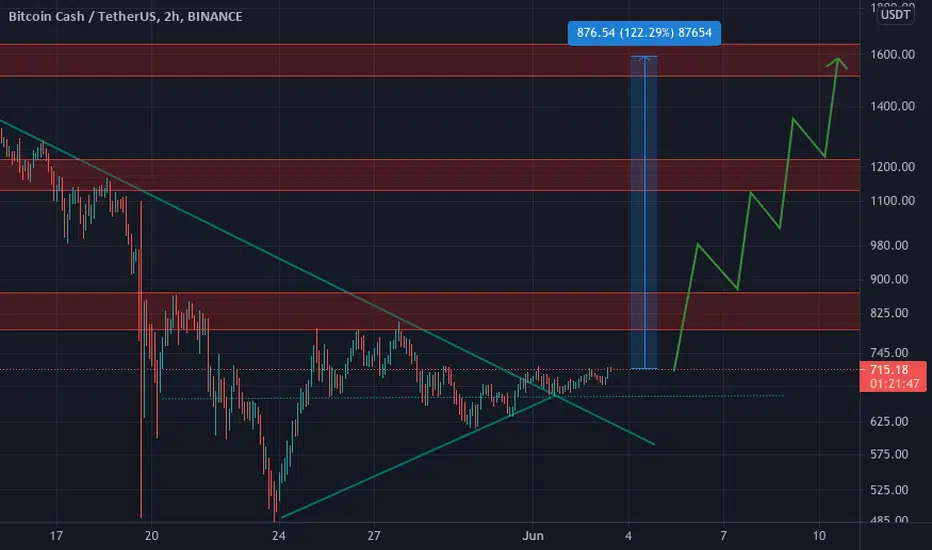
BCH / USDT -> BullishImportant trendLine and midTrendLine Breaks and Pulls BACK! , Buy and HODL for +100% Profits
Time to buy more BTCBTC is following our plan
And now it’s time for us to buy it
Near stoploss,high target…
For some one who bought it at 34k as my signal, please hold it for a long time.


Wait for Buy BTCBTC UPDATE: we are right, BTC broke out the triangle and rise up. Buy BTC now??? No No No.
We will wait for BTC retest and buy it as the chart below


BCH/USDT LIMIT BUY SIGNALThe Bitcoin Cash long-term uptrend might continue from this point onwards. But we are looking only for one wave for the take profit target.

SXP/USDT ALSO KNOWS AS SWIPE 💳Hey hey my friends 👋
Looks like sxp wants to go and btc is playing nice also
