BITCOIN CASH Might start attracting buyersBCH/BTC recently broke above 200 Moving Average, which is a good/bullish sign. Now after the correction, price could be very attractive for a mid term buy.
BCHBTC


BCHBTC - H&SBCHBTC - H&S
Open Short at 0.0321
Close at 0.0301
Stop Loss: 0.0326
Risk/Reward Ratio: 4

BCHBTC - Ascending WedgeBCHBTC - Ascending Wedge
Open short at 0.0336
Close at 0.0296
Stop Loss: 0.03451
Risk/Reward ratio - 4.4

BCH approach resistance, shortHello, Dear all
BCH approach the resistance ~ 324, potential opportunity to short, the next resistance ~ 340.
BCH/BTC in support region, watching closely if break or hold. if it breaks, worse for BCH.
Support / profit take in : ~310, 300, 280

Cryptocurrency Majors AnalysisAnalysis of the Bikini Bot signals and bias for the major cryptocurencies.
If you are interested in joining the signals channel please message me or go to www.bikinibotcrypto.com and sign up!

Bitcoin Cash (BCHU19) Same Setup (BitMEX Leveraged Trade)Bitcoin Cash (BCHU19) is no exception, this setup is very similar to the one we just shared for ADAU19 which you can find in the related ideas below.
The signals are simple and as follow:
Break above resistance in the form of EMA5, EMA10, and EMA50.
Bull volume growing (above average - highest in the past 4 days)
Bullish RSI.
Higher lows...
Now, please remember that even with this setup, many bullish signals and bullish action already on its way, any trade/chart and still break down, so make sure to always have a plan and stop-loss in place when trading.
This is for experienced/advanced traders only... If you are a beginner, please check the Altcoins trades (Binance, Bittrex, Poloniex, KuCoin, Huobi, CoinEx, etc.).
Feel free to hit like to show your support.
Namaste.

Bitcoin Cash Elliott Wave Trade Set UpBCH finding support at the 200 day MA and 2019 trend line.
BCH 1D RSI oversold.
BCH 1D bullish slow stoch cross.
Target $550
note: may go higher

Looks like the bears are getting tired.After three attempts to make new lows versus BTC, the bears have been exhausted. Unless a huge slam comes soon, the bulls will take over and we'll be in an official BCH/BTC bull market. No target but I expect good performance through the rest of the year.
So now you can use BitPay's debit card service to keep your holdings in Bitcoin or Bitcoin Cash and load up on dollars when you need to buy clothes and food, and be at least somewhat assured that your currency holdings will rise and make the world around you cheaper.

BCHBTC Bottomed out Its about time Bitcoin Cash gave us the opportunity to long those steroidal rallies, this is looking like a safe bet to get in before the storm strikes next week.
- Daily Bullish engulfing
Support Levels:
- Mid Range: .3009 BTC
Resistance levels:
- 25% range : .03115 BTC (Very weak resistance now, hammered 3 times already)
- Range High : .03219 BTC (Strong resistance)
Stop loss: .02919 BTC
Game Plan: Long the test of support, sell half of the position at Range High, if we break through the range high level, we have found the bottom of which should be considered a very strong rally and should be targeting .03540 and higher!!
Stop loss remains intact below the low of previous daily bullish engulfing candle, that base should be defended by the bulls if we are to push higher.
Cheers!!!

BCHBTC time to buyThe price has pushed away from the buy zone at H4.
If price break resistance line you can enter the longs after correction or buy pattern.
Target 1 - 0.0340
Target 2 - 0.04


Bitcoin Cash Analysis: Daily Timeframe Chart Patterns.Conclusion for today’s Bitcoin Cash technical analysis: The downtrend is expected to continue with 0.02388 as the minimum target if the 0.03095 price level is breached.
Bitcoin Cash Analysis (BCH/BTC) for today is provided using a log scale on the Daily timeframe candlestick chart. The downward trend on the Daily timeframe is highlighted using a bearish trend that has been established over 13 months ago starting back in May of 2018.
Attempts at breaking the trendline to the upside in April, May and June of this year did not see a follow through in price action and rather was followed by a pullback. This implies a resumption of bearish strength.
In addition, a rising wedge (diagonal) is used to track the bullish swing from the 0.02388 price low on December 16, 2018. The aforementioned chart pattern has bearish implications, and this was confirmed by a break below the lower boundary of the wedge on June 16, 2019.
Key level to therefore watch for support in BCH/BTC is 0.03095. Price breaking below implies a retest of the December 16 price low as a minimum expectation.

BCHUSD and BCHBTC Looking BullishBoth charts suggest that we may be at the end of the dump for BCH, At least temporarily.

Bitcoin Cash Bullish Chart Set-Up (Over 100% ROE on 7X Lev.)A bullish set-up has developed for Bitcoin Cash on BitMEX (BCHU19). This is no surprise, of course, Bitcoin is retracing so the altcoins finally get a chance to breathe and grow... and the altcoins market is surely starting to heat up... Lots of profits can be easily collected with patience in the weeks to come.
Back to the chart...
We have a bullish triangle.
We can see that BCHU19 broke passively above EMA10. Now trading above EMA10.
Trading above POC.
Bullish RSI.
A great trade can come from this chart... I've done my part, make sure to hit like if you want to see the full trade details. If enough people hit like, we know that there is interest and we will share the buy-in, targets, stop-loss, and additional information.
Right now we have trades for:
LTCU19
XRPU19
TRXU19
This is not financial advice.
Thanks a lot for reading.
Thanks a lot for the continued support.
Namaste.

BCHU19 looking for a run with $ALTSHigher Lows in price and RSI=Move to the upside
Potential Targets shown on chart. Looking like a pretty bullish chart in my opinion.
MACD crossed bullish and bar size increasing showing strength.
THANK YOU BE SURE TO LIKE AND COMMENT!!!
Twitter-CryptoPhenom1
BITMEX:BCHU19

BCH/BTC
- Still on the larger part of bearish channel trend.
- See the chart to see detail for upcoming resistance and support for short term.
- Indicators remain bearish for now and extremely oversold on 1 day chart, i expect a bounce in near future.
- DMI : -DI (seller power) is beginning to stalled,+DI (buyer power) and ADX (momentum) is still weak.
- RSI : Currently entering the oversold area.
- MACD : macd line is hovering on bearish area yet the histogram seller is appear still continue it's pressure for now.
peace._
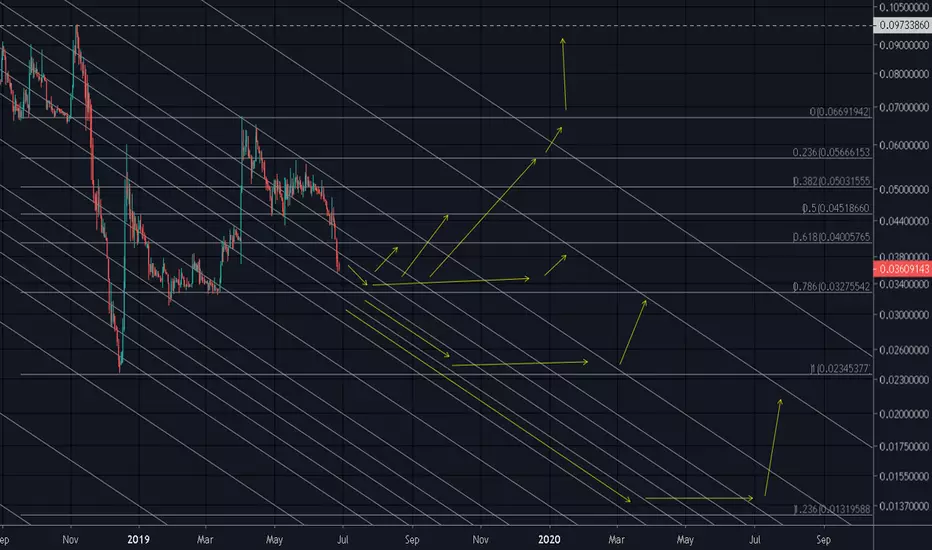
2019: THE YEAR OF BITCOIN CASH pt. 3In part 1, I analyzed the market caps of Bitcoin Cash 2019 to Ripple 2017
In part 3, I'm analyzing the price action of Bitcoin Cash 2019 to Ripple 2017
BCHBTC 2019 = XRPUSD 2017
1. Same pattern: sell off into M pattern
2. Identical 200D EMA
3. Identical 200D EMA breakout and breakdown
4. Identical 4 touch support found
BCHBTC 2019 = XRPUSD 2017
Next move: a ridiculous breakout
T1: .09
T2: .14
T3: .17


Bitcoin Cash Ascending TriangleBitcoin cash has been trading this triangle since the December 2018 low. I am looking for a high volume breakout with conviction to confirm pattern otherwise I will be trading my targets on my previous chart linked below.
Ascending triangle breakout target: $800s
Elliot Wave targets: $520-$960 (boxes on chart)

BCH Cup and Handle LONG BCHUSD - Bitcoin CashEntry ~ $445 (breakout)
Stop Loss below handle ~ $398
Target ~ $518

BCHUSD Elliott Wave (Coinbase)Coinbase:
When Wave 3 is less than 1.62, the 5th Wave overextends itself.
From research, the ratio of Wave 5 will be based on the entire length from the beginning of Wave 1 to the top of Wave 3.
Extended Wave 5 = either 0.62 x length
(beginning of Wave 1 to top of Wave 3) or = length of
(beginning of Wave 1 to top of Wave 3) or = 1.62 x length of
(beginning of Wave 1 to top of Wave 3)
T1: $401 (support)
T2: $508
T3: $681

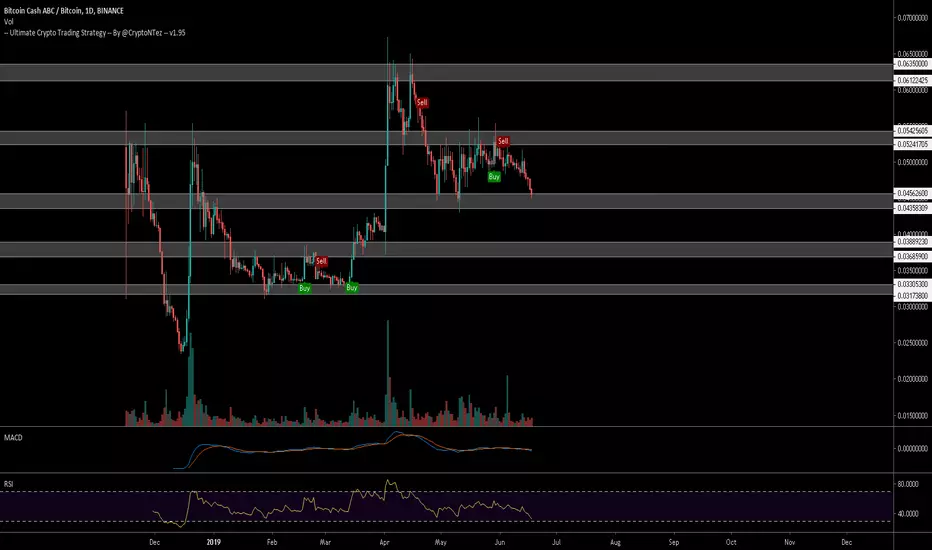
$BCH,Reached support at ~.045s sats...update on $BCH,Reached support at ~.045s sats as our previous analysis was seeing
RSI entering oversold levels
UCTS Sell signal on the 1D and 6H charts
I don't see signals of bouncing/reversal here yet but stay alert (many iterations in the past with good results)
#BCH #BCHABC