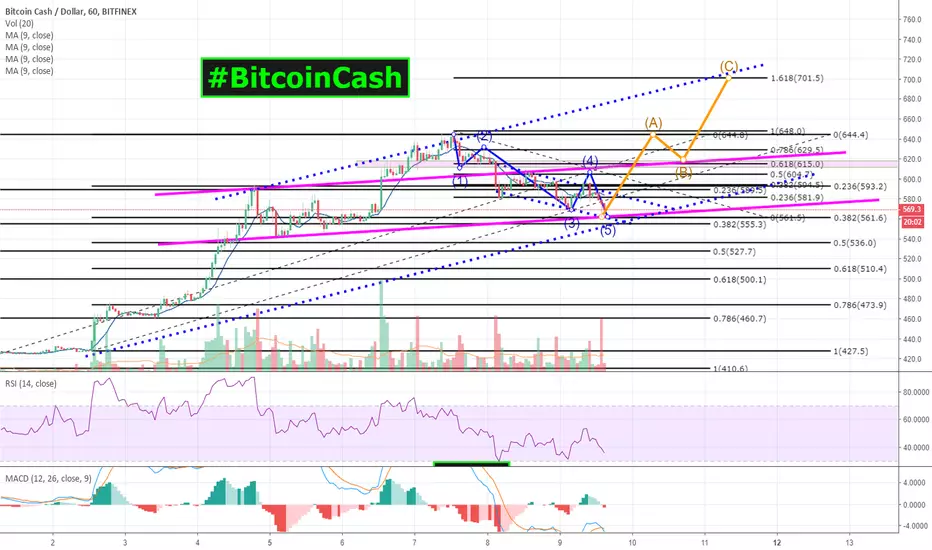
Bitcoin Cash BCH H&S and Bullish Wedge After the big and strong high volume rally BCH' has made, the bull flag i suggested in the previous analysis failed completely, it actually never even made the first leg up so there was not even a bull flag to be seen. Volume is still high on BCH' as well. The whole market is anticipating on the hard fork of BCH', as always a lot of speculation going on about this and a million different scenario's and opinions are being told. Best advice that i can give about this is, ignore it completely. The current market is not the same as a year ago, people are better informed nowadays. So just let the chart and it's patterns tell you what the market is thinking.
The long term bottom formation is still in play for BCH', the one i started to show in September and 2 weeks ago at the start of the big rally. This long term picture is still in full play, despite the weakness of the past few days. On the bigger picture it's just another correction on the big rally it made. Mostly because Bitcoin' has failed another attempt to break upwards because of the low volume.
This time i have added this potential inverse H&S in the long term picture. Here we have the same story as for XRP' (read it to know more). We want to see buyers stepping in around that blue support zone. If they do and we start to go up again, we need to see a big strong and high volume move up again towards the neckline. Like we saw during the rally from 450 to 640. If we see that develop, there will be a very big chance for a move towards that 850/900 target. That would mean we need Bitcoin' to break the 6500 resistance once again and go above the 7000 to reach those levels.
Short term, we can see another possible bear flag. Support seems to have been broken already so we can expect a bit more downwards movement. I am not so sure about the bear flag, so i have drawn 2 scenario's here. Yellow circle shows the target of the bear flag, but for the bullish version i want to see the blue line develop. Meaning, if we drop from here that the green support zone around 510/530 holds. I showed this support zone a few days ago and so far it is still holding. If this support zone breaks with high volume (as the past few days) we have to assume we will move towards the next support around 450.
Please don't forget to like this if you appreciate it:)
Previous analysis:
And the two long term analysis on BCH'
BCHBTC

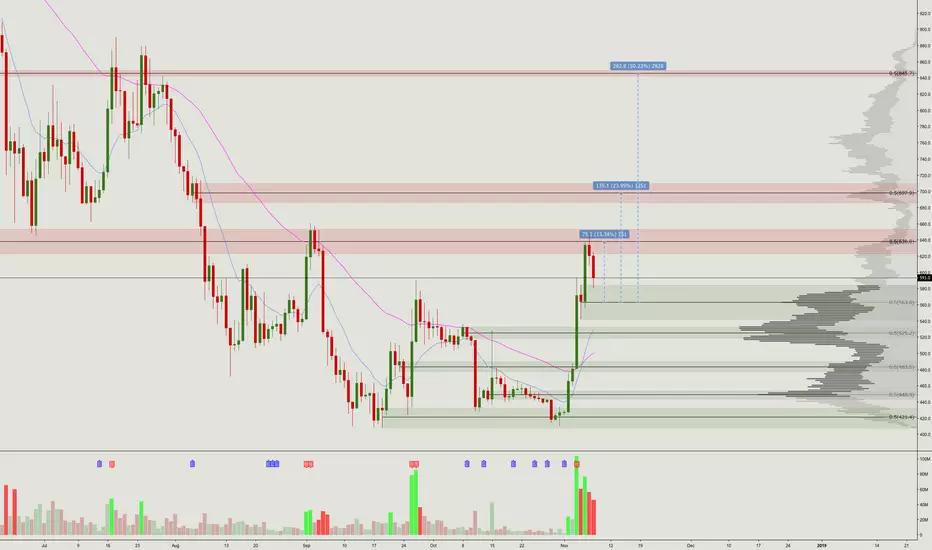
Bitcoin Cash (BCH) Insanly risky long trade I plan on taking.The basics of the idea are explained on the chart. If price wicks to the stop loss cluster and moves back up, we know it is a very good long. If price drops below and stays there. could still be a buy, but not as safe. If scenario two occurs I probably won't take the trade.
So I expect another 6% drop from here into liquidity zone
1. Lots of people betting on Bitcoin Cash dying and all are in profit
2. Longs all in a loss
3. Big liquidation on Okex
4. Expected stop hunt to 0.063
We know that the money in the market currently flows from retail to big retail. Soon it will be institutions. Few months ago large funds were downloading crypto charts for analysis and stated they are looking into getting into trading crypto. Bet some are in already.
Also, Matt Hougan is creating an index for cryptocurrencies. Anyone heard of him? /s
Thanks for viewing!

BCHUSD Inverse Head & Shoulder Breatout. BCH next target $550BCHUSD 15 min chart a inverse head & shoulder pattern just breakout. If it complates the target so we can see BCH BitcoinCash $550 soon......


BCHBTCAlready in a short position in BCH since top, RSI divergence was plain as day.
wait for retrace for possible long 3 wave with tight stop under the .65. Everybody eats.

BCH: LONG THE RETESTNose pattern/Double bottom in the support area.
Longed the retest, stoploss below previous lows.
3:1 Risk reward


BCH bull run before forkimpulse move up after W bottom formed. Broke above bull pennant and currently consolidating for more upward movement. Targets on chart.

LTCBTC WATCH THIS RANGE AT DAILY DEMAND. BULLISH!break of range Litecoin likely to push much higher.
Daily Demand + Key S/R level confluence.

TA on BCH/BTCDid a TA on Bitcoin Cash against BTC. It shot up from 0.064 BTC all the way till 0.098 BTC after the announcement from binance that the hard fork token will be supported. Interestingly enough, it did not pass the point of 0.1 BTC and i think because there was a lot of sell orders at that point because of the rule of round number. Nonetheless, after doing a fibonacci retracement on the chart, i figure a good entry can be at 0.0824 BTC at the exact 50% retracement mark. The retracement was a normal one because BCH was very overbought from the last few days.

Head and shoulders bch on 5, 15, 60 min chartthink there is still much time to the fork left so there is enough time for the last spike before last retracemant....

BCH Shorting opportunity!With the BCH Hardfork looming and from previous experiences of many forks taking a massive drop before recieving the splits, BCH chart also looks ready to drop even further down staying within its descending channel & also on its C wave to the 0.618 golden ratio zone, perfect opportunity for a short!

I see 5 Waves down, ALMOST complete 4 #BitcoinCash | $BCH $BCC!I see 5 Waves down, ALMOST complete 4 #BitcoinCash | $BCH $BCC!
There is a possibility of the beginning an uptrend in BCHBTCMidterm forecast:
. While the price is above the support 0.0655, beginning of uptrend is expected.
. We make sure when the resistance at 0.0980 breaks.
. If the support at 0.0655 is broken, the short-term forecast -beginning of uptrend- will be invalid.
. We will close our open trades, if the Midterm level 0.0655 is broken.
Technical analysis:
. The Falling Wedge taking shape and as a bullish pattern suggests we will soon see another leg higher if price breaks and closes above downtrend.
. The RSI resistance #1 at 56 is broken, so the probability of beginning of uptrend is increased.
. Price is above WEMA21, if price drops more, this line can act as dynamic support against more losses.
. Relative strength index (RSI) is 74.
Trading suggestion:
There is possibility of temporary retracement to suggested Buy Zone (0.08800 to 0.07650), if so, we would set orders based on Price Action and expect to reach short-term targets.
. Beginning of entry zone (0.08800)
. Ending of entry zone (0.07650)
Entry signal:
Signal to enter the market occurs when the price comes to "Buy zone" then forms one of the reversal patterns, whether "Bullish Engulfing" , "Hammer" or "Valley" in other words,
NO entry signal when the price comes to the zone BUT after any of reversal patterns is formed in the zone.
To learn more about "Entry signal" and the special version of our "Price Action" strategy FOLLOW our lessons:
Take Profits:
TP1= @ 0.0980
TP2= @ 0.1075
TP3= @ 0.1210
TP4= @ 0.1330
TP5= @ 0.1480
TP6= @ 0.1770
TP7= @ 0.2010
TP8= @ 0.2440
TP9= Free

Bitcoin Cash : is it ready to short ?!BCHUSD
We have a good resistance zone . On the news with the hard forks, the price of the coin grows and a few days before the hard forks begin price rolling back. Here is a good trade by zones. RSI has already overbought.

BCH (Bitcoin Cash) 20% Target Achieves....!!Both Long Position Target Complete .
Let c What will be next Move in BCH.

XMR LONG. WATCH THESE LEVELS Currently at Daily level of support, look to the lower timeframe price action for entry.
Good Luck from The TRADRZ Team


BCH gearing up for another run!
BCH hit the supply zone above after its massive rise on upcoming fork news
EMAs have crossed bullish and continue to climb
We have dipped into the demand zone below and could still see price return back inside as BTC does look like it wants to pullback
This would be the ideal spot to enter a scalp long into the fork
Upside targets are still very beneficial as we have seen BCH run up hard into announcements like this
Thanks guys!
REQBTC LONG. BULLISH PRICE ACTION ABOVE MONDAYS HIGH!Ideally want to see one more higher high and REQ looks very ready for upside expansion.
GL from TRADRZ

BCH Bitcoin Cash Ready to make a Bull Flag?Bitcoin' has moved up from 450 to 650 since i posted my first post a week ago, so far it has confirmed the bear trap counter move. It has moved up 50% and assuming the extreme days belong to the past, we can assume things will slow down a bit the coming week or so. There has been a lot of talk about the hard fork later this week, I personally choose to ignore it. I will let the chart tell me what the next step will be. Because if the chart shows the market will dump BCH' around the hard fork, we will see the signals in the chart. Because hard forks are not new anymore, people are better prepared nowadays so my assumption is we will see those steps develop in the chart.
We could be making a big bull flag the coming days, it's almost weekend so that would fit this picture as well. So long term, i want to see the price stay above the 570ish, with a max drop to 540ish. Short term, we can see a channel in the making. It looked like a bear flag at first but it was becoming a bit too big. Therefore i expect it to find support again around the green level (red line), the channel already broke while writing this.
A lot will depend on Bitcoin' as always, which is finding a lot of resistance as i am writing this at the 6500. So it will be a bit tricky. If BCH' drops less than Bitcoin', we can assume that we will move up again from the green support zone.
Please don't forget to like this if you appreciate it:)
Previous analysis:

BCH finds support before going higherLooks like we have a strong support before moving up to the next zone. Chart is pretty self-explanatory.
