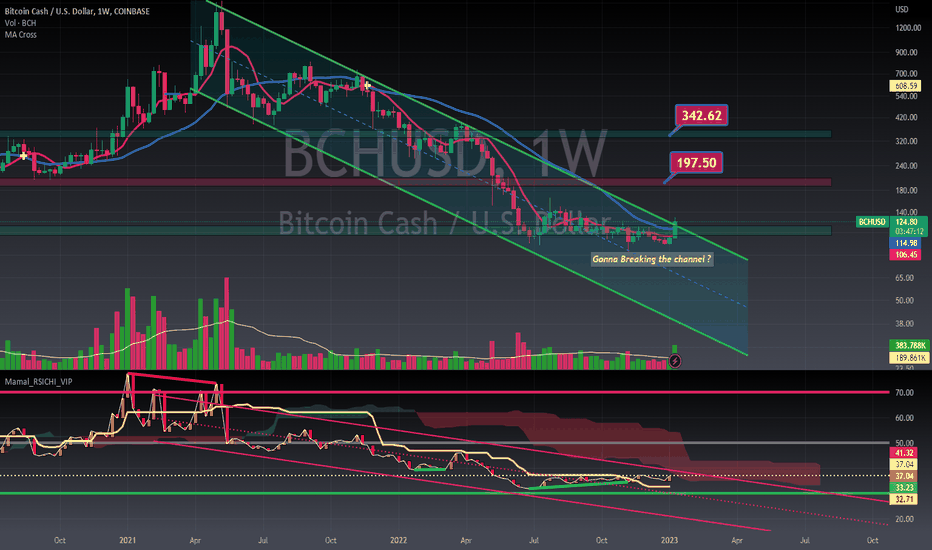
✅TS ❕ BCHUSD: up trend✅✅ BCH has formed an ascending channel .
The price is fixed above the lower border of the channel.
I think that the asset will continue to grow. ✅
🚀 BUY scenario: long to 146.6. 🚀
----------------------------------------------------------------------------
Remember, there is no place for luck in trading - only strategy!
Thanks for the likes and comments
BCHUSD
BCH/USD: Long position to $146 USDBitcoin Cash look in the interesting scenario that it's ending this pattern ABC with their measure using Fibonacci for harmonic. What we hope that BCH continue up in this week toward $146 USD
I will put a buy order now in the market price, Stop Loss in $128 USD and take profit to $146. This it's a risk/benefit1:2
Good luck guys!!!
$4M #BCH - Wave 3/5ALTCOIN SEASON may have arrived.
BCH might be repeating 2017.
Will BCH FLEX to the 3.618FIB, AGAIN?
A Quick touch to the 0.702FIB, retrace to 0.236, then a parabolic WAVE 3 push ABOVE the 2.618FIB and wave 5 for the 3.618FIB test, and a 95% retrace from there.
BCH Wave 5 is historically very small.
$100 = $2.9M
Good Luck Traders!
✅TS ❕ BCHUSD: up trend✅✅ BCH continues its upward movement.
Volatility has increased again.
I believe that BCH will continue to grow while consolidating above the support level. ✅
🚀 BUY scenario: long to 146.6. 🚀
----------------------------------------------------------------------------
Remember, there is no place for luck in trading - only strategy!
Thanks for the likes and comments.
BCH Cash BullishCrypto Altcoins
#CryptoWhale100Billion Alt Coin Analysis:
#CryptoWhale100Billion Alt Coin Analysis: BCH
My Analysis shows that BCH show a strong buy after hitting a low of $98 and bounced up to $103. The resistant area we can see BTC running back all the way up to $116 and breaking out higher.
RSI showing a good bull move from buying big buys. We can see a swing-up trend in the next few weeks. Small sales showing on the MACD. BCH has been trending sideways in this area for some time. Whales may accumulate and push it to the upper side.
Shoot me a message with your Technical Analysis to see your thoughts and trading strategies.
#CryptoWhale100Billion
Press The Thumbs Up and send me a message below about your idea on KNC will hit.
Thank You for the support!
Below are some Previous charts links I've written in the pass for Reference.
BCHUSD Futures ( BCHUSD ), D1 Potential for Bullish ContinuationTitle: BCHUSD Futures ( BCHUSD ), D1 Potential for Bullish Continuation
Type: Bullish Continuation
Resistance: 164.60
Pivot: 138.19
Support: 125.31
Preferred case: Looking at the D1 chart, my overall bias for BCHUSD is bullish due to the current price crossing above the Ichimoku cloud, indicating a bullish market. If this bullish momentum continues, expect price to continue moving towards the resistance at 164.60 where the previous swing high is.
Alternative scenario: Price may head back down to retest the support at 125.31, slightly above where the 23.6% Fibonacci line is.
Fundamentals: There are no major news.
BCHUSD Potential for Bullish Continuation | 27th January 2023Looking at the Daily chart, my overall bias for BCHUSD is bullish due to the current price being above the Ichimoku cloud, indicating a bullish market. Looking for a buy stop entry at 138.53, where the recent high is, we are looking to take profit at 164.97, where the previous swing high is. Stop loss will be placed at 125.82, where the previous overlap support and 23.6% Fibonacci line is.
Any opinions, news, research, analyses, prices, other information, or links to third-party sites contained on this website are provided on an "as-is" basis, as general market commentary, and do not constitute investment advice. The market commentary has not been prepared in accordance with legal requirements designed to promote the independence of investment research, and it is therefore not subject to any prohibition on dealing ahead of dissemination. Although this commentary is not produced by an independent source, FXCM takes all sufficient steps to eliminate or prevent any conflicts of interest arising out of the production and dissemination of this communication. The employees of FXCM commit to acting in the clients' best interests and represent their views without misleading, deceiving, or otherwise impairing the clients' ability to make informed investment decisions. For more information about the FXCM's internal organizational and administrative arrangements for the prevention of conflicts, please refer to the Firms' Managing Conflicts Policy. Please ensure that you read and understand our Full Disclaimer and Liability provision concerning the foregoing Information, which can be accessed on the website.
✅TS ❕ BCHUSD: broke up a channel✅✅ BCH is moving in an uptrend.
The price broke the descending channel.
Continued growth is possible. ✅
🚀 BUY scenario: long to 146.6. 🚀
----------------------------------------------------------------------------
Remember, there is no place for luck in trading - only strategy!
Thanks for the likes and comments.
BCHUSD - 30% Jump Incoming After Breaking Descending TrendBCHUSD has recently received a buy signal from Crypto Tipster v2 after bouncing off recent support on the underside.
This suggests that the cryptocurrency may be entering a bullish market and could see a significant increase in value. The question now is whether BCHUSD will be able to break through a descending trend line to reach 30% in profit after a year and a half of a generally downward trend.
***
If you enjoyed or agree with this idea - drop us a comment, like & follow! :)
***
DINO Coins will OUTPREFORM BTC! (And no I don't like BCH)DINO Coins will OUTPREFORM BTC! (And no I don't like BCH but the Charts NEVER lie.)
Sitting above Daily 200 EMA with strong momentum still.
Euphoria is entering the market.
KEEP AN EYE ON DINOS!
This is the 3rd Example of 2x plays that can possibly play out by Mid FEB!
ENTRY:
100-125$ and HOLD
SL open or 25-30% of DCA Entry.
TP 1/8 50%
1/8 75%
1/2 100%
Remaining runner 150%
Signs why Below:
Buy above 4h 200 EMA
(With Smaller Bullish patterns)
Confirmed Breakout
(Look at RSI , Trendlines , Volume )
Look for catalyst News
(Anything that rehypes the shitcoin, or it's bluechip chain)
Buy SPOT ONLY and HODL!
Swing until 2x profit, or weakness. no SL but if needed a loss of 50% would be a SL
FIND THIS IN OTHER SHITCOINS AS WELL!
PLAY THEM ALL
BTW there is an order to this, I will not share it, you will need to DYOR.
but this is a prime example which will likely 2x by MID Feb
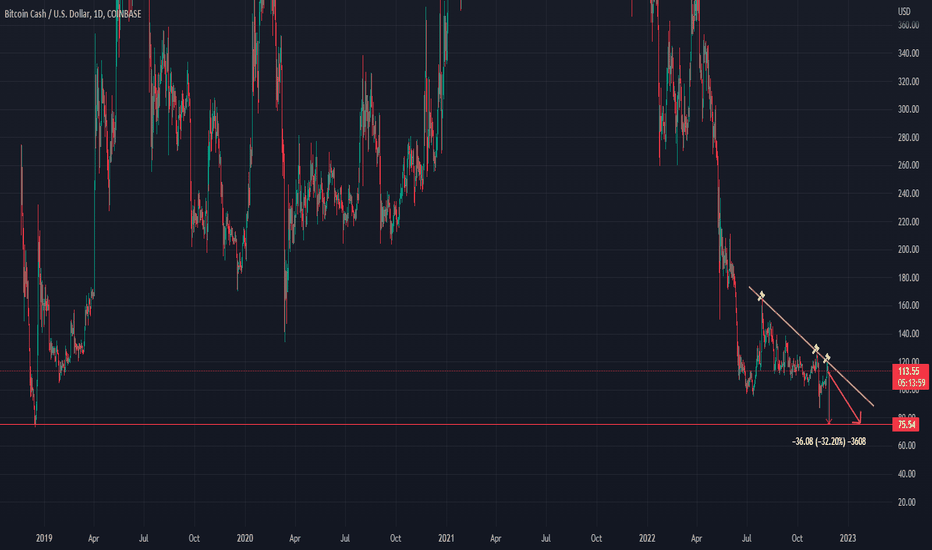
BCHUSD 30 % dump comingAs the bear market continues , the price can't break the resistance and it remains in the downtrend.
We expect 30 % dump before any significant bounce. If it happens BCH would drop to 75 $ which are lows from December 2018.
It also likely that we will see price lower than 75 $ in this bear market.
Any bounce probably will be a short lifted and the price eventually will go down.
Good luck
Current waveIf the current wave can break through the previous ceiling area at $104.6, we can expect price growth to continue up to the ceiling of the main descending channel at $110.4. But if the price goes back below the $100 range due to selling pressure, a retest of the $95 support is likely. In general, in the daily time frame, we expect the range trend to continue.


