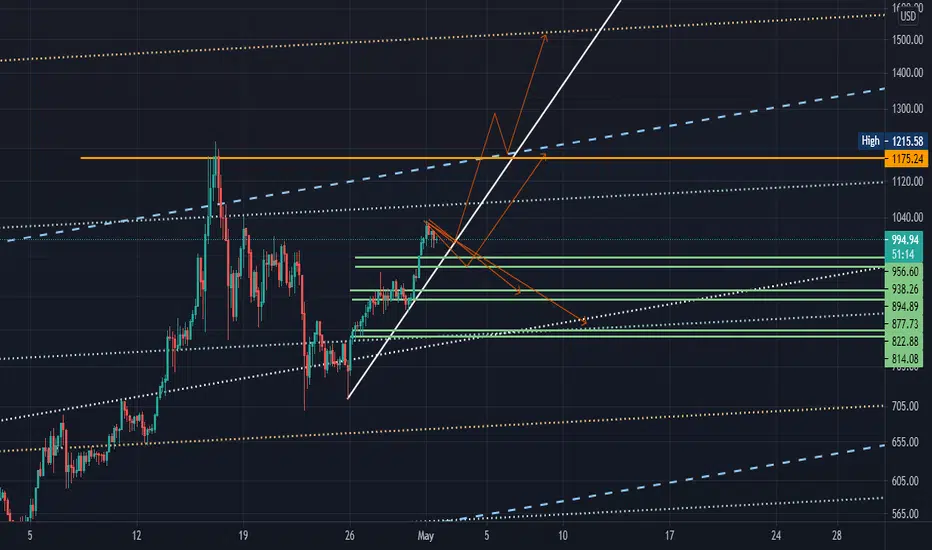
BCHUSDT : 16% Profit From My Last AnalysisBCH is Going to Strongest Resistance at $1217...
if Broke, Next Target is $1460 :)
Bchusdt


BCH read the Description of btc analysis in my ideas I believe btc price can moving all market prices..!
BCH is shortbears are selling on rallies. They will try to sink the price below the 20-day EMA. If they manage to do that, the pair could drop to $686.75.

BCH Buy the pivot.BCHUSDT - Intraday - We look to Buy at 841.2 (stop at 798.9)
Daily signals are bullish.
We look to buy dips.
Pivot support is at 828.
We look for a temporary move lower.
Our profit targets will be 963.3 and 996.3
Resistance: 920.0 / 960.0 / 1000.0
Support: 890.0 / 850.0 / 830.0

BCH analysisif BCh manages to break 1st resistance at $950 then price may reach $1,012. but there is possibility of BCH breaking the EMA20 at $815 which then may drop to MA at $661.

BCHUSDT : Road to $1900BCHUSDT Analysis
Support 1 : $709
Support 2 : $590
Current Price : $887
Strong Resistance : $1217
Target 1 : $1460
Target 2 : $1672
Target 3 : $1939

BCH/USDT is about to reach It's ATH again!Hi every one
BITCOIN CASH / TETHERUS
BCH/USDT has been in a falling wedge lately but now the price has broken this pattern and as we Can expect the price Can reach It's ATH again! (around 1200)!
Traders, if you liked this idea or have your opinion on it, write in the comments, We will be glad.
Things can change...
The markets are always changing and even with all these signals, the market changes tend to be strong and fast!!
Thank you for seeing idea .
Have a nice day and Good luck

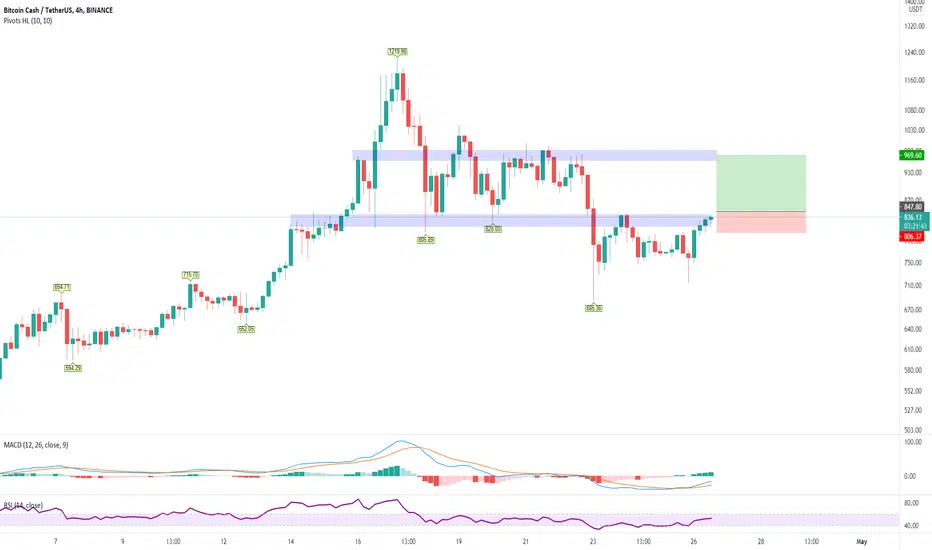
BCH Buy a break setup.BCHUSDT - Intraday - We look to Buy a break of 847.8 (stop at 806.6)
Daily signals are bullish.
A break of bespoke resistance at 840, and the move higher is already underway.
Trading close to the psychological 1000 level.
Short term bias is bullish.
We look for gains to be extended today.
Our profit targets will be 969.6 and 996.9
Resistance: 840.0 / 930.0 / 1000.0
Support: 800.0 / 750.0 / 700.0
BCH breaking out ready for another leg upBCH has formed a double bottom on the 1-hour chart and also breaking out the downtrend line. This is a good time to build your position in BCH.
Buy Zone: $810 - $815
Target: $895 - $985 - $1080 - $1190 - $1330 - $1480 - $1680

BCH analysisbulls are trying to push the price above the downtrend line. If they succeed, the pair could again rise to $1,000. If the price turns down from the downtrend line, the bears will make one more attempt to sink the price to the 50-day SMA ($629).


#bitcoin cash video pt.2! its a good one definitely watch.I provide some provocative ideas.
That will garner me much hate. More than likely.
But who cares.
I'm a retired
Millionaire.


I TALK #BITCOINCASH #BCH #ROGERVER PEER TO PEER #CASH NETWORKABIT ABOUT ITS HISTORY
AND ATTEMPT TO CHART A TREND FIB BEFORE THE TIMER! LOL


BCH is LongIf the 1041$ resistance breaks then there is possibility of testing 1213$.
if the price turns down and breaks EMA20 at 797$ then deeper corrections even top 618$ is possible.

BCH/USDT is gonna down??BCH charts make cup and handle in a triangle if chart breaks its neck(price 850) and close blow of it
it can fall to price 700 even lower
follow me please and comment your opinion about this coin
if you want other coins analyses just comment it for me
encourage me by liking


It is possible to be profitableBINANCE:BCHUSDT
It is possible to be profitable
what is your opinion?

BCHBNB - Nison: 20 SMA with RSI(5) - Change of PolarityBCHBNB - Nison: 20 SMA with RSI(5) - Change of Polarity
- BCH has overcome Pivots P and pulled back to P after hitting R1.
- P shows a potential Change of Polarity (old resistance becoming new support).
- The pullback candle closed as a Piercing Pattern, setting horizontal resistance at the low of the pattern (1.8).
- The reversal came on a pullback to SMA 20 (Bollinger Basis).
- Nison 20 SMA with RSI(5) strategy wants RSI to close above 50, pull back, and find support. That will be a long entry signal.
SL: 1.795
T1: 2.175
T2: 2.42
T3: 2.8
RR: ~ 2.17, 4.21, 7.37
Additional Strategy:
Nison: EMA Crossover
- Wait for 4H EMA 5/8 Golden Cross on candle close.
- Set a buy order 2-5 ticks above the next Daily close which has a lower high.
- Trail buy order down until the trade executes.
- Close the trade 7 candles later, including the candle which triggered your entry.

BCHUSDTHello to you all. Mars Signals team wishes you high profits at all times.
The price has a good correction. We intend to be able to touch our targets over time, but we have drawn a support line for you dear ones, which can be a good opportunity to buy.
Warning: This is just a suggestion to you and we do not guarantee profits.
Wish you luck!
