Bchusdt

BCH/BTC 300% potential from here so read full update#BCH/BTC TA Update:-
#BCH/BTC looks good at this level.
I am buying here some and waiting for breakout upward site.
Keep an eye on Red box.
This red box is very important for bull of #BCH
Entry:- 0.0115-0.01156 BTC
Targets:- 0.0156/0.02/0.025/0.035 BTC
If you want to hold then this is good potential.
If candle close below support level then bearish.
Please click LIKE button and Appreciate my hard work.
Must follow me for latest crypto real time updates.
Thank you.

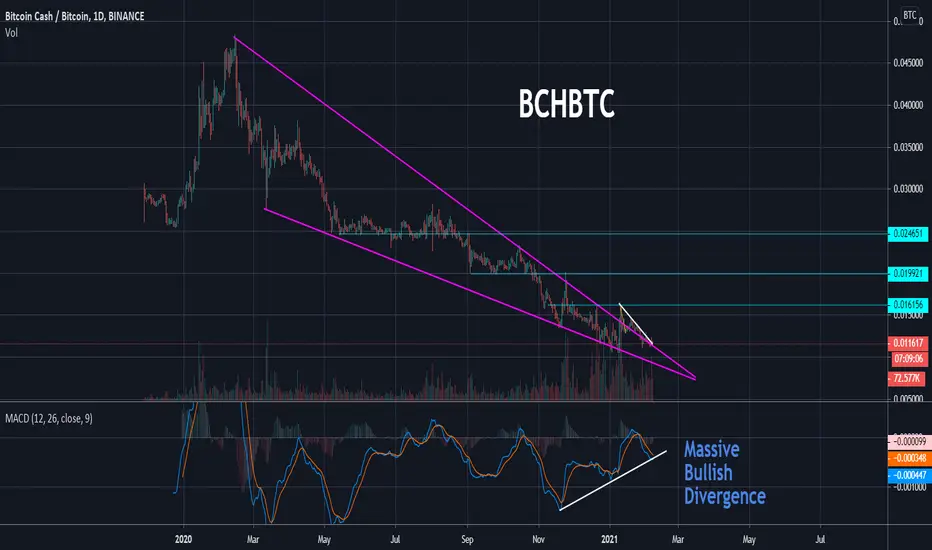
BCH - Bitcoin Cash Looks Ready to Explode!BCH is one of few alts that has yet to have its own bull run against BTC. However, I love this daily set up. BCH broke out of its year long falling wedge and has been coiling up for what I think will be a big break out. Take a look at the massive bullish divergence on the MACD. I'm long here!
BCH forms a Nice Falling Wedge 🔥Bitcoin Cash is one of the currencies that requires holders with a lot of patience :)
But if we look technically, it has formed an A-wave and corrected up to 61.8% of the Fibonacci inside the falling wedge, and now it is ready to start the C-ascending wave.
2 Feb Analysis in Bitex Group :

Bitcoincash (BCHUSDT) Technical analysis updateBCHUSDT (4h CHART) Technical Analysis Update
Resistance zone breakout
BCH/USDT currently trading at $462
Buy-level: $455 to $465 level
Stop loss: Below 410
Target 1: $540
Target 2: $625
Max Leverage: 2X
ALWAYS KEEP STOP LOSS...
Follow Our Tradingview Account for More Technical Analysis Updates, | Like, Share and Comment Your Thoughts.

BCH/USD - Deciding on next steps, $500 in range!BCH did a good run so far despite the sharp pullbacks which can be frustrating.
Now we find ourselves at this local support (dotted line) which I'd expect to hold the price and allow us to go higher towards $500. However if we break below it, then I think this run may take a break and we will need to reload at lower levels before $500 can be reached.
It's important we do not fall lower as that would break the current momentum in price.
I do not like how the indicators look (a bit bearish), but so long we hold at this dotted support line we should be safe.
Like and follow if you liked this idea! Also join my crypto community to stay in touch!


Bitcoin Cash (BCH) - February 6Hello?
Dear traders, nice to meet you.
"Like" is a huge force for me.
By "following" you can always get new information quickly.
Thank you for always supporting me.
-------------------------------------------------- -----
We have to see if we can get support at 435.40010001 and climb above 501.0.
In particular, you need to make sure you can get the support at 454.59999980 to give off the power of your ascent.
If you drop from the 411.87118638 point, you can touch the 324.10000000 point, so you need to trade carefully.
If you fall at the uptrend line (2) or at 367.31848226, you need a Stop Loss to preserve profit or loss.
(1W chart)
The 411.87118638-501.0 section is an important volume profile section.
-------------------------------------------------- -------------------------------------------
** All indicators are lagging indicators.
So, it's important to be aware that the indicator moves accordingly with the movement of price and volume.
Just for convenience, we are talking upside down for interpretation of the indicators.
** The wRSI_SR indicator is an indicator created by adding settings and options from the existing Stochastic RSI indicator.
Hence, the interpretation is the same as the conventional Stochastic RSI indicator. (K, D line -> R, S line)
** The OBV indicator was re-created by applying a formula to the DepthHouse Trading indicator, an indicator published by oh92. (Thank you for this.)
** Check support, resistance, and abbreviation points.
** Support or resistance is based on the closing price of the 1D chart.
** All explanations are for reference only and do not guarantee profit or loss on investment.
Explanation of abbreviations displayed on the chart
R: A point or section of resistance that requires a response to preserve profits
S-L: Stop Loss point or section
S: A point or segment that can be bought for profit generation as a support point or segment
(Short-term Stop Loss can be said to be a point where profits or losses can be preserved or additionally entered through installment transactions. It is a short-term investment perspective.)
GAP refers to the difference in prices that occurred when the stock market, CME, and BAKKT exchanges were closed because they do not trade 24 hours a day.
G1: Closed price
G2: Market price at the time of opening
(Example) Gap (G1-G2)

Bitcoin Cash - Exiting a downtrend - price reversal BCH/USDTThe price of the coin is consolidating in a falling wedge-shaped trading range. This figure is bullish and indicates a set of positions by a major player. The confirmation will be going out of the trading range. My focus is on the global key resistance line.
Cluster analysis - large volume
Indicators - price reversal up
Break of the wedge -> exit from the trading channel -> confirmation -> continued growth in percentage. Target on the chart
Do not overestimate risks, do not trade with x10-100, be smarter and always take profits, and also move your stop loss.

Ascending Triangle pattern seen in $BCH in 1hr Time FrameAscending Triangle pattern seen in $BCH in 1hr Time Frame
This pattern could move $BCH up to $444 to $456 to $466...
my last chart on $BCH which was the Cup & Handle already breakout!
looks like this pattern already breakout too on $RSR if you will look at my chart on it...
it seem $BCH is imitating the move of $RSR
TYOR..
becareful!

BCH READY TO TAKE FLIGHT!Hello Community!
Before we begin please support my idea with a thumbs up and a comment. It'll be greatly appreciated and will motivate me to post a little more!
BCH/USDT has successfully broken major resistance shown by the trendline in the chart. MACD attempting a bullish cross. RSI made a higher low. We can expect steady grown from here.
This is not Financial advice.
Safe Trading Calculate Your Risk/Reward & Collect!
Coin Donations Are Always Welcomed :)
Simplicity Wins

BCH/USD - Levels to watch, bullish price action towards $500!BCH broke outside this descending triangle and is now moving higher. We were stopped first at Fib 23% but now we managed to push higher and make it support. So our next target is $470, then $500.
I like how BCH is looking here and I expect us to push higher fast as momentum is building up in the market. ETH is pushing higher after passing it's ATH and we're looking sexy.
Indicators on BCH are very bullish, particularly on daily timeframe where the MACD is about to cross to the positive side and RSI is curving up nicely.
Very bullish on BCH, good to explore long opportunities.
Like and follow if you liked this idea! Also join me on my crypto community to stay in touch!

Bitcoin Cash Poses To Be A Good Investment Right NowWarning: our thoughts are ours alone; not financial advice.
Not everyone believes in bitcoin cash or what it stands for. But like bitcoin, we also think it's a great speculative asset.
In our opinion, there's still opportunity to bag BCH as much as possible right now. Target, $600 and beyond.
Trade with caution.

BCHUSDT All Time ChartIf this chart breaks out I absolutely don't know the limit on this one.. The roooof willl blow off the top.. Check this all time chart out from BITTREX.. This is not financial advice but in my opinion one of the most solid trades and opportunities
Please like and Follow for more charts


BCHUSDT, strong short to 363.94.Hi friends. Really never write about BCH. But today when i seen this picture. I was surprised. So big volume of BCH was sold at 425. And trend easy can going to first bears target (X-Lines level) - 363.94. No obstacle for that at this moment. Follow me.

Bitcoin Cash (BCH) - January 30Hello?
Dear traders, nice to meet you.
"Like" is a huge force for me.
By "following" you can always get new information quickly.
Thank you for always supporting me.
-------------------------------------------------- -----
You should watch for any movement that deviates from 367.31848226-435.40010001.
If you fall at 367.31848226, you need a Stop Loss to preserve profit or loss.
However, you need to trade carefully as you can touch and climb 324.1 points.
If it rises above the 435.40010001 point, it is expected to rise above the 501.0 point.
-------------------------------------------------- -------------------------------------------
** All indicators are lagging indicators.
So, it's important to be aware that the indicator moves accordingly with the movement of price and volume.
Just for convenience, we are talking upside down for interpretation of the indicators.
** The wRSI_SR indicator is an indicator created by adding settings and options from the existing Stochastic RSI indicator.
Hence, the interpretation is the same as the traditional Stochastic RSI indicator. (K, D line -> R, S line)
** The OBV indicator was re-created by applying a formula from the DepthHouse Trading indicator, an indicator that oh92 disclosed. (Thank you for this.)
** Check support, resistance, and abbreviation points.
** Support or resistance is based on the closing price of the 1D chart.
** All explanations are for reference only and do not guarantee profit or loss on investment.
Explanation of abbreviations displayed on the chart
R: A point or section of resistance that requires a response to preserve profits
S-L: Stop Loss point or section
S: A point or segment that can be bought for profit generation as a support point or segment
(Short-term Stop Loss can be said to be a point where profits or losses can be preserved or additionally entered through installment transactions. It is a short-term investment perspective.
GAP refers to the difference in prices that occurred when the stock market, CME, and BAKKT exchanges were closed because they do not trade 24 hours a day.
G1: Closed price
G2: Market price at the time of opening
(Example) Gap (G1-G2)

BCHUSDT (BITCOIN CASH) - POTENTIAL BREAKOUT ANALYSIS 🔎
- BCHUSDT is printing a falling wedge pattern.
- This is reversal pattern.
- A bullish pattern to be precise.
- Price is testing the falling wedge's resistance.
- There's an upward breakout potential.
BUY ENTRY ⬆️
- Breakout above the falling wedge's resistance and the horizontal resistance level (R1).
TARGETS 🎯
- Horizontal resistance level (R2).
SETUP INVALIDATION ❌
- Breakdown below the swing low support level (S1).

BCH now is on a VERY key spot.MACD shows a divergence and if BCH could break 393.5$ that would be LONG signal to spot that i showed. but if BCH stay below 393$ it could be SHORT signal.
Be careful with 390 - 393$ at BCH.

BCH_USDTThis is my analysis for BCH, I think everything in the picture is clear and does not need to be explained. But I need to say a few things. 1️⃣These analyzes are only my personal opinion and no one knows the future. 2️⃣analysis posted on my page is only useful for people who have learned a little bit of analysis. 3️⃣ If BCH hits the targets, 344 and 288. ⭕Wait for a few candles to close. If there are signs of an uptrend, buy later. ⭕ Please like and comment Good luck friends

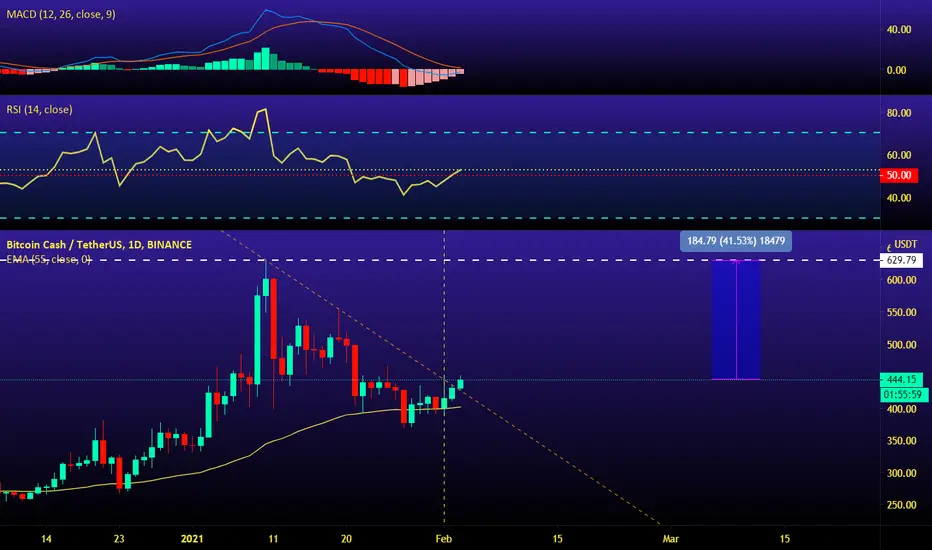
BCH/USD - Descending triangle approaching apex, what next?BCH has formed a descending triangle as indicated by the blue shape which is ranging between resistance ($600) and support ($400).
Price is now quickly approaching a decision time whereby it can break-up to retest the $600 level or seek lower support. We should know by early February.
4h indicators are flat, however on the daily we can see that we are trying to gather strength for a bullish bias where MACD histogram and Stoch RSI are curving up.
At this point, it is really up to BTC and ETH to set the tone for the overall market. In both cases we are at support levels so a new breakdown to lower levels may pull BCH down as well. To be seen.
Like and follow if you liked this idea!

