BCH/USDT IDEA BCH/USDT has experienced a double breakout, surpassing both the trendline resistance and an inverse head and shoulders pattern with a significant breakout candle. Anticipating a strong bullish movement ahead, I am eager to observe its potential upswing. Remember, this is not financial advice; please conduct your research (DYOR).
Bchusdt

Bitcoin Cash BCH price now at the stage of correctionWe described in detail about such a project as Bitcoin Cash and our global vision of the CRYPTOCAP:BCH price movement in our previous idea, almost 2 years ago)
Since then, the #BCHUSDT price has made a modest x9
Looking at the #BCHUSD chart now, it seems that 5 waves of growth have already passed, and now the A-B-C correction process is underway.
Do we want to buy BCH in our investment portfolio - no
But if we were told: here's your money, but only to buy BCH, then the limit buy order would be placed at a price not higher than $320
Interested in what will happen next? Like and write your own version of the events

Breakout Alert: #BCHUSDT Poised for Major Bullish RallyYello, Paradisers! 🚀 Are you ready to catch the next big move in #BCHUSDT? We have been monitoring #BCH for a while and now is the best time to pay attention:
💎#BCHUSDT has broken free from its longstanding descending channel, signaling a potential upward trajectory. After navigating this channel for a considerable period, #BitcoinCash has successfully breached it.
💎50EMA and increasing trading volume is reinforcing this bullish momentum. The key resistance level at $403 has now turned into a crucial support. This support level is pivotal as it has been respected multiple times in the past. If #BCH maintains its momentum above $400, there's a high probability of a sharp upward move.
💎However, if the price descends below the $400 support level, the scenario changes. In this case, the probability leans towards a bullish rebound from the lower, formidable support at $346.
💎If this support also fails to provide the necessary push to the NYSE:BCH , there's a high probability of a rebound from the support at $310.
💎While some inexperienced traders might be tempted to short at this point, it's essential to maintain a broader perspective and wait for proper price action. A break below the $310 support will likely trigger a significant downward move, causing the price to drop further.
Don't get caught in the noise; focus on the bigger picture and make informed decisions.
MyCryptoParadise
iFeel the success🌴

Bitcoin Cash Preparing For Bullish Wave Towards 800$ Seems Like Preparing For Recovery In Coming Weeks Currently Testing Multiple Resistances Bch Need Clear To Clear These Hurdles Before Making New Yearly High
Incase Of Successful Breakout Expecting Move Towards 800$

BCHUSD / Bitcoin Cash Market Money Heist plan in UP SideMy Dear Robbers / Traders,
This is our master plan to Heist Bitcoin Cash BCHUSD market based on Thief Trading style Technical Analysis.. kindly please follow the plan I have mentioned in the chart focus on Long entry. Our target is Red Zone that is High risk Dangerous level, market is overbought / Consolidation / Trend Reversal at the level Bearish Robbers / Traders gain the strength. Be safe and be careful and Be rich.
Note: If you've got a lot of money you can get out right away otherwise you can join with a swing trade robbers and continue the heist plan, Use Trailing SL to protect our money.
Stop Loss : Recent Swing Low using 2h timeframe
Warning : Fundamental Analysis comes against our robbery plan. our plan will be ruined smash the Stop Loss. Don't Enter the market at the news update.
Loot and escape on the target 🎯 Swing Traders Plz Book the partial sum of money and wait for next breakout of dynamic level / Order block, Once it is cleared we can continue our heist plan to next new target.
Support our Robbery plan we can easily make money & take money 💰💵 Follow, Like & Share with your friends and Lovers. Make our Robbery Team Very Strong Join Ur hands with US. Loot Everything in this market everyday make money easily with Thief Trading Style.

BCHUSD Bitcoin Cash Money Heist PlanMy Dear Robbers / Traders,
This is our master plan to Heist BCHUSD Market based on Thief Trading style Technical Analysis.. kindly please follow the plan I have mentioned in the chart focus on Long entry. Our target is Red Zone that is High risk Dangerous level, market is overbought / Consolidation / Trend Reversal at the level Bearish Robbers / Traders gain the strength. Be safe and be careful and Be rich.
Note: If you've got a lot of money you can get out right away otherwise you can join with a swing trade robbers and continue the heist plan, Use Trailing SL to protect our money.
Stop Loss : Recent Swing Low using 4h timeframe
Warning : Fundamental Analysis comes against our robbery plan. our plan will be ruined smash the Stop Loss. Don't Enter the market at the news update.
Loot and escape on the target 🎯 Swing Traders Plz Book the partial sum of money and wait for next breakout of dynamic level / Order block, Once it is cleared we can continue our heist plan to next new target.
Support our Robbery plan we can easily make money & take money 💰💵 Follow, Like & Share with your friends and Lovers. Make our Robbery Team Very Strong Join Ur hands with US. Loot Everything in this market everyday make money easily with Thief Trading Style.

BCH CHART UPDATE in 3-Day TimeframeHello everyone, I’m Cryptorphic.
For the past seven years, I’ve been sharing insightful charts and analysis.
Follow me for:
~ Unbiased analyses on trending altcoins.
~ Identifying altcoins with 10x-50x potential.
~ Futures trade setups.
~ Daily updates on Bitcoin and Ethereum.
~ High time frame (HTF) market bottom and top calls.
~ Short-term market movements.
~ Charts supported by critical fundamentals.
Now, let’s dive into this chart analysis:
BCH broke down below the crucial support trendline a couple of weeks ago, but it managed to hold support at $292.3. BCH responded with a nice rebound and is currently testing the $402 resistance (previous support trendline).
If BCH is rejected from the current market price, we still have lower supports at the $292.3 and $220 levels to hold the price. A breakout above the trendline will likely be a good sign for BCH.
- Primary Support: $292.3.
- Lower Support: $220.
- Resistance: $402.
DYOR, NFA.
Please hit the like button to support my content and share your thoughts in the comment section. Feel free to request any chart analysis you’d like to see!
Thank you!
#PEACE

$BCH : Short or Long? I vote Short!!!!Bitcoin Cash was created as an alternative to the first and most valuable cryptocurrency — Bitcoin (BTC). In 2017, BCH developers modified the BTC code, releasing their software version and a full-fledged competitive product, which split Bitcoin into two blockchains: Bitcoin and Bitcoin Cash. Bitcoin Cash is a result of a hard fork in the blockchain due to differences in the community over Bitcoin scaling and the SegWit upgrade. Moreover, another hard fork, which divided Bitcoin Cash into two parts, Bitcoin ABC and Bitcoin SV, took place in the fall of 2018.

BCH: Oversold at SupportTrade setup : Trends are mixed but price remains above 200-day moving average, which keeps the long-term Uptrend alive. Price has pulled back to 200 SMA (support) and near $350 horizontal support, and also getting oversold (RSI ~ 30), which could be an attractive swing trade entry with +25% upside to $500. Stop Loss (SL) at $340.
Pattern : Price is Oversold at Support . This trading strategy finds assets that are oversold (RSI < 30) and are near a support area, which means there's a high probability that price will bounce up near-term. Oversold conditions are typically reached when RSI hits 30 or less. Learn this trading strategy in Lesson 5.
Trend : Short-term trend is Strong Down, Medium-term trend is Strong Down and Long-term trend is Neutral.
Momentum : Price is neither overbought nor oversold currently, based on RSI-14 levels (RSI > 30 and RSI < 70).
Support and Resistance : Nearest Support Zone is $350.00, then $300.00. Nearest Resistance Zone is $400.00, then $530.00.

BCHUSDT Will the Rebound Hold or Break Down?Yello, Paradisers! Is #BCHUSDT about to make a significant move? Let's break it down.
💎#BCH is currently showing a rebound, but it might just be a retest of the resistance before continuing downward to the support zone at $330 - $300. However, if BCH manages to break out above the $400 resistance, it could be a strong indicator that the price will continue upward, probability of hitting our target without dipping into the support zone.
💎In the support zone, there is a high probability that BCH will rebound since this area hasn't been visited since BCH made a significant breakout previously. If BCH shows a positive sign, like a bullish candle rejection in the support zone, it indicates that the support is holding, and the price could move upward.
💎On the other hand, if BCH fails to show positive signs in the support zone, this could be a bad sign. If the support breaks, the price might continue downward to the weekly Order Block (OB) at $256. There are many buyers in the weekly OB, so the probability of a rebound here is high. Reclaiming above the support zone would keep the bullish scenario valid.
💎However, if BCH fails to sustain above the OB area and breaks down further, the bearish trend will likely continue, and the bullish scenario will be invalidated.
Trade smart, Paradisers, and stay disciplined!
MyCryptoParadise
iFeel the success🌴

BCH ANALYSIS (4H)From where we put the "start" on the chart, it looks like a triangle is forming.
The depth of wave D is high, which strengthens the possibility of forming a triangle.
It is expected that we will have a return from the green range to the red range and then the main drop will occur
Closing the daily candle above the invalidation level violates the analysis
For risk management, please don't forget stop loss and capital management
Comment if you have any questions
Thank You

#BCH/USDT#BCH
The price is moving within a 1-day ascending channel pattern, which is a retracement pattern
We have a bounce from a green support area at 405.00
We have a tendency to stabilize above the Moving Average 100
We have an upward trend on the RSI indicator that supports the rise and gives greater momentum
Entry price is 466.05
The first target is 571.10
The second goal is 620.40
The third goal is 692.20

BCH ANALYSIS🚀#BCH Analysis :
🔮As we can see in the chart of #BCH that there is a formation symmetrical triangle pattern. Also there is a perfect breakout. But there is an instant resistance zone and if #BCH sustain this breakout and also breakout the resistance 1 zone then we would see a bullish move📈📈
🔰Current Price: $492.9
🎯 Target Price: $700
⚡️What to do ?
👀Keep an eye on #BCH price action. We can trade according to the chart and make some profits⚡️⚡️
#BCH #Cryptocurrency #TechnicalAnalysis #DYOR


BCH ( Bitcoin Cash ) tm:1hHello traders.
I hope you doing well.
These areas are based on my personal strategy and I will share it with you.
Open a sell position on the supply area or open a buy position on the demand area.
Your entry point, stop loss, and target point are based on money management and the amount of money in your trading account.
But I promise you that by trading in the areas of my trading strategy, you will definitely make a profit, because these areas, although they seem simple, are my experience of 8 years of learning and trading.
I hope you will achieve maximum continuous profit with me by using supply and demand areas.
Good luck traders.
Mohammad Goodarzi

BCHUSDT #02 ( BCH is ready for Bullish move ,fasten seat belts )Hello dear traders.
Good days.
Monthly And Daily Bullish Gann Square Reversal time zone matched and exactly after that bull run started .
On long shy view Monthly Gann Square we can see 5000 $ price around Nov-2025 , but on Daily Gann Square Time Frame as you see on chart we can expect 830 $ price for BCHUSDT which is 0.618 Daily Gann Box price level .
It can increases to about 1000 $ on daily Time frame which will be 0.75 Gann Box price level.
Road map is plotted with help of Gann Square and Gann Box.
Good luck and safe trades.
Thanks for your support and comments .

BCHUSD Bitcoin Cash/USD Bullish Robbery PlanMy Dear Robbers / Traders,
This is our master plan to Heist BCHUSD Bank based on Thief Trading style Technical Analysis.. kindly please follow the plan I have mentioned in the chart. Our target is Red Zone that is High risk Dangerous level Police Force is waiting for our arrival, market is overbought / Consolidation / Trend Reversal at the level Bearish Robbers / Traders gain the strength. Be safe and be careful and Be rich.
Note: If you've got a lot of money you can get out right away otherwise you can join with a swing trade robbers and continue the heist plan,
Loot and escape on the target 🎯 Swing Traders Plz Book the partial sum of money Use Trailing Stop To Protect Looted Money and wait for next breakout of dynamic level, Once it is cleared we can continue our heist plan to next new target it will update after the Breakouts.
support our robbery plan we can easily make money & take money 💰💵 Join your hands with US. Loot Everything in this market everyday.

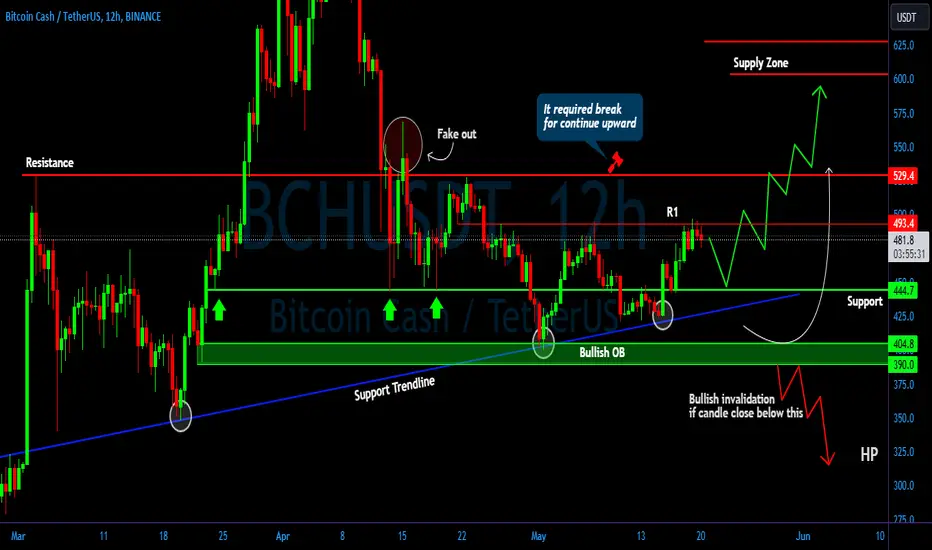
BCH/USDT It shows reject potential will revisit the support area💎 Paradisers, #BCH is indeed a coin worth monitoring closely.
💎 It appears that BCH faced rejection at the resistance level after attempting to break out. Based on current price action, there's potential for BCH to retest the support area around 445. If this scenario plays out, we might witness a bounce from this support level, with BCH resuming its upward trajectory and attempting to break above the resistance at 493.
💎 A successful breakout above 493 could pave the way for BCH to target the 530 area, which serves as the next significant resistance level. Breaking through this level would be crucial for BCH to sustain its upward movement and potentially reach our target supply zone area.
💎 However, if BCH fails to bounce from the support area and even breaks below it, the next target would be the support trendline. This level is critical as it represents a key support level that BCH needs to bounce from to maintain a bullish outlook.
💎 If BCH also breaks below the support trendline, there's still one more opportunity for support at the Bullish OB area around 405 - 390. A successful bounce from this area, accompanied by a reclaim of the support level, could signal a bullish momentum shift for BCH.
💎 On the contrary, if BCH breaks below the Bullish OB area, it would confirm bearish sentiment, and the bullish invalidation would be valid. In this scenario, we could expect BCH to continue its downward trajectory, potentially experiencing further dips.
MyCryptoParadise
iFeel the success🌴
BCH Has Formed An Inverse H&SLet's analyze BCH on the daily chart! Let’s dive 🤿
1) BCH has formed a sideways inverse H&S pattern, which is known as a reversal pattern. The neckline of the inverse H&S pattern has been broken, confirming the pattern. The target price would be $600 per BitcoinCash 🚀
2) We also have the Double Bottom pattern, which forms this way: When some buyers purchase crypto at the bottom and push the price up to the Neckline, it gets rejected by sellers. After that, the price falls again to the same bottom line. Then, another group of buyers enters and buys at the bottom, pushing the price back up to the Neckline. If buying pressure is strong enough, the Neckline will get broken. Once the Neckline is broken, sellers become worried because the momentum is changing, creating an upward trend! Currently, we are in this situation 🚀
3) And lastly, a bullish scenario for BCH is that it has broken a one-month downward trend line. This is another confirmation that we are changing momentum 🚀

BCHUSD Bearish side Money Heist PlanMy Dear Robbers / Traders,
This is our master plan to Heist Bearish side of BCH/USD Market based on Thief Trading style Technical Analysis.. kindly please follow the plan I have mentioned with target in the chart focus on Short entry, New Robbers who looking to join the heist they should enter after the breakout only. Our target is Green Zone that is High risk Dangerous area market is overbought / Consolidation / Trend Reversal at the level Bearish Robbers / Traders gain the strength. Be safe and be careful and Be rich.
Loot and escape on the target 🎯 Swing Traders Plz Book the partial sum of money and wait for next breakout of dynamic resistance level, Once it is cleared we can continue our heist plan to next target.
support our robbery plan we can make money & take money 💰💵 Join your hands with US. Loot Everything in this market everyday.

Bitcoin Cash BCH Intraday Trade SetupThe chart highlights breakout/rejection points, criteria, and targets to execute on the trade opportunity.

BCH/USDT breakout from falling wedge? 👀🚀BCH Analysis💎 Paradisers, #BCHUSDT has successfully broken out of its falling wedge pattern, indicating a probable continuation of the upward trend.
💎 We'll await a retest for confirmation before planning our trade, as a retest phase often follows a breakout and provides an excellent opportunity to verify bullish momentum. If #BITCOINCASH can maintain support at $441 and continue its upward trajectory, the next target lies in the resistance zone identified in our target range.
💎 However, if #BCH fails to sustain support and drops below the $441 area, it could signal a weakening of the bullish trend. In this scenario, the price may decline further towards the next significant support level, around $401.
💎 Historically, BCH has shown resilience by rebounding decisively from the $401 support level. If this pattern holds, a strong bounce could occur, potentially reclaiming the $441 support zone and advancing toward our intended target.
💎 Should SET:BCH struggle to rebound convincingly from $401 and exhibit declining volume, it may suggest a breakdown in bullish momentum. A decisive close below this critical support could challenge the bullish outlook, leading to a more bearish trend.
MyCryptoParadise
iFeel the success🌴

BITCOIN CASH BOOMLets take a quick look at the BTC pair in LOG SCALE:
Consider this to be pornographic chart content
BCH is gonna finish a 5+ year long falling wedge after hitting exactly 2.618 fib level
Once this break out, its gone with a BOOM !
Hold my beer pls
----
No financial advice, do your own research, don't be stupid
