Bitcoin Cash price might rise above 265Hi everyone,
Bitcoin Cash managed to stay above 200 price level and now trading above 200-220 support area. At the moment BCH is looking exteremely bullish and most likely it will touch lower boundary of 265-290 resistance area.
At this point I see that BCH can trade within 265-290 area but don't think that it can rise higher than that. It also depends on if Bitcoin price manage to hold above 29k-30k levels.
Overall Bitcoin Cash is looking very bullish and I don't expect significant downfall on it.
Let's see how far Bitcoin Cash will manage to rise.
Please, do not forget to boost this idea & share it with your friends; thanks.
Bchusdt

BCH/USDT Could BCH Break the key resistance or will be rejected?💎BCH has recently demonstrated significant market dynamics, currently facing a key resistance area.
💎 A successful breakout above this resistance could lead to a significant upward movement, probability reaching our target area.
💎 However, if BCH fails to break this key resistance level, it may face rejection and retreat towards the demand area around $289. This retracement could serve as an opportunity to build new momentum.
💎 If BCH fails to bounce from the demand area and attempts to break the resistance again, it could indicate weakness. In such a scenario, there is a possibility of a breakdown, with BCH returning to test the support of the ascending channel, and potentially moving even lower.

BCH/USDT Potential BCH Back test on the resistance of ascending!💎 BCH has recently exhibited significant market dynamics. Currently, BCH is in the process of climbing upward and is testing the resistance trendline of the ascending channel, which probability coincides with the Bearish OB and supply zone.
💎 If BCH fails to break above this resistance, the price may retreat to the support trendline area. Historically, BCH has often bounced back after touching the support trendline of the ascending channel. However, a breakdown below this support could signal a bearish trend reversal, potentially leading the price to the demand area in the range of $219 to $212.
💎 The demand area is a critical zone where a bounce is necessary to sustain the upward movement. A concerning scenario would unfold if BCH breached the demand area, confirming a downward trend with the price likely targeting lower support levels.

Long Bitcoin Cash (BCH) to $310Trading is slower recently with less than usual decent trade setups. But this looks like a good setup. With VRVP supporting current price with high volume and this coinciding with the bottom of a larger up-trending channel entry here is nearly as good as we can expect. Additionally, our daily RSI is in a fair range.
We do have some resistance to get through. 237 is a level of resistance along with the 100 day SMA just above that. But if those can be defeated, we're well on our way.
Target #1 - 254
Target #2 - 270
Target #3 - 288
Final Target - 311
I plan to take 25 percent off at the first target and raise my SL to break even. Thereafter, every target reached will be another quarter off of my full position and a raised SL to the preceding level.
Risk/Reward on this is a healthy 5/1 with my stop out placed at 222.
Best,
Stew

BCH Feb 13th long-term updateAnother week and another free sharing from the TTR most recent #cryptocoin pick update:
Bitcoin Cash is another quite undervalued token. The breakout level sits at 329.50 followed by a main breakout zone resistance at $400-410
I don’t own much of this coin, only 20, but I see great potential here if 1450 is broken to the upside. A test of the 1400-1450 zone will be a big one as it will set a W multi-year pattern and potentially can breakout hard with an upside target of 3225 and ideally above 4.5k
I like the potential here, but I won’t be long if 1450 is not broken to the upside by sometime this year, especially if BTC will be above 90k
There is a clear 4-5x potential here, and I’m fine with holding this token till the 1400 zone exit at minimum.

BCH LongTook aggressive Long entry.
Might reject a breakdown and continue from here.
Very Risky pick but if Continued I would love the reward.
Initially target 257.
Longed 234.82 with leverage stops at 234 very tight.

🚧BCHUSDT will Go Up Again🚧 Road Map(4-H)🗺️!!!➡️ Due to the ascending structure of the chart
- High potential areas are clear in the chart
- You can look for reasons to enter according to your own personal strategy after approval.
🤑Stay awesome my friends.
_ _ _ _ _ _ _ _ _ _ _ _ _ _ _ _ _ _ _ _ _ _ _ _ _ _ _ _ _ _ _ _ _
✅Thank you, and for more ideas, hit ❤️Like❤️ and 🌟Follow🌟!
⚠️Things can change...
The markets are always changing and even with all these signals, the market changes tend to be strong and fast!!

BCHUSD is potentially poised for a substantial price upswingBINANCE:BCHUSD BCHUSD (W)
BHCUSD may have a strong price increase coming up. Waiting for confirmation of price and volume explosion!
Following the preceding abrupt surge in price accompanied by elevated volume, BCH has undergone a correction spanning over 30 weeks, characterized by diminishing volume and price consolidation. The signal from the MA20 line consistently aligns with the evolving price dynamics.
Is it plausible to anticipate the occurrence of High Volume, accompanied by a substantial surge in price amplitude within this digital currency?
Follow us and read my status to follow more forexsignal !

BCH: Sideways ChannelTrade setup : Trends are mixed. Trading in a Sideways Channel ($215 - $260). Swing Traders: can trade the channel: enter near $215 support, with +20% upside potential back to $260 channel resistance.
Pattern : Price is trading in a Sideways Channel , which is a neutral pattern (indication of market indecision). Trend Traders ought to wait for a breakout in either direction, although typically it breaks in the direction of the existing trend. Swing Traders can trade the range – Buy near Support and Sell near Resistance.
Trend : Neutral on Medium-Term basis and Uptrend on Short- and Long-Term basis.
Momentum is Mixed as MACD Line is below MACD Signal Line (Bearish) but RSI ~ 50 (Neutral). MACD Histogram bars are rising, which suggests that momentum could be nearing another upswing.
Support and Resistance : Nearest Support Zone is $200 (previous resistance), then $140 - $150. The nearest Resistance Zone is $260, then $330.

BCH from a SMART MONEY point of viewAccording to the reviews we have had on the chart, we have determined the high and low liquidity pools.
The liquidity pools of the upper area have been swept and candles have hit SUPPLY. Now there are two TPs ahead of the price.
We have liquidity pools in the lower areas.
To achieve TP 2, it is necessary to break the range of TP 1. TP 2 range is a suitable place for buy/long positions

it's time to going up for BCHUSDTbefore buying, please check for being sure about your opinion about this CRYPTOCURRENCY!!!
(in every target you want, closed the position but our target is the third one)
*Guy's the entry place is importance things in enter in a position and be careful do not going up your leverage over 7x ,all things it's about risk management*
*************************************************
if you want to enter in this position:
Enter Price:
Target1: 259.98
Target2: 264.51
Target3(Final Target): 268.14
Stoploss: 251.35
*************************************************
Guy's if this idea was useful and it was intresting for you please follow for more
please do comment and like my idea
If you like my idea show me in comment section
doing and living in the best quality
thanks of all of you dear's ;)

BCH: Pullback in UptrendBitcoin Cash (BCH) technical analysis:
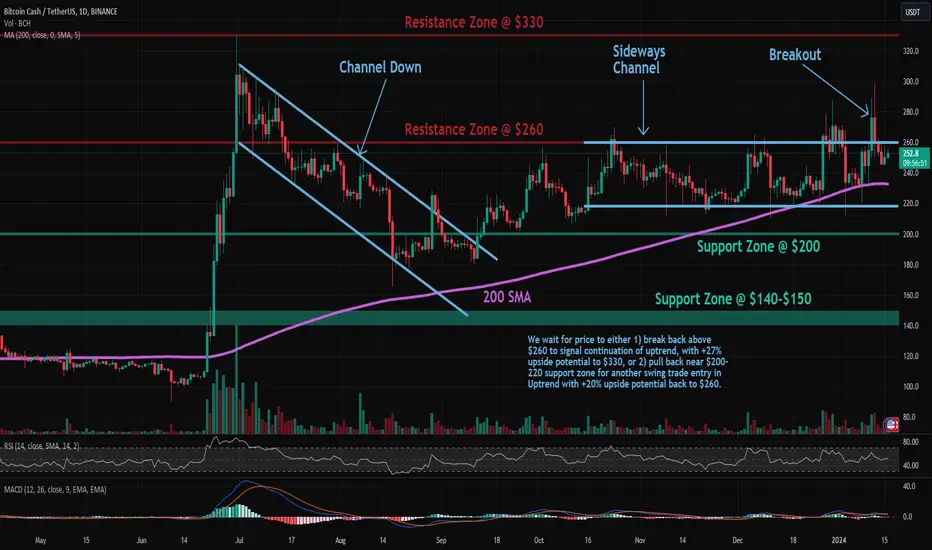
Trade setup : Price is in an uptrend. Following a bullish breakout from Sideways Channel ($218 – $260), above $260 resistance, price rallied 20% to $300, then pulled back to retest that breakout level. Now we wait for price to either 1) break back above $260 to signal continuation of uptrend, with +27% upside potential to $330, or 2) pull back near $200-220 support zone for another swing trade entry in Uptrend with +20% upside potential back to $260.
Trend : Uptrend across all time horizons (Short- Medium- and Long-Term).
Momentum is Mixed as MACD Line is below MACD Signal Line (Bearish) but RSI ~ 50 (Neutral).
Support and Resistance : Nearest Support Zone is $200 (previous resistance), then $140 – $150. The nearest Resistance Zone is $260, then $330.
BCH tradeNYSE:BCH update...
#BCH filled the last 15m FVG Lets see if it holds this time... PP at previous high...
#trading #BitcoinCash

Bitcoin Cash still can riseHi everyone,
Bitcoin Cash is trading within a narrow price range between 220 and 265.
The price is consolidating at the moment and this is good sign for the bulls because at any time it can start pumping.
Also, note that, BCH is trading within rising channel and its price currently on the lower bound of the channel. All this indicating that price more likely will go up than down.
Bitcoin Cash looks bullish but traders should be careful at this point since if there will be strong price correction on Bitcoin then BCH price might follow and drop at least up to 200 price level.
Otherwise there is good chance that BCH might rise at least up to 265 resistance.
Please, do not forget to boost this idea & share it with your friends; thanks.

BCH: Sideways Channel BreakoutTrade setup : Bullish breakout from Sideways Channel ($218 - $260), above $260 resistance, signals resumption of uptrend, with upside to $330 next. Stop Loss (SL) at $250 (just below breakout level).
Pattern : Price was trading in a Sideways Channel , which is a neutral pattern (indication of market indecision). Trend Traders ought to wait for a breakout in either direction, although typically it breaks in the direction of the existing trend. Swing Traders can trade the range – Buy near Support and Sell near Resistance.
Trend : Uptrend across all time horizons (Short- Medium- and Long-Term).
Momentum is Bullish (MACD Line is above MACD Signal Line and RSI is above 55).
Support and Resistance : Nearest Support Zone is $200 (previous resistance), then $140 - $150. The nearest Resistance Zone is $260, which it broke, then $330.

BCHUSDTBINANCE:BCHUSDT Short idea
⛔"Daily crypto market analyses I provide are personal opinions & not financial advice. Trading carries risks, so do your own research & seek advisor's help. #DYOR
Don't forget to 🚀 and comment

BCHUSDT Supply Zone Break & Sustained Bullish PhaseSince June 2023, Bitcoin Cash experienced a significant shift from bearish to bullish sentiment following its breakout above the crucial supply zone. The subsequent re-test of this zone turned it into a support/demand area.
Notably, the most recent clean rejection at the 50% Fibonacci level during a yesterdays' dump underscores buyer interest at this price point. This supports the active bullish phase, increasing the probability of a continued long-term uptrend.
With attention drawn to two key resistance areas at $433 and $574, there's a potential upside of 110-175% for BCHUSDT in the coming month or two.

BCHUSD Strong bullish in bearish marketWhile BTC struggle with bearish wave, BCH move in a stong bullish with expanding channel up.
Its little bit late to follow bullish at BCH,
the best option we have is to wait for small pullback at fibonacci point or wait at support if you aim for low risk.
Target for BCH at channel up resistance or at previous high.
Maximum target for BCH at $423 as fibonacci projection.

BCH ANALYSIS (1D)According to the BCH chart, it looks like a flat pattern has ended with a terminal c.
Another bullish wave should emerge. The price targets are clear on the image.
Fixing a daily candle below the green range will violate the analysis.
For risk management, please don't forget stop loss and capital management
When we reach the first target, save some profit and then change the stop to entry
Comment if you have any questions
Thank You

BCH ANALYSIS💥💥#BCH Analysis : Breakout 💸💸
🔮#BCH was testing a crucial key level at $230 and following a symmetrical triangle. Now we can see a perfect breakout here in #BCH. It indicates the start of an upward trend. 💲💲
👀Current Price: $265
🚀 Target Price: $390
🏷Remember, the crypto market is dynamic in nature and changes rapidly, so always use stop loss and take proper knowledge before investments.
#BCH #Cryptocurrency #Breakout #TechnicalAnalysis #DYOR

BCH: Sideways ChannelTrade setup : Trends are mixed and price is trading in a Sideways Channel ($218 - $260). Swing Traders can trade the range – Enter near Support ($218) and Exit near Resistance ($260). Trend Traders ought to wait for a breakout in either direction. If it’s able to break above $260 resistance, it could resume its uptrend and revisit $330 level from July.
Pattern : Price is trading in a Sideways Channel , which is a neutral pattern (indication of market indecision). Trend Traders ought to wait for a breakout in either direction, although typically it breaks in the direction of the existing trend. Swing Traders can trade the range – Buy near Support and Sell near Resistance.
Trend : Downtrend on Short-Term basis, Neutral on Medium-Term basis and Uptrend on Long-Term basis.
Momentum is Mixed as MACD Line is below MACD Signal Line (Bearish) but RSI ~ 50 (Neutral).
Support and Resistance : Nearest Support Zone is $200 (previous resistance), then $140 - $150. The nearest Resistance Zone is $260, then $330.

BCH Pump is Loading BCH Pump is Loading
After the last Breakout its still in another downtrend weekly trend if it breakout 2 X from here is very likely , keep an eye on it

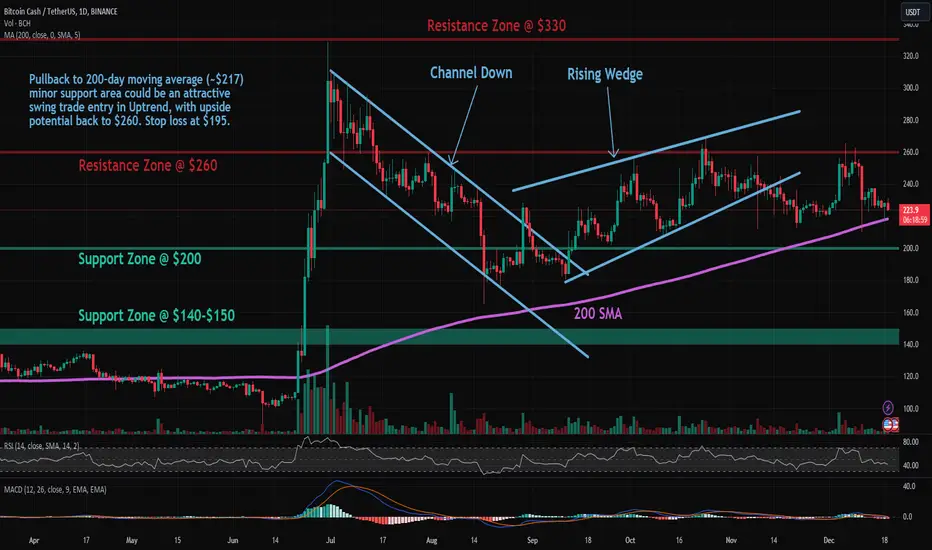
BCH: Pullback in UptrendTrade setup : Price remains in an Uptrend. Pullback to 200-day moving average (~$217) minor support area could be an attractive swing trade entry in Uptrend, with upside potential back to $260. Stop loss at $195. Price has been rejected near $260 resistance zone several times in the last three months, making this a critical level. If it’s able to break above $260 resistance, it could resume its uptrend and revisit $330 level from July.
Trend : Downtrend on Short-Term basis and Uptrend on Medium- and Long-Term basis.
Momentum is Bearish (MACD Line is below MACD Signal Line, and RSI is below 45).
Support and Resistance : Nearest Support Zone is $200 (previous resistance), then $140 - $150. The nearest Resistance Zone is $260, then $330.