Bchusdt

BCH ANALYSIS💥💥#BCH Analysis 🚀🚀
🔮 #BCH is trading in a Symmetrical Triangle Pattern and the price got rejected from it's trend line. A good move will be seen only if it breaks the trendline. If the price closes above above $255 then we will see a bullish move. 💸💸
📊Current Price: $233.2
🚀 Target Price: $390
⚡️What to do ?
👀Keep an eye on #BCH price action and volume. We can trade according to the chart and make some profits. Stay tuned for further analysis and stay updated with market sentiments and news.⚡️⚡️
🏷Remember, the crypto market is dynamic in nature and changes rapidly, so always use stop loss and take proper knowledge before investments.
#BCH #Cryptocurrency #TechnicalAnalysis #DYOR

BCH: Approaching ResistanceBitcoin Cash (BCH) technical analysis:
Trade setup : Price remains in an Uptrend, trading above 200-day moving average. However, it’s been rejected near $250 resistance zone several times in Oct and Nov. If it’s able to break above $250 resistance, it could resume its uptrend and revisit $330 level from July.
Trend : Uptrend across all time horizons (Short- Medium- and Long-Term).
Momentum is Bullish (MACD Line is above MACD Signal Line and RSI is above 55).
Support and Resistance : Nearest Support Zone is $200 (previous resistance), then $140 – $150. The nearest Resistance Zone is $250, then $330.

BCH is ready for a jumpThe strength of the bearers has been taken and the downtrend has weakened
A triggerline has been established and we have also had a bullish CH and orders have been received from the DEMAND zone.
Price is ready to move towards TP.
For risk management, please don't forget stop loss and capital management
Comment if you have any questions
Thank You

BCH/USDT Broke Out of a Descending Channel | 🚀👀 What's Next?💎 Paradisers, get ready for a promising trading opportunity with BCHUSDT. The asset is currently making significant moves in the demand zone, suggesting a potential shift towards an upward trend.
💎 BitcoinCash has been diligently following a descending channel. Its recent breakout from this channel suggests an upward move towards a resistance level, likely to be followed by a rapid pullback, aligning with its usual market pattern.
💎 There's a strong chance of a bullish trend starting from the support level at around $235. Having effectively broken out of the descending channel, BCH is now targeting resistance levels near $305.
💎 Timely decision-making is key for astute Paradisers. Pinpointing the most advantageous entry points during this upward trend is crucial, and it's wise to exercise caution to avoid entering at the height of the trend.
💎 Remain vigilant, as there is also a risk of BCH falling below the support level of $212. A decline below this important threshold could cast doubt on the sustainability of the upward trend.

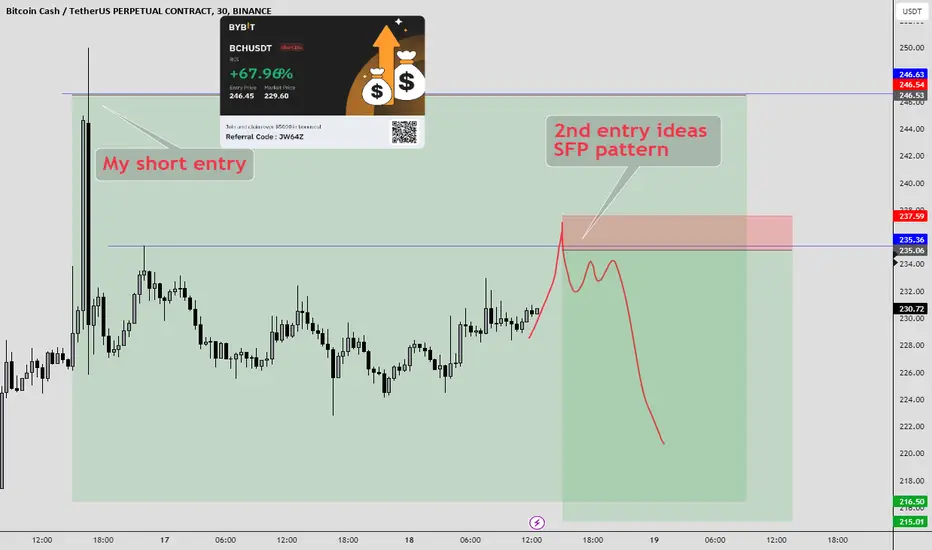
BCH: Rising Wedge BreakoutBitcoin Cash (BCH) technical analysis:
Trade setup : Bearish breakout from a Rising Wedge pattern, could lead to a pullback to $200 support area (and 200-day moving average) in the near-term, which could be an attractive swing trade entry, with upside potential back to $250.
Pattern : Rising Wedge It usually forms after an uptrend and suggests a potential bearish reversal in the original uptrend. When price breaks the lower trend line the price is expected to trend lower.
Trend : Neutral on Medium-Term basis and Uptrend on Short- and Long-Term basis.
Momentum is Mixed as MACD Line is above MACD Signal Line (Bullish) but RSI ~ 50 (Neutral).
Support and Resistance : Nearest Support Zone is $200 (previous resistance), then $140 – $150. The nearest Resistance Zone is $250, then $330.

BCH: Rising Wedge BreakoutBitcoin Cash (BCH) technical analysis:
Trade setup : Bearish breakout from a Rising Wedge pattern, could lead to a pullback to $200 support area (and 200-day moving average) in the near-term, which could be an attractive swing trade entry, with upside potential back to $250.
Patterns : Rising Wedge It usually forms after an uptrend and suggests a potential bearish reversal in the original uptrend. When price breaks the lower trend line the price is expected to trend lower.
Trend : Downtrend on Short-Term basis, Neutral on Medium-Term basis and Uptrend on Long-Term basis.
Momentum is Bearish but inflecting. MACD Line is below MACD Signal Line and RSI is below 45 but momentum may have bottomed since MACD Histogram bars are rising, which suggests that momentum could be nearing another upswing.
Support and Resistance : Nearest Support Zone is $200 (previous resistance), then $140 – $150. The nearest Resistance Zone is $250, then $330.

BCHUSDT Forms Prominent Triangle on Daily ChartCurrently Bitcoin Cash KRAKEN:BCHUSDT market is undergoing consolidation near the crucial support line of the triangle, setting the stage for potential movement in the coming days.
💜 If you appreciate our charts, support us with boost button 💜
Technical Insights:
Pattern Formation: The development of a large triangle formation suggests a period of indecision and potential market coiling.
Support Consolidation: The present consolidation near the support line within the triangle signifies a critical juncture for market participants.
Anticipated Rebound: The upcoming days could unveil a noteworthy rebound to the upside, fueled by the dynamics of the triangle pattern.
Key Levels Within the Triangle:
Support Zone: The support line within the triangle is prominently situated at $222, acting as a crucial level for market stability.
Resistance Zone: Positioned at $247, the resistance within the triangle marks a pivotal barrier that the market must contend with.
Strategic Considerations:
Observing the Triangle: Keep a vigilant eye on the ongoing consolidation within the triangle as it often precedes significant price movements.
Reversal Potential: The bounce from the support line presents an opportunity for a bullish reversal, with the $247 resistance level serving as a target.
Stay tuned for potential breakout or breakdown scenarios. The $222 support and $247 resistance levels will likely play pivotal roles in determining the next phase of Bitcoin Cash's price action.
Happy trading!

BCH Trading Forecast: Bullish Momentum at $155 Level📈 Trading Forecast: Bullish Outlook for BCH as Long Position Opportunity Emerges at $155 🚀
Based on my comprehensive mathematical analysis and the formation of a bullish cup pattern on the weekly chart, I have identified a prime opportunity to open a long position on BCH (Bitcoin Cash) at the $155 level. This level aligns with key support and shows strong potential for an upward price movement.
📊 Technical indicators support this analysis, indicating positive momentum and increasing buying pressure. The cup pattern suggests a bullish trend reversal, with the potential for significant gains in the near future.
💰 With this valuable insight, traders can strategically position themselves to capitalize on potential profits. However, it's essential to monitor price action closely and implement proper risk management strategies.
🔎 Stay tuned for further updates and analysis as we closely track the market's movements. Happy trading and remember to always conduct your own research before making any investment decisions!
Disclaimer: This post is for informational purposes only and should not be considered financial advice. Trade at your own risk."
↪️Follow and see for yourself

BCH 232 Long! Accelerate 300 usdt to 1000 on 5xBCH 232 Long! Accelerate 300 usdt to 1000 on 5x
Crypto trading marathon!
"Making 1000 out of 300 on 5 leverage".
Stop 230
Take profit 256.5
How many days will we need to accelerate the deposit?
7 days?
15 days?
30 days?
No way!
Write in the comments below!
Trade with us, trade better than us!

BCHUSDTBINANCE:BCHUSDT Short idea
i think short program started and first victim is BCH
⛔"Daily crypto market analyses I provide are personal opinions & not financial advice. Trading carries risks, so do your own research & seek advisor's help.#DYOR"
Don't forget to like and comment

BCH/USDT ↘️Hello Everyone 🙋🏽♂️
🔴 248.40
🟢 224.10
We are not responsible of any losses for anyone, our trades are profitable more for long terms and we take losses as everyone,
manage your lot size as well and your SL and TP
Don't forget to hit the like bottom and write a comment to support us.
Follow us for more 🙋🏻♂️
Best Regard / EMA Trading .
Disclaimer:
----------------
It's not a financial advise, As everyone we take losses sometime but for long term trading we are profitable traders, so manage your account well with SL and TP and your lot size to keep your account safe and stay in the market .

BCH Full update and 2 trades that we took during this week BCH Full update and 2 trades that we took during this week
Lean how we took it

BCH/USDT Likely Ready For Bullish Rally?🚀BCH Analysis💎Paradisers, focus on BCHUSDT! Its current trajectory within the demand zone is nothing short of compelling. With evident buying momentum, it's poised for a potential bullish surge.
💎Historically, BitcoinCash has navigated within a descending channel. After its recent encounter with the channel's lower boundary, it's reigniting its bullish momentum. We're optimistic about its chances to rise towards the projected resistance.
💎Yet, caution remains essential. If BCH slips below the demand zone, it's highly probable it will retreat to the support for further assessment.
💎Enhance your trading decisions for BCH with ParadiseFamilyVIP. Delve into our expert analyses on BCH and other potential tokens, refining your crypto approach.

Bitcoin Cash BCHUSDT Price Analysis 8hBitcoin Cash BINANCE:BCHUSDT is on the cusp of a significant breakout, currently consolidating within a well-defined cup and handle pattern. A breach from this pattern signifies a potential upward surge towards robust resistance zones around $280 and $300. With current price at $230.
Pattern Analysis: Bitcoin Cash is consolidating within a cup and handle pattern, a classic bullish formation indicating a potential uptrend continuation.
Breakout Anticipation: A breakout above the pattern's upper boundary is expected to trigger a substantial upward movement, targeting resistance levels near $280 and $300.
Support Zones: Vital support zones lie at $218-220 and $200, acting as crucial levels to watch during price retracements.
Bullish Sign: Multiple bullish Falling Wedges within the cup and handle pattern highlight a positive market sentiment, suggesting a potential rise in BCH value.
Stay vigilant for the imminent breakout, as it could mark the beginning of a significant uptrend in Bitcoin Cash's price. We should closely monitor the support levels and consider entry points cautiously based on the pattern's confirmation.
Happy trading!

BCH - Go to HalvingBitcoin Cash halving countdown 190days.
Reward-Drop ETA date: 22 March 2024, 03:06 UTC
Target above 450$ before 3/2024

BCH analysis (short term)Hi, dear traders. how are you ? Today we have a viewpoint to SELL/SHORT the BCH symbol.
For risk management, please don't forget stop loss and capital management
When we reach the first target, save some profit and then change the stop to entry
Comment if you have any questions
Thank You

Bitcoin Cash BCH long medium-term trade #22Yesterday, the BCHUSDT price behaved quite well during the "circuses" that were organized using trigger words: "ETF" "BlackRock" "SEC"...
This manipulation "deleted" many shorts positions... but gave two points for reflection:
- there is strong demand for growth. The slightest trigger in the form of a tweet and the price of BTC is ready to push up +7.5% in 15 minutes, the last time it seems to have happened in 2017.
- What if, yesterday, many shorts' stop orders were deliberately knocked down to make it easier to fall without "extra passengers"? (There have always been paid-for articles or "accidental mistakes" in publications on the crypto market - it's a matter of price and benefit.)
Write in the comments what do you think happened yesterday and what will happen next?
Nevertheless, we are here to trade and make money on it. Therefore, we bring to your attention the conditions on which we are ready to enter the medium-term BCHUSD trade
Entry: in the range of $177.6-189.6 (the desired average price is $183.6)
Stop: $165.4 (-9.9%)
Take profit: $305.60 (+65.45%)
P/L ratio: 6.7/1
For now, we are taking a more pessimistic scenario as a basis, a price correction of -20% from the current one. Since it is not yet clear whether yesterday's manipulative events have finally worked on the price and what the final goal of the manipulation was.
However, if the BCH price corrects relatively smoothly and slows down around $201 (-12%) , then this is also a reasonable and convenient point to enter long.
We will closely monitor the movement of the Bitcoin Cash price and, if necessary, update the idea and the trade to adjust to the market situation.
Therefore, if you are interested in the BCHUSDT trade, please like, comment, and subscribe to us, and Tradingview will send you a notification when the idea is updated.

BCH still has many drops to come!From where I wrote "START" on the chart, the BCH symbol has entered the corrective phase.
Examining the waves, we seem to be inside an ABC.
Wave A has formed and we are now in Wave B. Our B wave has become a diametric, the last wave of which is only g left.
It is expected that wave G from B will end in the red supply box or a little higher, and we will enter wave C of a big drop and go down to the lower green box on which I wrote TP.
I specified the invalidation level, that closing a daily candle above this level will violate the analysis
For risk management, please don't forget stop loss and capital management
Comment if you have any questions
Thank You

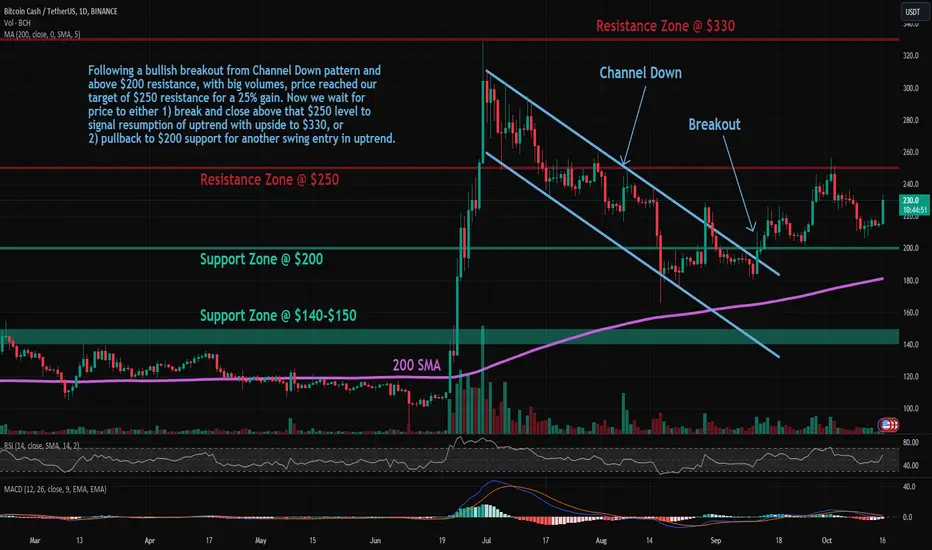
BCH: Approaching SupportBitcoin Cash (BCH) technical analysis:
Trade setup : Following a bullish breakout from Channel Down pattern and above $200 resistance, with big volumes, price reached our target of $250 resistance for a 25% gain. Now we wait for price to either 1) break and close above that $250 level to signal resumption of uptrend with upside to $330, or 2) pullback to $200 support for another swing entry in uptrend.
Trend : Downtrend on Short-Term basis and Uptrend on Medium- and Long-Term basis.
Momentum is Mixed as MACD Line is below MACD Signal Line (Bearish) but RSI > 55 (Bullish). MACD Histogram bars are rising, which suggests that momentum could be nearing another upswing.
Support and Resistance : Nearest Support Zone is $200 (previous resistance), then $140 – $150. The nearest Resistance Zone is $250, then $330.
Rocket on Bitcoin CashHi guys, let's review the current situation on Bitcoin Cash.
Bitcoin Cash broke 200-220 resistance area and now aiming to 265-290 resistance area. BCH is looking much stronger than Bitcoin and if BTC is going to reach 28k than Bitcoin Cash most likely will be trading within 265-290 resistance area. At this point I don't see BCH plunging deeper than 220 price level. Most likely this level will be support from which it will jump to 265 price.
If this post is useful to you, you can support me with like/boost and leave comments below.
Many thanks.

Identifying Key Support: Analyzing BCH at 212.17 and Potential In the chart, I've highlighted a level with two touches at 212.17. Today, while reviewing the charts, I noticed that there aren't currently many compelling levels. Among the more evident ones, I've singled out this particular level. I'm looking to enter a short position if there's a breakdown below 212.18 for BCH upon approach. The approach to the level is crucial—it should ideally be gradual, and it's preferable to see some trading activity around that level before considering a trade.
