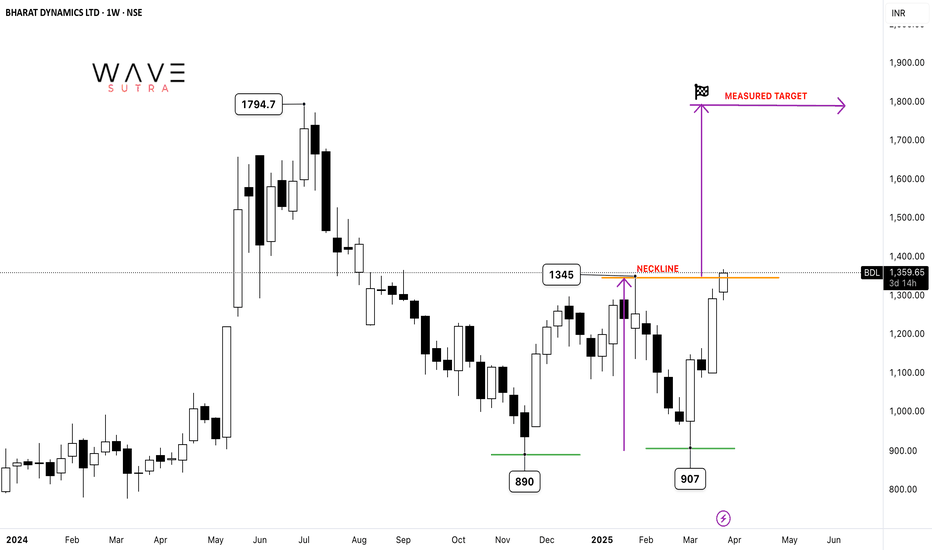
BDL: DOUBLE BOTTOM BREAKOUTThe Double Bottom pattern is a bullish reversal chart pattern that signals the potential end of a downtrend and the beginning of an uptrend. It consists of two consecutive troughs (lows) at roughly the same level, separated by a peak. The pattern resembles the letter "W."
Key Features:
Two Lows: Nearly equal in price, indicating strong support.
Neckline: The peak between the two lows acts as a resistance level.
Breakout: A bullish signal is confirmed when the price breaks above the neckline with strong volume.
Price Target: The expected upward movement is typically equal to the distance between the lows and the neckline.
Double Bottom pattern in Bharat Dynamics Ltd. (BDL) is confirmed, with both lows near ₹888 and a breakout above the ₹1,345 neckline, the price projection suggests a potential upside. The expected price target can be estimated by measuring the distance between the neckline and the lows, which is ₹1,345 - ₹888 = ₹457. Adding this to the breakout point, the projected price target would be ₹1,345 + ₹457 = ₹1,802. If the stock sustains above ₹1,345 with strong volume, it could gain further bullish momentum, potentially reaching ₹1,800 or higher in the medium term.
Bdlanalysis
BDL Short-Term Long Trade on 15m Time Frame: TP4 ReachedWe initiated a short-term long trade setup in Bharat Dynamics LTD (BDL) on the 8th of October at 9:45 am, entering at 1114.45 based on the bullish signal from the Risological Swing Trader. The price action was strong, and we successfully reached TP4 (1225.90) by the 11th of October at 9:15 am.
Target Points Achieved:
TP 1: 1135.70
TP 2: 1170.15
TP 3: 1204.60
TP 4: 1225.90
Stop Loss (SL): 1097.20
This trade exemplifies the power of the Risological Swing Trader in identifying profitable setups and executing with precision. We’ll continue leveraging this strategy for future market moves.
Potential Buying zone in BDLBDL is nearing it's support around 1100-1200.
One's missed the rally can add at these levels.
There's a strong supporting trend line. Could be the Next Best Opportunity to Invest or Swing.
Let the price become Bullish around support, then consider for Swing.
KEEP AN EYE OUT AND DON'T MISS THE OPPORTUNITY
Bharat Dynamics BDL Short Setup on 1D Daily TF on RisologialBharat Dynamics BDL Short Setup on 1D Daily TF on Risologial
After 125% upside rally, BDL has given signs of a possible SHORT trade.
The BDL price is crossing under the Risological trend line, and if we see a red candle today, it is a sign of a good short trade.
Once the trade is confirmed, the Risological swing trading indicator will set the Entry, stoploss and profit targets for this trade.
I will update on this trade post 3:30 closing.
Take care.
Namaste!


