#BEAM #BEAMX #BEAMXUSD #BEAMXUSDT #Analysis #Eddy#BEAM #BEAMX #BEAMXUSD #BEAMXUSDT #Analysis #Eddy
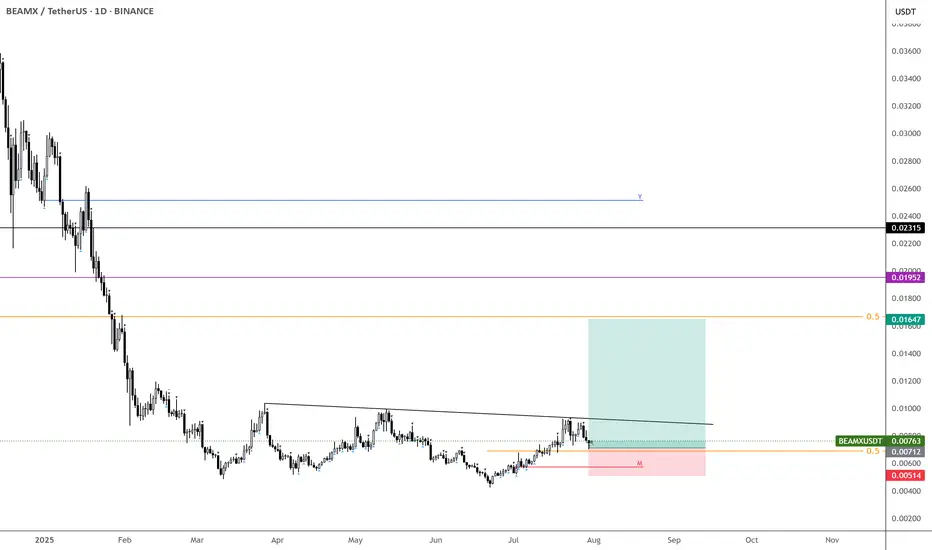
A reversal structure has formed on the weekly and daily time frames, and the necessary confirmations have been given on the weekly time frame. Considering the structure formed on the above time frame, as well as the behavior of this currency in the past chart, it is expected that this currency will perform a good pump.
I have identified the important supply and demand zones of the higher timeframe for you.
This analysis is based on a combination of different styles, including the volume style with the ict style.
Based on your strategy and style, get the necessary confirmations for this analysis to enter the trade.
Don't forget about risk and capital management.
The responsibility for the transaction is yours and I have no responsibility for your failure to comply with your risk and capital management.
💬 Note: The red order block cannot stop the growth of the price of this currency and by 0.04 cents this currency will be pumped more than 500%.
Be successful and profitable.
Beamx

$BEAMX – Waiting for the Pop
One of those coins that’s hard not to track—when it expands, it does so aggressively.
The META sector’s been slow this year and might stay that way, with utility coins taking the spotlight this quarter, so it's key to pick your winners wisely.
That said, NASDAQ:BEAM still has a solid shot at moving higher. Buying some here and ready to adjust if it breaks above the trendline.
Targeting just above a 2x for my first offload. BINANCE:BEAMXUSDT
BEAM FROM A NORMAL COIN TO A GOLDEN COIN SOON!! DUBBLE EFFECTThis is exactly what we expect, depending on the data that Beamx/USDT will show an interesting break since the new data.
when the real whale entering is started, we will see diffrance price movements ( not in a stable way as we see it now)
What is the expected target
up $0,001
There is an interesting update upcoming also that can give this coin an effect from a normal coin to a golden coin.
Every good increase and cycle movement takes time.
So let's see what time this expected update will take..

BEAMX NEW DAY TRADE VOLUMEBEAMX NEW DAY TRADE VOLUME
If the trend gets confirmation, we will follow this update with a live follow.

BEAMX Looks Bullish (8H)Two higher lows have been formed at the bottom of the chart, and the price has already created a bullish CH.
A trigger line has been formed, and it is expected to break after a few touches.
With the trading range maintained, the price is expected to move towards the targets, which are marked on the chart.
Closing a daily candle below the invalidation level will invalidate this analysis.
For risk management, please don't forget stop loss and capital management
When we reach the first target, save some profit and then change the stop to entry
Comment if you have any questions
Thank You

BEAMX: Breakout or Bounce? Key Levels to WatchYello, Paradisers! BEAMXUSDT is showing good signs after a healthy retracement while respecting a resistance trendline, signaling a potential buildup for the next move.
💎If BEAMXUSDT breaks out of the trendline with a proper candle close backed by strong volume, it will significantly increase the probability of a bullish continuation. A breakout with volume will confirm buyer strength and could lead to a strong upside momentum.
💎In the case of further retracement, the price may dip to take out inducement below the current levels. From there, a bounce is expected from the strong support zone, which aligns with a high-probability reversal area. For added confidence in a reversal, look for a bullish Internal Change of Character (I-CHOCH) or the formation of bullish patterns such as a W-pattern or an Inverse Head & Shoulders on lower timeframes.
💎However, if the price breaks down and closes a candle below the strong support zone, it will invalidate the bullish setup. In such a scenario, it’s wise to stay patient and wait for a more favorable and strategic price action structure to emerge before entering any trades. Always prioritize confirmation to avoid false setups and improve the quality of your trades.
Patience and strategy are key, Paradisers. Wait for clear setups to reduce risks and capture high-probability opportunities. Stay disciplined!
MyCryptoParadise
iFeel the success🌴

BEAMXUSDT 2DBEAMX ~ 2D Analysis
#BEAMX This is the lowest support for the moment. Maybe you can consider this support to start buying again.

BEAMX: Dormant Beast Ready to 5x From HereMight not get a retest of the 0.023 area, but the idea remains, and I’ll follow it in case the initial entry isn’t given.
I expect this to start trading above 10c by the end of Q2.
Be patient. BINANCE:BEAMXUSDT

BEAMX looks bullish (12H)It appears to be forming a triangle, with wave E of this triangle not yet complete.
If it reaches the green zone, we will look for buy/long positions.
The targets are marked on the chart.
A daily candle closing below the invalidation level will invalidate this analysis.
For risk management, please don't forget stop loss and capital management
When we reach the first target, save some profit and then change the stop to entry
Comment if you have any questions
Thank You

Can #BEAMX Bulls Finally Turn the Tide? Key Levels to Watch Yello, Paradisers! Can #BEAMX finally turn the tide around or not? Let's discuss the latest analysis of #BEAMX and see what's happening:
💎After 4-5 months of a slow grind downward, #BEAMX is now at a make-or-break moment. The price is testing the upper boundary of a Descending Broadening Wedge, thanks to a solid rebound from the major demand zone at $0.0139. But the pressing question is—can the bulls maintain this momentum and spark a genuine rally?
💎For a true breakout to occur, #BEAMXUSDT needs to surpass the critical resistance at $0.0211. This level has flipped from strong support—tested twice in the past—into a barrier that must now be overcome. If the bulls can clear this zone, backed by a spike in trading volume and the 20 EMA, it could be a signal that they're ready to seize control and drive prices higher. In this case, brace for a potential surge toward the next significant resistance.
💎If the bulls can’t sustain the rally, a pullback toward $0.0139 may be on the cards, potentially retesting the breakout point. Failing to hold this level could spell trouble, with #BEAMXUSDT likely slipping back to the $0.0112-$0.0122 support zone.
💎The real danger emerges if the $0.0112 support fails. Breaking below this level would likely hand control back to the bears and lead to a deeper correction dashing any hopes for a short-term bullish comeback.
Stay focused, patient, and disciplined, Paradisers🥂
MyCryptoParadise
iFeel the success🌴

#BEAMX/USDT#BEAMX
The price is moving in a descending channel on the 4-hour frame and is sticking to it well
We have a bounce from the lower limit of the descending channel and we are now touching this support at the price of 1730
We have an upward trend on the RSI indicator that is about to be broken, which supports the rise
We have a trend to stabilize above the moving average 100
Entry price 0.01795
First target 0.02015
Second target 0.02176
Third target 0.02375

BEAMX/USDT: READY FOR A 200% MOVE TO THE UPSIDE!!Hey everyone!
If you're enjoying this analysis, a thumbs up and follow would be greatly appreciated!
BEAMX looks good here. It breaks out from the falling wedge-like structure and looks ready for a 200% move to the upside. Buy some now and add more in the dip.
Entry:- CMP and add more up to $0.017
Target:- 150-200%
SL:- $0.0152
What are your thoughts on BEAMX's current price action? Do you see a bullish pattern? Share your analysis in the comments below!

#BEAMX: 200% Potential Gain Ahead!Hello everyone, I’m Cryptorphic.
I’ve been sharing insightful charts and analysis for the past seven years.
Follow me for:
~ Unbiased analyses on trending altcoins.
~ Identifying altcoins with 10x-50x potential.
~ Futures trade setups.
~ Daily updates on Bitcoin and Ethereum.
~ High time frame (HTF) market bottom and top calls.
~ Short-term market movements.
~ Charts supported by critical fundamentals.
Now, let’s dive into this chart analysis:
BEAMX has recently broken above the resistance trendline and is hovering near our accumulation range between $0.01399 and $0.01698. A retest is likely after a clean breakout above the 50 EMA, which could present a buying opportunity within the accumulation range.
The dotted horizontal lines represent the resistance levels that BEAMX will test as the price rises.
Key levels:
- Confirmation: Breakout above 50EMA & Resistance trendline.
- Accumulation Range: $0.01399-$0.01698.
- Lower Support: $0.01093.
- Primary Resistance: $0.01964.
- Targets: $0.01964, $0.02355, $0.03067, $0.04350.
DYOR, NFA.
Please hit the like button to support my content and share your thoughts in the comment section. Feel free to request any chart analysis you’d like to see!
Thank you!
#PEACE

BEAM is showing potentialNASDAQ:BEAM is showing strong potential.
After a period of downtrend, it has now entered a phase of sideways price action, which is likely to form a base at this level.
I have already bought in, and I believe NASDAQ:BEAM could be a game-changing coin for the gaming narrative!

BeamX chartThis is a chart using a method inspired by Da Vinci.
The circles are price targets and also these act like support and resistance trying to contain the price inside until it breaks out on the up side or down side. Also the diagonal lines are trend lines and they act the same.
This is not financial advice.
I can teach the method for those who see the benefit of it.

Beamx chartBeamx chart Price is contained in the yellow sideways cell, that acts as a chop zone. Once the price leaves that area and breaks the blue level it has a chance of going bull to T1. If the price breaks under the yellow cell, the higher chances are that the price will go to T1 bear.
This is done using an experimental method that I developed based on Da Vinci.
This is not financial advice.

BEAMX buy/long setupAfter the heavy drop, it has now broken the trigger line and created a bullish iCH.
There is a support area close below the price, on which we will look for buy/long positions if the price reaches this range.
The targets are clear on the chart.
Closing a daily candle below the invalidation level will cause analysis.
Note that the financial market is risky, so:
Do not enter any position without confirmation and trigger.
Do not enter a position without setting a stop.
Do not enter a position without capital management.
When we reach the first TP, save some profit and try to move the stop continuously in the direction of your profit.
If you have any comments please post them, comments will help us improve our performance
Thanks

Beamx can do 2x from hereBeamx coin is very best coin to buy now in spot which can go 2x easily from here.

BEAMX crypto should target 0.0564Daily chart, the BEAMX crypto is drawing a rising trend-line, with high probability to cross the R1 line.
After crossing the resistance R1 line, the target will be hitting the next resistance line R2 at around 0.0564
Be careful with the profit protection level and stop loss!
There is relatively high volatility.

BEAMX is beaming downwards #BEAMX/USDT #Analysis
Description
---------------------------------------------------------------
+ BEAMX has formed a well-defined rising wedge pattern, which typically indicates a bearish trend in the chart.
+ Should the price breach the support line, we anticipate a sustained decline in price.
+ I plan to initiate a short trade as soon as the price breaches the support line, while maintaining a moderate stop loss.
---------------------------------------------------------------
VectorAlgo Trade Details
------------------------------
Entry Price: 0.032179
Stop Loss: 0.03804
------------------------------
Target 1: 0.03043
Target 2: 0.02921
Target 3: 0.02687
Target 4: 0.02443
------------------------------
Timeframe: 4H
Capital: 1-2% of trading capital
Leverage: 5-20x
---------------------------------------------------------------
Enhance, Trade, Grow
---------------------------------------------------------------
Feel free to share your thoughts and insights.
Don't forget to like and follow us for more trading ideas and discussions.
Best Regards,
VectorAlgo

BEAMX DAY TRADE POSSIBLITY 10%Thanks for reading this update.
BEAMX seems to have a possibility increase of 10% in the coming time frame.

BEAMXUSDT Triangle BreakoutBEAMXUSDT Technical analysis update
BEAMX price has broken through its triangle pattern on the day chart. This could indicate a potential bullish move.
Buy zone : Below $0.022
Stop loss : $0.019
Take Profit 1: $0.0245
Take Profit 2: $0.028
Take Profit 3: $0.035
Regards
Hexa

BEAMX ANALYSIS (4H)On the chart, from where we entered "START", we seem to see a correction.
This correction seems to be a diametric.
There was a suitable place for the termination of the F wave on the chart, which we marked with red color.
If the price reaches this range, you can enter a sell/short position.
For risk management, please don't forget stop loss and capital management
Comment if you have any questions
Thank You
