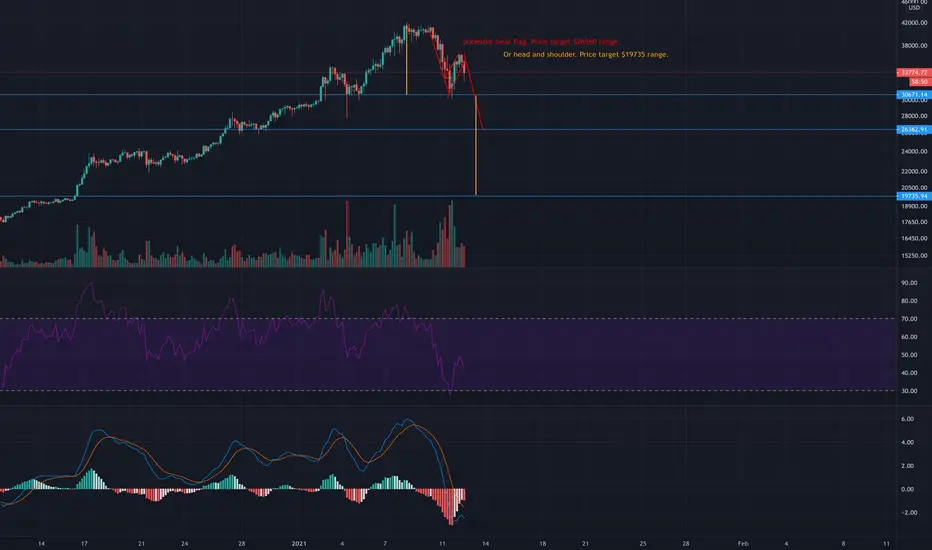
Potential bear flag or head and shoulders reversal pattern BTCOn 4 hour time frame of BTCUSD looks like to me either bear flag or head and shoulders. Waiting for impulsive selling to confirm the pattern.
Bearflags
USDCNH on a bear flag 🦐USDCNH after testing the lows near a dynamic trendline retraced inside a minor ascending channel.
The market reached the 0.786 Fibonacci retracements and now testing a support
According to Plancton's strategy, if the conditions, will be satisfied, we will set a nice short position.
--––
Follow the Shrimp 🦐
Keep in mind.
🟣 Purple structure -> Monthly structure.
🔴 Red structure -> Weekly structure.
🔵 Blue structure -> Daily structure.
🟡 Yellow structure -> 4h structure.
⚫️ Black structure -> <4h structure.
Here is the Plancton0618 technical analysis , please comment below if you have any question.
The ENTRY in the market will be taken only if the condition of the Plancton0618 strategy will trigger.

#ETHUSDT 4H - Ethereum - Bear Flag. Short#ETHUSDT - Ethereum - Bear Flag.
- Short: 649$-653$, stop loss: 655$
- Take Profit: 582$
- Risk : Reward = 1:7

Bullish Pennant or an Ascending Triangle for Bitcoin?It appears as though the consolidation at ATH's is forming a Bullish Pennant, or, potentially an Ascending Triangle.
I am leaning towards an Ascending Triangle because the horizontal blue resistance has rejected BTC numerous times during this consolidation period, but the price keeps testing that resistance, and the more a trend-line is tested the more likely the price is going to break in that direction, whether that's to the upside or downside, it works both ways from my experience!
We could be seeing a rather large bear flag after a blow-off top, the RSI is trading in a multi-month descending triangle displaying lower high after lower high, meanwhile, the price has increased with several deviations on the RSI regarding lower highs.
KST is showing a bullish cross where I have the blue finger, you will need to zoom in for better visualization.

NUMI Daily 26 EMA Re-test; Potential Hourly Bear FlagMy alert for NUMI's daily 12 EMA went off 12/21/2020 and have a tiny entry there. Wanted to add more to the 26 EMA (left) but missed it and it's seeing a solid 10-12% bounce from that. Hourly chart (right) looks like it could be setting up an hourly bear flag which has me cautious here. My position is very tiny; if doing swing trades on penny stocks I think it's key to size appropriately, relative to a day-trade position.

USDCAD 1.273834 + 0.33% SHORT IDEA * PRICE ACTION & CONTINUATIONHey everyone
Here's a look at the DOLLAR / CAD from the 4H chart, hope you guys are good and having a good one, the pair has been trading inside a bear flag / descending channel possibly signalling continuation with the bears, we saw a break above of this structure but seems it was a false breakout as we see structure hold and looking for continuation with the bears targeting both my FIB EXT'S.
many stars must align with the plan before executing the trade, kindly follow your rules.
LET'S SEE HOW IT GOES..
HAPPY TRADING EVERYONE & LET YOUR WINS RUN...
_________________________________________________________________________________________________________________________
ENTRY & SL - FOLLOW YOUR RULES
RISK-MANAGEMENT
PERIOD - SWING TRADE
__________________________________________________________________________________________________________________________
If this idea helps with your trading plan kindly leave a like definitely appreciate it.
HAVE A GOOD ONE!

The dollar is very bearish and continues to sell offWe are seeing other currencies, and cryptocurrency especially rise against the dollar, but when looking at the USD outright we see a very bearish picture. I would imagine targeting that $89 point as we see nice confluence with other indicators as outlined in the chart.

NZD/CAD SHORT - BEAR FLAGJust got triggered into NZD/CAD short. Very clear structure on the HTF's and this LTF flag showed its signal that its complete. Expecting to break this bear flag and reach the lower trend line. Theres potential for a large swing trade. Swing target is at the beginning of the HTF ascending structure.

ZM Bear Flagging Or Ranging?Orange lines indicate support and resistance as defined by accumulation and distribution zones. A break of the bottom orange line will indicate bear flagging.


USDCNH on a bear flag 🦐USDCNH after the break below the daily structure tested the 6.55000 area.
The price after a false breakout retested the resistance area inside a minor channel.
IF the market will break and close below the support structure we can set a nice short order according to Plancton's strategy.
--––
Follow the Shrimp 🦐
Keep in mind.
🟣 Purple structure -> Monthly structure.
🔴 Red structure -> Weekly structure.
🔵 Blue structure -> Daily structure.
🟡 Yellow structure -> 4h structure.
⚫️ Black structure -> <4h structure.
Here is the Plancton0618 technical analysis , please comment below if you have any question.
The ENTRY in the market will be taken only if the condition of the Plancton0618 strategy will trigger.
Leave a comment that is helpful or encouraging. Let's master the markets together

is Litecoin (LTC) doing a Bump and Run Reversal? or a Bear flag?It seems that Litecoin ( LTC ) is currently on the Run phase of a bump and Run Reversal, and at the same time, it seems that it is also making a bear flag.
If this is true, it might send bitcoin towards $40-$47 area (see red box)
What you guys think?
Leave a comment and a like!
Only for entertainment purposes!

ES1! 1D BEAR FLAG SHORT TRADEBear Flags are a Range Chart Pattern.
Ranges are repeatable trading chart patterns.
Triangles and ranges are consolidation chart patterns that can breakout either direction.
Ascending Bear Flags chart patterns will have a directional bias (Shortn Trade) depending on the previous incoming trend.
Each chart pattern will have defining trendlines of the support/resistance levels creating the pattern.
What ever time frame you are trading this chart pattern, wait for a candle close outside of the trendline in the direction of the breakout candle. (Our time frame preference is the Daily chart).
Add volume indicator - Volume is the amount of $ that went into a particular candle or in Forex the # of trades that took place.
Add ATR indicator - Volatility is the amount of price movement that occurred. Use the ATR to measure the price movement.
When you see descending Volume bars and descending ATR line (which indicates volatility) this shows
a dis-interest in traders to invest in this pair creating consolidation which creates the chart pattern.
Trade Management after there is a breakout candle close.
1 - Position size (compare volume bar to volume ma line).
a - Breakout candle must be 100% of volume average for a full position size.
b - If 75% of volume average then ½ position size. (To find 75% of Volume
look at the charts volume settings – divide smaller # into larger # = 75%+)
If not 75% then stand aside from the trade.
2 – If candle breaks out of a trendline, 15m before the close of the day prepare your buy/sell order.
Enter two trades. 1st trade will have a SL & TP. It will close automatically when the 1st TP is hit. 2nd
trade only has a SL and will be allowed to run. When 1st TP is hit move the SL to breakeven. Look
at ATR and prepare SL at 1.5 of ATR. Prepare 1st trade TP at 1 of ATR.
3 - SL for both trades will be 1.5 x ATR.
4 - 1st trade TP will be 1 x ATR.
5 - No TP on 2nd trade – letting profit run and adjusting SL to follow price.
6 - When 1st TP hit – move 2nd trade SL to breakeven.
7 - Adjust the 2nd trade SL to follow price.
*8 – After Breakout candle – if price closes back into chart pattern close trade don't wait for SL to be hit.
*9 - When breakout candle is more than 1 ATR from breakout candle open.
a - Enter 1st trade at candle close with ½ position size.
b - Enter 2nd trade with a pending limit order that is 1 ATR of breakout candle open.
c – Price should pullback to that pending limit order for 2nd trade.
d – If Price returns back into chart pattern close trade before SL is hit.

EURJPY on a minor retracement move 🦐EURJPPY after breaking below the daily structure hit the ascending trendline and retest the resistance area at the 0.5 fib level.
The price on the 4h chart is moving inside a minor ascending channel.
IF the price will break and close below we will set a nice short according to Plancton's strategy.
–––––
Follow the Shrimp 🦐
Keep in mind.
• 🟣 Purple structure -> Monthly structure.
• 🔴 Red structure -> Weekly structure.
• 🔵 Blue structure -> Daily structure.
• 🟡 Yellow structure -> 4h structure.
• ⚫️ Black structure -> >4h structure.
Here is the Plancton0618 technical analysis , please comment below if you have any question.
The ENTRY in the market will be taken only if the condition of the Plancton0618 strategy will trigger.

S&P Analysis Week of 11/1/2020: Election 2020This is the week of the presidential elections in the United States. How will the election madness impact the stock market?
If you want to know exactly what happens during this week, you came to the wrong place. Sorry.
What I do know is that there is the potential for two very profitable trade setups. Similar to last week, I believe price is consolidating to make a break away move in either the northern or southern direction (highlighted in the No Man's Land pink box). Isn't that convenient that price has pegged itself into an area where the technical pattern allows for either breakout direction. There are no coincidences in the stock market.
I'm neutral as to the direction the market goes, however, it is worth pointing out that price seems to have started to form a bearish flag last week. Not always, but these typically break down in the southern direction. I believe the market is going to do what it does regardless of who wins the election.
I think the setups I've labeled on the chart are self explanatory. Just remember DO NOT PLAY THE BREAKOUTS. Always wait for price to come back to test the breakout/breakdown area and resume off. This is just a general good trading principle. Also, don't play in No Man's Land.
If my charts seem overly simple, that's because they are. Trading is complex so I try to make it look really easy. I focus on major support/resistance lines that provide entries into the direction of the trend. This has served me well and made trading a lot simpler and my previous posts have been spot on week after week using this method.
Remember:
"When it feels really right, it's probably wrong. When it feels really wrong, it's probably right."
Good luck trading. Don't forget to support me by hitting the like button.

Bear flags are forming on SPYI think the price may be forming a big bear flag here. Just added commentary on the last analysis.

EURUSD on a bear flag? 🦐EURUSD on the daily chart is testing now the lower part of the minor ascending channel.
The price after hitting the upper part at 1.18750 broke the daily support at 1.171750 and now looks for the 1.17250 area.
IF the market will break and close below the weekly support we will set a nice short order according to Pkancton's strategy.
–––––
Follow the Shrimp 🦐
Keep in mind.
🟣 Purple structure -> Monthly structure.
🔴 Red structure -> Weekly structure.
🔵 Blue structure -> Daily structure.
🟡 Yellow structure -> 4h structure.
⚫️ Black structure -> >4h structure.
Here is the Plancton0618 technical analysis , please comment below if you have any question.
The ENTRY in the market will be taken only if the condition of the Plancton0618 strategy will trigger.

SILVER on a bearv flag? 🦐SILVER on the daily chart after breaking below the support area at 26 area created a bear flag.
The price went almost for a retest of the structure and now could break below.
IF the price will break and close below the 24.250 area we will set a nice short order according to PLancton's strategy.
–––––
Follow the Shrimp 🦐
Keep in mind.
• 🟣 Purple structure -> Monthly structure.
• 🔴 Red structure -> Weekly structure.
• 🔵 Blue structure -> Daily structure.
• 🟡 Yellow structure -> 4h structure.
• ⚫️ Black structure -> >4h structure.
Here is the Plancton0618 technical analysis , please comment below if you have any question.
The ENTRY in the market will be taken only if the condition of the Plancton0618 strategy will trigger.

GOLD double top & bearish flagGold formed double top @ 1930 level, and shown good reaction in yesterdays market.
Double top is a reliable pattern. Expecting drop towards 1890, 1870, 1855 levels.
US elections will move markets strongly. Manage your risk.

EURJPY - Trade Opportunity! We are mostly into range areas on most currencies.
Technical View: I have been bearish EURJPY for while.
Pattern: Bear Flag
Target: 200 EMA - It's a key area of support as well.
If we were to go below the 200 EMA - 120 areas come into play. (Fib Retracement target area of: 1.618).
However, if we rise above I'd be looking towards the areas of 125.050 and see how it reacts at those levels. Keep in mind on the lower time frames patterns, Fib Retracement or perhaps other indicators that you have within your trade plan for further confirmation.
Key note: Bears are in control as long as we don't pass the trendline down towards the upside & USD/JPY has a nice formation building...
Remember: Just a trade idea, not a recommendation
Have a great week ahead.
All the best,
Trade Journal (TJ)

NZDUSD - Tight SqueezePrice is traveling within an ascending channel, I would only be looking for buys from here because selling from here is very limited and we have areas where price can reverse such as the trendline and order block.
Let's extend this 'bear flag' for as long as we can hahahah.
COT Data - 54% Short

LKE BEAR FLAG or BREAK & TESTLake Resources NL (ASX:LKE; OTC:LLKKF) is a clean lithium developer utilising clean, direct extraction technology for the development of sustainable, high purity lithium from its flagship Kachi Project, as well as three other lithium brine projects in Argentina. The projects cover 200 sq km in a prime location within the Lithium Triangle, where 40% of the world’s lithium is produced at the lowest cost.
Recently spotlight was shon upon LKE with the speculation that NVX was going to supply Tesla with the technology required to create the "Million Mile Battery" LKE provides NVX with Clean Battery Grade Lithium to create the NMC622 LIB (lithium Ion Battery) test cells.
You can clearly see in the Chart that hype was real and then when it was proven Pure Speculation the market reaction. I wanted to let the dust settle before charting LKE next potential move. Below are 2 possibilities.
SHORT- Bear Flag & Gap Fill
Technicals:
- Bear Flag Pattern almost complete
- Stochastic almost overbought
- 20MA will be lost if we cross Uptrend Trendline
- Struggling to make a Higher High
- Bear Flag Target 1 marrying Previous Support
- Gap Open at 0.041-0.043
- Bear Flag Target 2 at previous lows
LONG - New ATH
Technicals:
- Break and Retest off Strong Support
- Stochastic has not turned
- Current Bullish Market Structure
- Ichimoku still Bullish
- RSI still trending above the 50 and not Overbought
- MAs currently still Bullish and price still currently above the 20MA
Interested to see what's next for the Clean Tech Lithium Producer
Personal Sentiment: Hold, Disclosure: Held
"DISCLAIMER: NO ADVICE. The information presented here is general in nature and is for education purposes only. Nothing should be considered to be advice. You should consult with an appropriate professional for specific advice tailored to your situation."
