Walmart Head & Shoulders on Daily and Weekly chartWalmart (WMT) may be forming, or already has formed, a bearish Head & Shoulders pattern.
#WMT #Walmart #bearish #short #headandshoulders #retail #discountstore
Bearish Patterns

GBP/CHF BEST PLACE TO SELL FROM|SHORT
GBP/CHF SIGNAL
Trade Direction: short
Entry Level: 1.115
Target Level: 1.081
Stop Loss: 1.138
RISK PROFILE
Risk level: medium
Suggested risk: 1%
Timeframe: 1D
Disclosure: I am part of Trade Nation's Influencer program and receive a monthly fee for using their TradingView charts in my analysis.
✅LIKE AND COMMENT MY IDEAS✅

EUR/CHF BEARS ARE STRONG HERE|SHORT
Hello, Friends!
EUR-CHF uptrend evident from the last 1W green candle makes short trades more risky, but the current set-up targeting 0.927 area still presents a good opportunity for us to sell the pair because the resistance line is nearby and the BB upper band is close which indicates the overbought state of the EUR/CHF pair.
Disclosure: I am part of Trade Nation's Influencer program and receive a monthly fee for using their TradingView charts in my analysis.
✅LIKE AND COMMENT MY IDEAS✅

EUR/AUD SHORT FROM RESISTANCE
Hello, Friends!
EUR/AUD pair is in the uptrend because previous week’s candle is green, while the price is clearly rising on the 8H timeframe. And after the retest of the resistance line above I believe we will see a move down towards the target below at 1.723 because the pair overbought due to its proximity to the upper BB band and a bearish correction is likely.
Disclosure: I am part of Trade Nation's Influencer program and receive a monthly fee for using their TradingView charts in my analysis.
✅LIKE AND COMMENT MY IDEAS✅

EUR/CAD SHORT FROM RESISTANCE
Hello, Friends!
EUR/CAD pair is trading in a local uptrend which we know by looking at the previous 1W candle which is green. On the 8H timeframe the pair is going up too. The pair is overbought because the price is close to the upper band of the BB indicator. So we are looking to sell the pair with the upper BB line acting as resistance. The next target is 1.569 area.
Disclosure: I am part of Trade Nation's Influencer program and receive a monthly fee for using their TradingView charts in my analysis.
✅LIKE AND COMMENT MY IDEAS✅

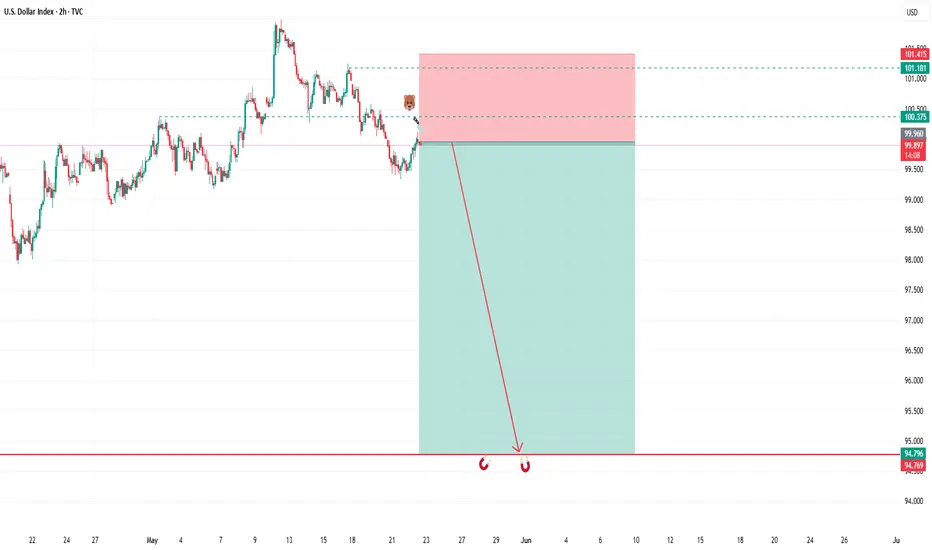
SELL THE US DOLLARThis is a continuation of our previous analysis on DXY. As we had mentioned USD DOLLAR will drop all the way to 94.800 before we consider any bullish market movement. In the next session we will be monitoring DXY for selling positions (this means buying EURUSD, GBPUSD and GOLD). Keep your risk manageable and use proper risk management. Cheers to you all.
$GOOGL the pattern is there, target $152, short setup.NASDAQ:GOOGL You tell me. This looks so ready to go back below $150. My target is $152. I am entering puts right now with a strike price of $150 for 6/20 starting at $1.33 entry. I will add some on a push towards $167-$168. I will give up if it pushes through or holds at $170. This just looks to good TECHNICALLY in my opinion. I will keep you updated. I am willing to watch this position go down 65% where I will consider selling; looking at price and time to expiration. We are not out of the weeds yet when it comes to political rhetoric regarding tariffs even though this name shouldn't be affected by such because it is software, nothing physical but when the idea of tariffs are spewed the market as a whole reacts in negatively.
WSL.

EURUSD - The Bears Are Getting Started!Hello TradingView Family / Fellow Traders. This is Richard, also known as theSignalyst.
📈EURUSD has been bullish trading within the rising blue channel.
However, it is currently retesting the upper bound of both red and blue channels.
🏹 The highlighted red circle is a strong area to look for sell setups as it is the intersection of the upper trendlines and orange resistance zone.
📚 As per my trading style:
As #EURUSD is around the red circle zone, I will be looking for bearish reversal setups (like a double top pattern, trendline break , and so on...)
📚 Always follow your trading plan regarding entry, risk management, and trade management.
Good luck!
All Strategies Are Good; If Managed Properly!
~Rich
Disclosure: I am part of Trade Nation's Influencer program and receive a monthly fee for using their TradingView charts in my analysis.

EUR/CAD SENDS CLEAR BEARISH SIGNALS|SHORT
EUR/CAD SIGNAL
Trade Direction: short
Entry Level: 1.567
Target Level: 1.549
Stop Loss: 1.579
RISK PROFILE
Risk level: medium
Suggested risk: 1%
Timeframe: 12h
Disclosure: I am part of Trade Nation's Influencer program and receive a monthly fee for using their TradingView charts in my analysis.
✅LIKE AND COMMENT MY IDEAS✅

GOLD BEST PLACE TO SELL FROM|SHORT
GOLD SIGNAL
Trade Direction: short
Entry Level: 3,458.82
Target Level: 3,187.96
Stop Loss: 3,639.42
RISK PROFILE
Risk level: medium
Suggested risk: 1%
Timeframe: 4h
Disclosure: I am part of Trade Nation's Influencer program and receive a monthly fee for using their TradingView charts in my analysis.
✅LIKE AND COMMENT MY IDEAS✅

GBPJPY - Important BreakdownHello Traders !
The GBPJPY failed to create a new higher high.
The price broke the support line!
So, I expect a bearish move📉
________________
TARGET: 190.680🎯

UJ Could Tumble Back To 140 If Bears Take Expanding RangeToday FX:USDJPY Sellers make a Breakout of the Rising Support of the Expanding Range it's been trading in since the Low that started the range back on April 22nd.
An Expanding Range is typically considered a Continuation Pattern suggesting that if Sellers can hold price under the Rising Support, we can suspect JPY to overcome USD in this pair pulling price down continuing the Downtrend it was in prior to entering the pattern.
Once the Breakout of Consolidation is Validated, a Breakout & Retest of the Rising Support could deliver potential Short Opportunities to take price down to the Low of the Range.
Fundamentally, there is a lot of worry about the fall out of Tariff Talks with important trade partners with the 90-Day grace period soon coming to an end, weakening labor market potentially signaling "Stagflation" and additionally, it is suspected that Trump's Tax Cut Bill could add $3 - $5 Trillion to the $36.2 Trillion debt the US is already suffering from, further harming the Dollar.
-https://www.tradingview.com/news/reuters.com,2025:newsml_L1N3RT018:0-dollar-on-defensive-as-traders-eye-trump-tax-bill-g7-currency-talks/
-https://www.tradingview.com/news/te_news:459470:0-dollar-extends-losses/

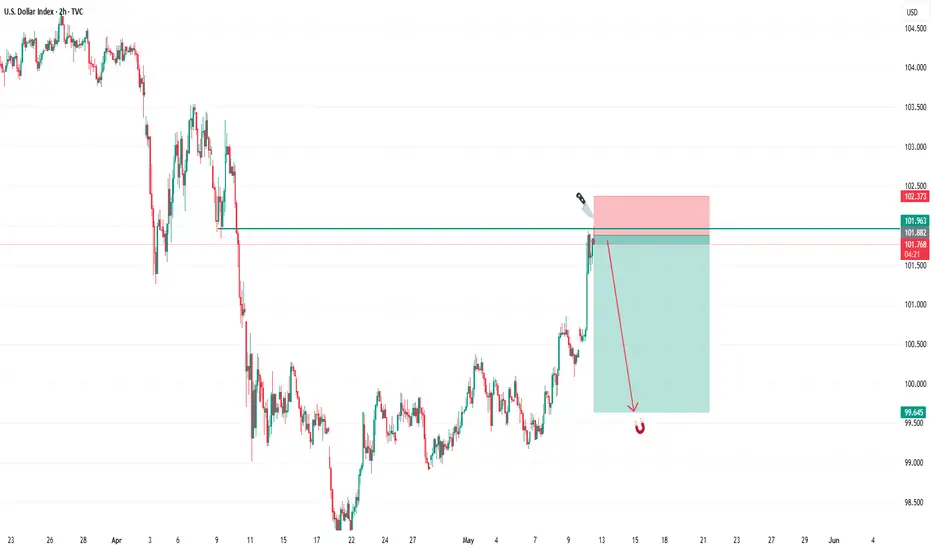
SELL USDIn todays session we are monitoring DXY for sells. After big move up we expect trend to continue. Our entry is at 101.82 and stops above 102.373. Targets are below 99.600 and lower to 95.00 . USD pairs will be dropping. Use proper risk management. Cheers to you all.
BITCOIN BEARISH BIAS RIGHT NOW| SHORT
BITCOIN SIGNAL
Trade Direction: short
Entry Level: 106,664.53
Target Level: 100,986.05
Stop Loss: 110,439.78
RISK PROFILE
Risk level: medium
Suggested risk: 1%
Timeframe: 4h
Disclosure: I am part of Trade Nation's Influencer program and receive a monthly fee for using their TradingView charts in my analysis.
✅LIKE AND COMMENT MY IDEAS✅

EUR/USD BEARS ARE STRONG HERE|SHORT
Hello, Friends!
EUR/USD is making a bullish rebound on the 12H TF and is nearing the resistance line above while we are generally bearish biased on the pair due to our previous 1W candle analysis, thus making a trend-following short a good option for us with the target being the 1.105 level.
Disclosure: I am part of Trade Nation's Influencer program and receive a monthly fee for using their TradingView charts in my analysis.
✅LIKE AND COMMENT MY IDEAS✅

NG1! BEARS ARE STRONG HERE|SHORT
NG1! SIGNAL
Trade Direction: short
Entry Level: 3.790
Target Level: 3.302
Stop Loss: 4.116
RISK PROFILE
Risk level: medium
Suggested risk: 1%
Timeframe: 1D
Disclosure: I am part of Trade Nation's Influencer program and receive a monthly fee for using their TradingView charts in my analysis.
✅LIKE AND COMMENT MY IDEAS✅

NATGAS - NEW BREAKDOWN !Hello Traders !
The Naturalgas price failed to create a new higher high!
The higher low is broken (change of character).
So, I expect a bearish move📉
_____________
TARGET: 3.0950🎯

USDJPY - Long Done, Soon Short!Hello TradingView Family / Fellow Traders. This is Richard, also known as theSignalyst.
📈As per our last USDJPY analysis, it rejected the orange support zone and has been trading higher.
What's next? As USDJPY approaches the upper blue trendline, we will be looking for shorts.
🏹 The highlighted red circle is a strong area to look for sell setups as it is the intersection of the upper blue trendline and green supply zone.
📚 As per my trading style:
As #USDJPY retests the red circle zone, I will be looking for bearish reversal setups (like a double top pattern, trendline break , and so on...)
Meanwhile, USDJPY would remain bullish medium-term and a bullish continuation towards the red circle is expected.
📚 Always follow your trading plan regarding entry, risk management, and trade management.
Good luck!
All Strategies Are Good; If Managed Properly!
~Rich
Disclosure: I am part of Trade Nation's Influencer program and receive a monthly fee for using their TradingView charts in my analysis.

SILVER BEARS WILL DOMINATE THE MARKET|SHORT
SILVER SIGNAL
Trade Direction: short
Entry Level: 3,240.9
Target Level: 3,210.7
Stop Loss: 3,261.1
RISK PROFILE
Risk level: medium
Suggested risk: 1%
Timeframe: 1h
Disclosure: I am part of Trade Nation's Influencer program and receive a monthly fee for using their TradingView charts in my analysis.
✅LIKE AND COMMENT MY IDEAS✅

AUD/NZD SENDS CLEAR BEARISH SIGNALS|SHORT
AUD/NZD SIGNAL
Trade Direction: short
Entry Level: 1.084
Target Level: 1.062
Stop Loss: 1.098
RISK PROFILE
Risk level: medium
Suggested risk: 1%
Timeframe: 1D
Disclosure: I am part of Trade Nation's Influencer program and receive a monthly fee for using their TradingView charts in my analysis.
✅LIKE AND COMMENT MY IDEAS✅

CAD/CHF BEARS ARE GAINING STRENGTH|SHORT
Hello, Friends!
Bearish trend on CAD/CHF, defined by the red colour of the last week candle combined with the fact the pair is overbought based on the BB upper band proximity, makes me expect a bearish rebound from the resistance line above and a retest of the local target below at 0.583.
Disclosure: I am part of Trade Nation's Influencer program and receive a monthly fee for using their TradingView charts in my analysis.
✅LIKE AND COMMENT MY IDEAS✅

CHF/JPY SELLERS WILL DOMINATE THE MARKET|SHORT
Hello, Friends!
CHF/JPY pair is in the downtrend because previous week’s candle is red, while the price is evidently rising on the 1H timeframe. And after the retest of the resistance line above I believe we will see a move down towards the target below at 173.464 because the pair is overbought due to its proximity to the upper BB band and a bearish correction is likely.
Disclosure: I am part of Trade Nation's Influencer program and receive a monthly fee for using their TradingView charts in my analysis.
✅LIKE AND COMMENT MY IDEAS✅

CHFJPY - BEARISH MOVEHello Traders !
On Tuesday 13 May, The CHFJPY reached a strong resistance level (176.482 - 176.010).
The price broke the higher low (change of character).
So, I expect a bearish move📉
________________
TARGET: 173.280🎯
