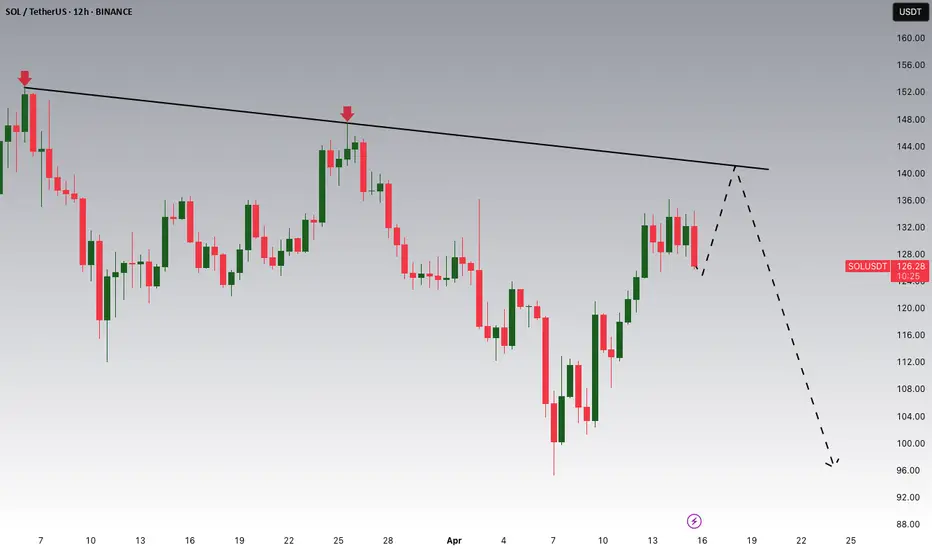
Solana Potential DownsidesHey Traders, in today's trading session we are monitoring Solana for a selling opportunity around 140 zone, SOLUSDT is trading in a downtrend and currently is in a correction phase in which it is approaching the trend at 140 support and resistance area.
Trade safe, Joe.
Bearish Patterns
EURGBP Potential downsidesHey Traders, in today's trading session we are monitoring EURGBP for a selling opportunity around 0.86000 zone, EURGBP is trading in a downtrend and currently is in a correction phase in which it is approaching the trend at 0.86000 support and resistance area.
Trade safe, Joe.

SILVER BEARISH BIAS RIGHT NOW| SHORT
SILVER SIGNAL
Trade Direction: short
Entry Level: 3,225.6
Target Level: 3,081.7
Stop Loss: 3,321.8
RISK PROFILE
Risk level: medium
Suggested risk: 1%
Timeframe: 6h
Disclosure: I am part of Trade Nation's Influencer program and receive a monthly fee for using their TradingView charts in my analysis.
✅LIKE AND COMMENT MY IDEAS✅

EURJPY TO BREAK 2022 LOWThe ascending channel is the first sign that indicates that price have a high chance to break 2022 low. After price impulsively broke the channel price formed a continuation of which I expect an impulsive break to the downside.

Gold Potential DownsidesHey Traders, in today's trading session we are monitoring XAUUSD for a selling opportunity around 3220 zone, Gold is trading in a downtrend and currently is in a correction phase in which it is approaching the trend at 3220 support and resistance area.
Trade safe, Joe.

Bitcoin Potential DownsidesHey traders, in today's trading session we are monitoring Bitcoin for a selling opportunity around 86k zone, BTCUSDT is trading in a downtrend and currently is in a correction phase in which it is approaching the trend at 86k support and resistance area.
Trade safe, Joe.

USDJPY Is Nearing An Important Resistance Under a Strong JPYHey Traders, in today's trading session we are monitoring USDJPY for a selling opportunity around 144.100 zone, USDJPY is trading in a downtrend and currently is in a correction phase in which it is approaching the trend at 144.100 resistance area.
Trade safe, Joe.

CHFJPY Is Trading Under a Strong Japanese Yen pressureHey Traders, in today's trading session we are monitoring CHFJPY for a selling opportunity around 174.800 zone, CHFJPY is trading in a downtrend and currently is in a correction phase in which it is approaching the trend at 174.800 support and resistance area.
Trade safe, Joe.

bnb sell midterm "🌟 Welcome to Golden Candle! 🌟
We're a team of 📈 passionate traders 📉 who love sharing our 🔍 technical analysis insights 🔎 with the TradingView community. 🌎
Our goal is to provide 💡 valuable perspectives 💡 on market trends and patterns, but 🚫 please note that our analyses are not intended as buy or sell recommendations. 🚫
Instead, they reflect our own 💭 personal attitudes and thoughts. 💭
Follow along and 📚 learn 📚 from our analyses! 📊💡"

GOLD BEARS WILL DOMINATE THE MARKET|SHORT
GOLD SIGNAL
Trade Direction: short
Entry Level: 3,224.05
Target Level: 3,072.86
Stop Loss: 3,325.09
RISK PROFILE
Risk level: medium
Suggested risk: 1%
Timeframe: 6h
Disclosure: I am part of Trade Nation's Influencer program and receive a monthly fee for using their TradingView charts in my analysis.
✅LIKE AND COMMENT MY IDEAS✅

AUD/USD BEARS ARE GAINING STRENGTH|SHORT
Hello, Friends!
We are going short on the AUD/USD with the target of 0.621 level, because the pair is overbought and will soon hit the resistance line above. We deduced the overbought condition from the price being near to the upper BB band. However, we should use low risk here because the 1W TF is green and gives us a counter-signal.
Disclosure: I am part of Trade Nation's Influencer program and receive a monthly fee for using their TradingView charts in my analysis.
✅LIKE AND COMMENT MY IDEAS✅

NZD/USD SELLERS WILL DOMINATE THE MARKET|SHORT
Hello, Friends!
We are now examining the NZD/USD pair and we can see that the pair is going up locally while also being in a uptrend on the 1W TF. But there is also a powerful signal from the BB upper band being nearby, indicating that the pair is overbought so we can go short from the resistance line above and a target at 0.576 level.
Disclosure: I am part of Trade Nation's Influencer program and receive a monthly fee for using their TradingView charts in my analysis.
✅LIKE AND COMMENT MY IDEAS✅

TAO RectangleBITGET:TAOUSDT has been trading in a well-defined rectangle for the last 16 months.
Key Levels
• $195 - Support, with demand zone extending to ~$260
• $470 - Midline, S/R band extending between $460-$490
• $745 - Resistance, with supply zone extending to $640
Despite a recent fakeout to the downside, TAO recovered support and might be headed for another move to the upside.
Targets
• $1300 in case of a sustained break above $745
• $50 in case of a sustained break below $195

USDCHF SELLS Price is overall bearish but it formed a minor support on H1. Ideally, I'd like to see price retrace to the broken support around 0.83600 area.

USDJPY SELLSPrice is currently in an AOI for sells. Price gapped up so I'd hold off on sells until price forms bearish structure on the lower timeframes. Once price resumes bearish structure, look for sells towards 140.500. If price breaks above H1 resistance, I'd look for price to push towards 145.

(AAL) American Airlines "Crashing"?! Long Put Worthy?American Airline (AAL) in recent years has had major news coverage due to various collisions and other events. The technicals appear to show some strong bearish momentum forming on the 1 Week chart. Will the airline company coming crashing down? Or is this currently a discounted buying opportunity? What are your thoughts?

1INCH Rectangle Downside BreakoutLast week, BINANCE:1INCHUSDT fully confirmed a downside breakout from a multi-year rectangle.
If $0.20 isn't reclaimed soon, there is a good chance that the token will head to the $0.06 rectangle target.
Worth watching it, as a failed retest of $0.20 could offer a very good short opportunity, while a sustained daily close above it would invalidate the setup and possibly lead to a retest of $0.45 or even $0.70.

GBP/USD BEST PLACE TO SELL FROM|SHORT
Hello, Friends!
The BB upper band is nearby so GBP/USD is in the overbought territory. Thus, despite the uptrend on the 1W timeframe I think that we will see a bearish reaction from the resistance line above and a move down towards the target at around 1.287.
Disclosure: I am part of Trade Nation's Influencer program and receive a monthly fee for using their TradingView charts in my analysis.
✅LIKE AND COMMENT MY IDEAS✅

BITCOIN BEARS ARE STRONG HERE|SHORT
BITCOIN SIGNAL
Trade Direction: short
Entry Level: 83,826.61
Target Level: 79,330.33
Stop Loss: 86,817.52
RISK PROFILE
Risk level: medium
Suggested risk: 1%
Timeframe: 3h
Disclosure: I am part of Trade Nation's Influencer program and receive a monthly fee for using their TradingView charts in my analysis.
✅LIKE AND COMMENT MY IDEAS✅

EUR/USD SHORT FROM RESISTANCE
Hello, Friends!
Previous week’s green candle means that for us the EUR/USD pair is in the uptrend. And the current movement leg was also up but the resistance line will be hit soon and upper BB band proximity will signal an overbought condition so we will go for a counter-trend short trade with the target being at 1.118.
Disclosure: I am part of Trade Nation's Influencer program and receive a monthly fee for using their TradingView charts in my analysis.
✅LIKE AND COMMENT MY IDEAS✅

BITCOIN Is Very Bearish! Short!
Here is our detailed technical review for BITCOIN.
Time Frame: 12h
Current Trend: Bearish
Sentiment: Overbought (based on 7-period RSI)
Forecast: Bearish
The market is trading around a solid horizontal structure 82,277.86.
The above observations make me that the market will inevitably achieve 75,083.32 level.
P.S
We determine oversold/overbought condition with RSI indicator.
When it drops below 30 - the market is considered to be oversold.
When it bounces above 70 - the market is considered to be overbought.
Disclosure: I am part of Trade Nation's Influencer program and receive a monthly fee for using their TradingView charts in my analysis.
Like and subscribe and comment my ideas if you enjoy them!

GOLD SENDS CLEAR BEARISH SIGNALS|SHORT
GOLD SIGNAL
Trade Direction: short
Entry Level: 3,222.46
Target Level: 3,072.99
Stop Loss: 3,322.30
RISK PROFILE
Risk level: medium
Suggested risk: 1%
Timeframe: 3h
Disclosure: I am part of Trade Nation's Influencer program and receive a monthly fee for using their TradingView charts in my analysis.
✅LIKE AND COMMENT MY IDEAS✅

CHF/JPY BEARISH BIAS RIGHT NOW| SHORT
Hello, Friends!
CHF/JPY pair is trading in a local uptrend which we know by looking at the previous 1W candle which is green. On the 2H timeframe the pair is going up too. The pair is overbought because the price is close to the upper band of the BB indicator. So we are looking to sell the pair with the upper BB line acting as resistance. The next target is 172.964 area.
Disclosure: I am part of Trade Nation's Influencer program and receive a monthly fee for using their TradingView charts in my analysis.
✅LIKE AND COMMENT MY IDEAS✅
