DOLLAR INDEX - Important BreakdownHello Traders !
Yesterday, The Dollar Index Broke the support level (103.200 - 103.700).
This key level becomes new resistance !
So, I expect a bearish move📉
________________
TARGET: 100.730🎯
Bearish Patterns

SELL EURUSDIn todays session we are monitoring EURUSD for a selling opportunity. Our entry is at current price 1.11248 further push up expected to 1.11779. Our stops are above 1.2222 and targets as low as 1.0936. Use proper risk management. Cheers to you all.

Ethereum Potential DownsidesHey Traders, in today's trading session we are monitoring ETHUSDT for a selling opportunity around 1800 zone, Ethereum is trading in a downtrend and currently is in a correction phase in which it is approaching the trend at 1800 support and resistance area.
Trade safe, Joe.

BITCOIN BEST PLACE TO SELL FROM|SHORT
BITCOIN SIGNAL
Trade Direction: short
Entry Level: 81,548.46
Target Level: 78,143.52
Stop Loss: 83,839.84
RISK PROFILE
Risk level: medium
Suggested risk: 1%
Timeframe: 3h
Disclosure: I am part of Trade Nation's Influencer program and receive a monthly fee for using their TradingView charts in my analysis.
✅LIKE AND COMMENT MY IDEAS✅

CAD/JPY BEARS ARE STRONG HERE|SHORT
CAD/JPY SIGNAL
Trade Direction: short
Entry Level: 103.925
Target Level: 100.915
Stop Loss: 105.911
RISK PROFILE
Risk level: medium
Suggested risk: 1%
Timeframe: 1D
Disclosure: I am part of Trade Nation's Influencer program and receive a monthly fee for using their TradingView charts in my analysis.
✅LIKE AND COMMENT MY IDEAS✅

AUD/JPY SHORT FROM RESISTANCE
Hello, Friends!
We are going short on the AUD/JPY with the target of 85.454 level, because the pair is overbought and will soon hit the resistance line above. We deduced the overbought condition from the price being near to the upper BB band. However, we should use low risk here because the 1W TF is green and gives us a counter-signal.
Disclosure: I am part of Trade Nation's Influencer program and receive a monthly fee for using their TradingView charts in my analysis.
✅LIKE AND COMMENT MY IDEAS✅

GBP/NZD BEARS ARE GAINING STRENGTH|SHORT
GBP/NZD SIGNAL
Trade Direction: short
Entry Level: 2.308
Target Level: 2.275
Stop Loss: 2.330
RISK PROFILE
Risk level: medium
Suggested risk: 1%
Timeframe: 6h
Disclosure: I am part of Trade Nation's Influencer program and receive a monthly fee for using their TradingView charts in my analysis.
✅LIKE AND COMMENT MY IDEAS✅

Will 3 Times Be The Charm For GBPUSD??We can see FX:GBPUSD retrace a tad further up to the Volume Imbalance that was created over the weekend of April 4th - 7th. After Price made its High @ 1.3207, it was immediately rejected back down below the Past Level of Support that is now showing signs of Resistance!
- Following that Higher High not only resulted in a Lower Low but also sent the RSI under 50 into Bearish Territory!
Now in the ICT Methodology of Volume Imbalances, Price is likely to Test or Fill the Imbalance, then once satisfied, has a high potential to turn the opposite direction. Now a Pullback to Fill the Imbalance would land Price right at the 38.2% Fibonacci Level @ 1.28984 where if Bulls are unable to push Price back above, would be an excellent Shorting Opportunity for Bears to overcome.
- RSI is now below the 50 suggesting Bulls have lost steam and strengthens the potential for more downside to occur but that would call for a Break and Retest Scenario on the Rising Support.
Fundamentally, the Federal Reserve will be releasing the CPI y/y and m/m results where analysts believe there to be a .3% decrease in inflation forecasting a 2.5% CPI for March from the previous 2.8% for February. Given this, the FOMC " do not plan to come to rescue Trump with rate cuts" and insist that all the Tariff pressure will actually be a reasoning for Inflation to Rise! So if CPI ends up printing Hotter than Expected (Higher), we could see a renewed strength in the USD.

EURGBP Breakout And Potential RetraceHey Traders, in today's trading session we are monitoring EURGBP for selling opportunity around 0.85700 zone, EURGBP was trading in an uptrend and successfully managed to break it out. Currently is in a correction phase in which it is approaching the retrace area at 0.85700 support and resistance area.
Trade safe, Joe.

USDJPY - BEARISH MOVEHello Traders !
The USDJPY failed to create a new higher high !
Currently, The lower low is broken (change of character).
So, I expect a bearish move📉
______________
TARGET: 144.270🎯

USD/CHF BEARS WILL DOMINATE THE MARKET|SHORT
Hello, Friends!
USD/CHF pair is in the downtrend because previous week’s candle is red, while the price is obviously rising on the 2H timeframe. And after the retest of the resistance line above I believe we will see a move down towards the target below at 0.846 because the pair is overbought due to its proximity to the upper BB band and a bearish correction is likely.
Disclosure: I am part of Trade Nation's Influencer program and receive a monthly fee for using their TradingView charts in my analysis.
✅LIKE AND COMMENT MY IDEAS✅

USDJPY Analysis: Reversal Estimations Based on Trading MathDear Trader,
Please find attached my analysis of $Subject, which uses mathematical calculations to identify potential reversal times and price levels. The analysis details projected south and north price targets (horizontal lines on the chart), along with estimated time frames for possible reversals (vertical lines on the chart, accurate to within +/- 1-2 candles). Please note that all times indicated on the chart, including the vertical lines representing potential reversal times, are based on the UTC+4 time zone.
To increase the probability of these analyses, I recommend monitoring the 5-minute and 15-minute charts for the following key reversal candlestick patterns:
Doji’s
Double Bottom/Top
Engulfing Bullish /Bearish
Hanging Man
Hammer/Inverted Hammer
Morning Star
Shooting Star
Triple Top/Bottom
For those interested in further developing their trading skills based on these types of analyses, consider exploring the mentoring program offered by Shunya Trade.
I welcome your feedback on this analysis, as it will inform and enhance my future work.
Regards,
Shunya Trade
Price levels
Price DH Price DL
144.52194 144.63007
144.48096 144.67107
144.38595 144.76618
144.19602 144.95648
144.00622 145.14691
143.81654 145.33746
143.62698 145.52814
143.43756 145.71894
143.24825 145.90987
143.05907 146.10093
142.30361 146.86639
141.55015 147.63385
140.79868 148.40332
140.04922 149.17478
139.30176 149.94824
138.55630 150.72370
137.81283 151.50117
137.07137 152.28063
⚠️ Disclaimer: This post is educational content and does not constitute investment advice, financial advice, or trading recommendations. The views expressed here are based on technical analysis and are shared solely for informational purposes. The stock market is subject to risks, including capital loss, and readers should exercise due diligence before investing. We do not take responsibility for decisions made based on this content. Consult a certified financial advisor for personalized guidance.

Bond Futures Back At SupportTrade is fairly simple here. Go long treasuries and if it breaks down cut.
- A bounce and push back up could be another ugly catalyst for the US stock market.
- A breakdown however would push yields up (and economic growth forecasts) which would be quite bullish for stocks especially down at these levels

GBPUSD - Support becomes ResistanceHello Traders !
The GBPUSD failed to break the resistance level (1.30490 - 1.29990).
The price broke the support (1.27592 - 1.28116).
This key level becomes new resistance !
So, I expect a bearish move📉
_____________
TARGET: 1.25900🎯

EUR/GBP SHORT FROM RESISTANCE
Hello, Friends!
EUR-GBP uptrend evident from the last 1W green candle makes short trades more risky, but the current set-up targeting 0.852 area still presents a good opportunity for us to sell the pair because the resistance line is nearby and the BB upper band is close which indicates the overbought state of the EUR/GBP pair.
Disclosure: I am part of Trade Nation's Influencer program and receive a monthly fee for using their TradingView charts in my analysis.
✅LIKE AND COMMENT MY IDEAS✅

GOLD BEARS ARE STRONG HERE|SHORT
GOLD SIGNAL
Trade Direction: short
Entry Level: 3,132.31
Target Level: 3,059.08
Stop Loss: 3,180.97
RISK PROFILE
Risk level: medium
Suggested risk: 1%
Timeframe: 5h
Disclosure: I am part of Trade Nation's Influencer program and receive a monthly fee for using their TradingView charts in my analysis.
✅LIKE AND COMMENT MY IDEAS✅

Party's OverDow Futures daily forming a downwards channel with price targets potentially down to 34k and 31k. These drops would be about 20-40% which is considered a true market crash. The falling wedge pattern plays out until potentially June of 2027, but wedges from the top of the range are dangerous as they can turn into bull traps.
- Economic fundamentals have been disconnected from the financial system for some time but as the underlying economy begins to falter (ex. unemployment wave) markets begin to price in data such as falling retail sales.
- President Trump is going through with mass layoffs in the Federal Government which creates unemployment as the private sector has been going through layoffs and has halted actual new hiring since 2023.
- As more traders have become accustomed to "bad news is good news," they will most likely be wiped out trying to buy dips or chase false breakouts doing what they have always done.
- Tariffs regionalize trade which make global economies and supply chains less interconnected. A global economy that is also very levered up on USD denominated debt needs dollar liquidity to continue to function. By regionalizing trade that liquidity is starved which can lead to financial problems on a global scale if not handled carefully.
- Markets are likely to price in these risks over the next 2-3 months leading asset prices and interest rates lower. Expect individual companies to do well at times but then rotate to others while the Dow index itself falls.
- Even if the Dow were to play out the wedge during 2026, without significant improvements to the global financial system expect that move to be a bull trap or a best lead to minimal gains without a new wave of monetary inflation.

SELL GOLDIn todays session we are looking for selling opportunity in this most waited for pair GOLD. It has been extremely bullish. Our entries are at 3160 stops above 3200 and targets as low as 2916. Use proper risk management and wait for confluence.
BEARS INCOMING

HERTZ (HTZ) SEES BULLISH MOVEMENT DESPITE TARIFFSHertz (HTZ) saw a bullish open this morning. Conversely many other assets saw a bearish open. Will Hertz continue this bullish movement, or could this be just a sell off that leads to a stronger downtrend?

GBPCAD - BEARISH MOVEHello Traders !
The GBPCAD failed to create a new higher high !
Currently, The lower low is broken (Break of structure).
So, I expect a bearish move📉
______________
TARGET: 1.82340🎯

GBP/JPY SELLERS WILL DOMINATE THE MARKET|SHORT
GBP/JPY SIGNAL
Trade Direction: short
Entry Level: 193.172
Target Level: 187.511
Stop Loss: 196.946
RISK PROFILE
Risk level: medium
Suggested risk: 1%
Timeframe: 1D
Disclosure: I am part of Trade Nation's Influencer program and receive a monthly fee for using their TradingView charts in my analysis.
✅LIKE AND COMMENT MY IDEAS✅

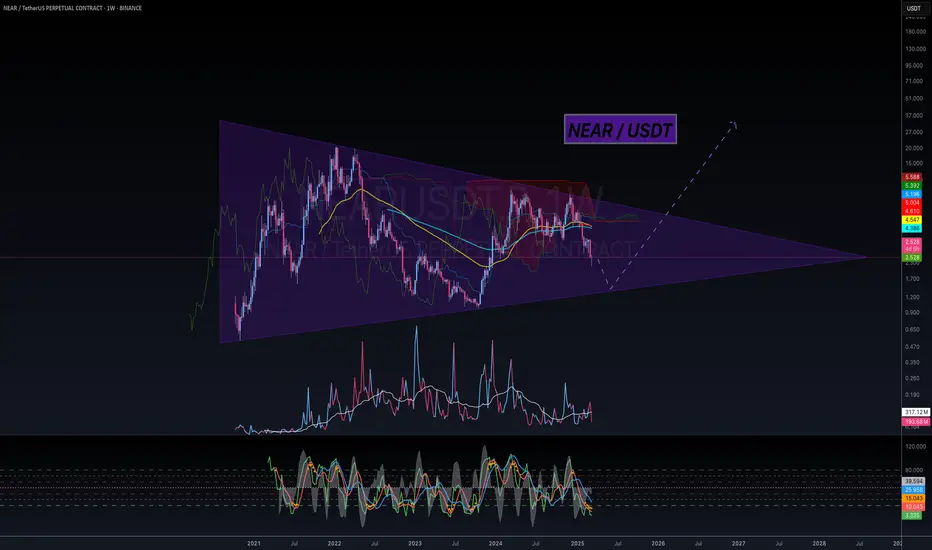
I'm Bullish, but... NEAR / USDTHello again my brothers and sisters,
3 Drive Structure, do I need to say anything else?
I mean, look at this symmetrical triangle, when this blows, in the past, did it only touch base twice? I dont think so, 3 drive structure is needed for this and then we can be extremely bullish!
I'll be loading my boat down there.
If this helped you out, let me know!
Trade thirsty!
I'm Bullish, but... BTC / USDHello my friends,
At a minimum we're looking at 30 days inside this wedge before breaking out and testing the $96k range once again. Trust me, Bitcoin must form a bullish structure before doing anything interesting.
It could wick to FWB:73K but I'm thinking the heavy orders around $75k might hold and we range instead of dumping more.
Keep an eye on this wedge.
Trade thirsty, my friends!
