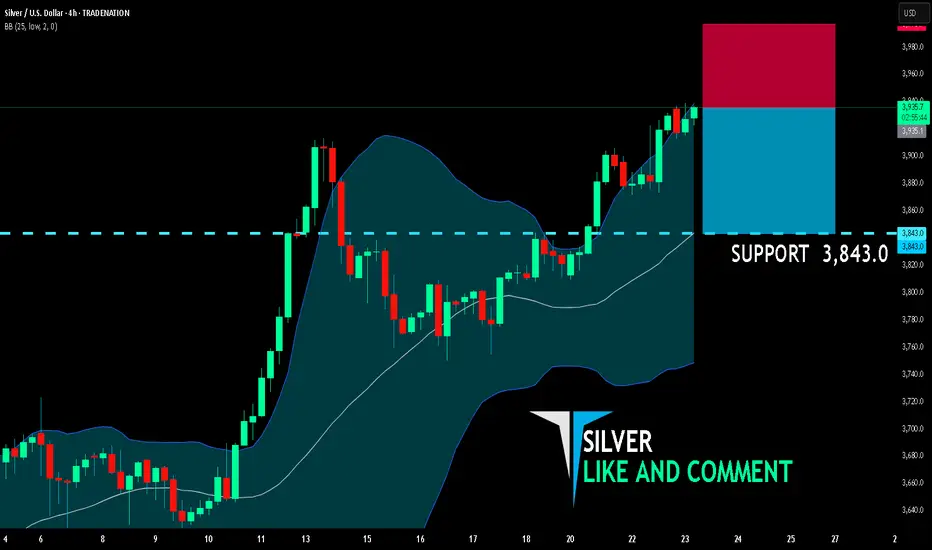
SILVER BEARS ARE GAINING STRENGTH|SHORT
SILVER SIGNAL
Trade Direction: short
Entry Level: 3,935.1
Target Level: 3,843.0
Stop Loss: 3,996.7
RISK PROFILE
Risk level: medium
Suggested risk: 1%
Timeframe: 4h
Disclosure: I am part of Trade Nation's Influencer program and receive a monthly fee for using their TradingView charts in my analysis.
✅LIKE AND COMMENT MY IDEAS✅
Bearish Patterns
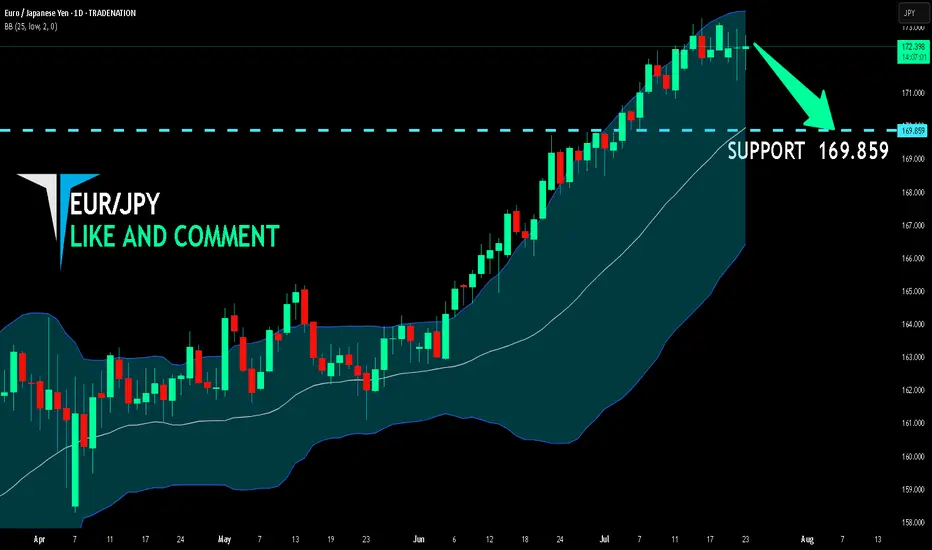
EUR/JPY BEST PLACE TO SELL FROM|SHORT
Hello, Friends!
EUR-JPY uptrend evident from the last 1W green candle makes short trades more risky, but the current set-up targeting 169.859 area still presents a good opportunity for us to sell the pair because the resistance line is nearby and the BB upper band is close which indicates the overbought state of the EUR/JPY pair.
Disclosure: I am part of Trade Nation's Influencer program and receive a monthly fee for using their TradingView charts in my analysis.
✅LIKE AND COMMENT MY IDEAS✅
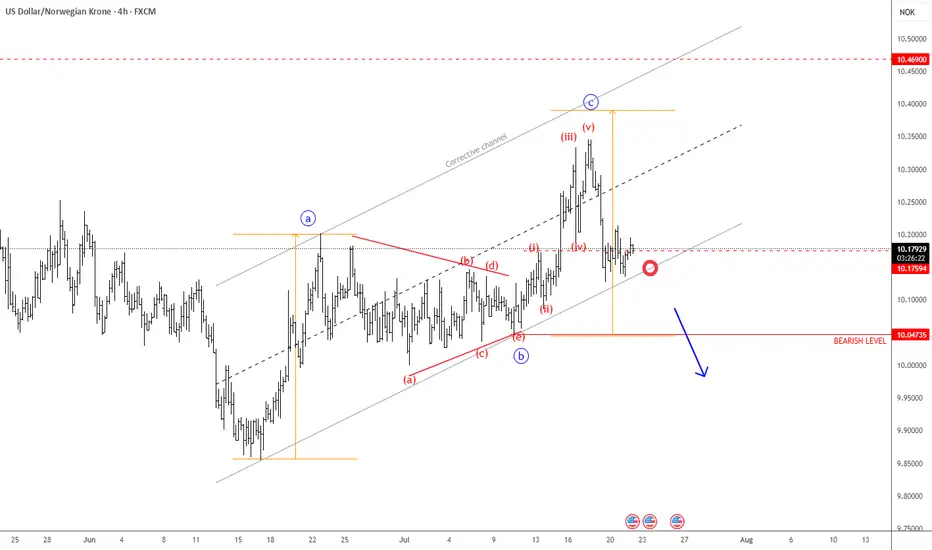
USDNOK Remains BearishUSDNOK made a three-wave rise from the recent low, indicating an abc correction within a downtrend—especially considering the triangle in wave "b" in the middle, and the current sharp decline following a completed five-wave impulse in wave "c". As long as this structure remains intact, there is still a risk of another leg lower. Therefore, we can expect further weakness toward the June lows, especially if it breaks below the channel support line. Just watch out for short-term intraday pullbacks.
EUR/GBP SHORT FROM RESISTANCE
EUR/GBP SIGNAL
Trade Direction: short
Entry Level: 0.867
Target Level: 0.863
Stop Loss: 0.869
RISK PROFILE
Risk level: medium
Suggested risk: 1%
Timeframe: 4h
Disclosure: I am part of Trade Nation's Influencer program and receive a monthly fee for using their TradingView charts in my analysis.
✅LIKE AND COMMENT MY IDEAS✅

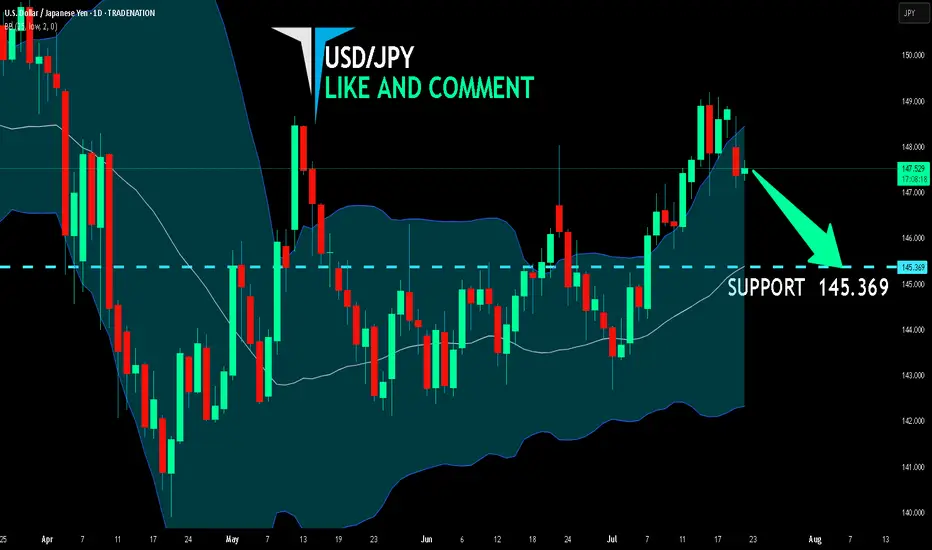
USD/JPY SENDS CLEAR BEARISH SIGNALS|SHORT
Hello, Friends!
USD/JPY pair is trading in a local uptrend which we know by looking at the previous 1W candle which is green. On the 1D timeframe the pair is going up too. The pair is overbought because the price is close to the upper band of the BB indicator. So we are looking to sell the pair with the upper BB line acting as resistance. The next target is 145.369 area.
Disclosure: I am part of Trade Nation's Influencer program and receive a monthly fee for using their TradingView charts in my analysis.
✅LIKE AND COMMENT MY IDEAS✅
etc sell shortterm"🌟 Welcome to Golden Candle! 🌟
We're a team of 📈 passionate traders 📉 who love sharing our 🔍 technical analysis insights 🔎 with the TradingView community. 🌎
Our goal is to provide 💡 valuable perspectives 💡 on market trends and patterns, but 🚫 please note that our analyses are not intended as buy or sell recommendations. 🚫
Instead, they reflect our own 💭 personal attitudes and thoughts. 💭
Follow along and 📚 learn 📚 from our analyses! 📊💡"

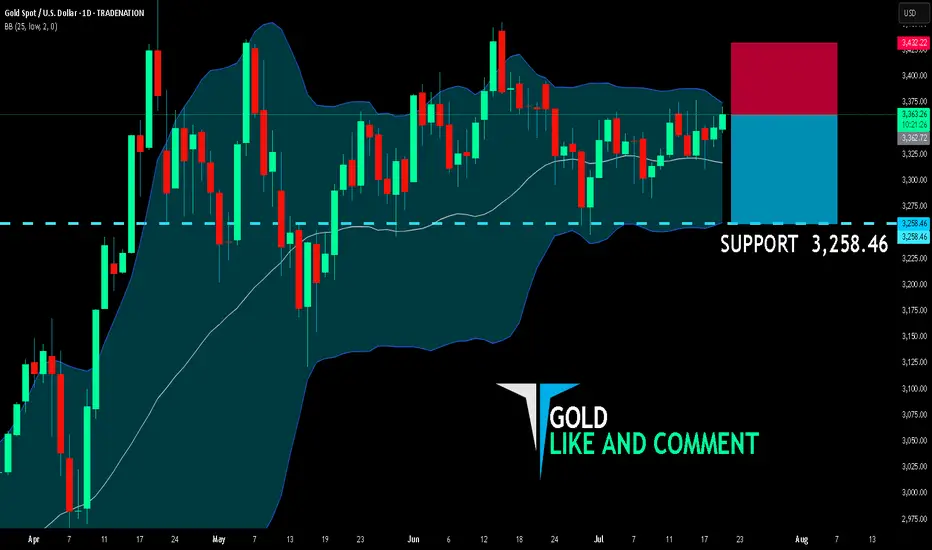
GOLD BEARS ARE GAINING STRENGTH|SHORT
GOLD SIGNAL
Trade Direction: short
Entry Level: 3,362.72
Target Level: 3,258.46
Stop Loss: 3,432.22
RISK PROFILE
Risk level: medium
Suggested risk: 1%
Timeframe: 1D
Disclosure: I am part of Trade Nation's Influencer program and receive a monthly fee for using their TradingView charts in my analysis.
✅LIKE AND COMMENT MY IDEAS✅
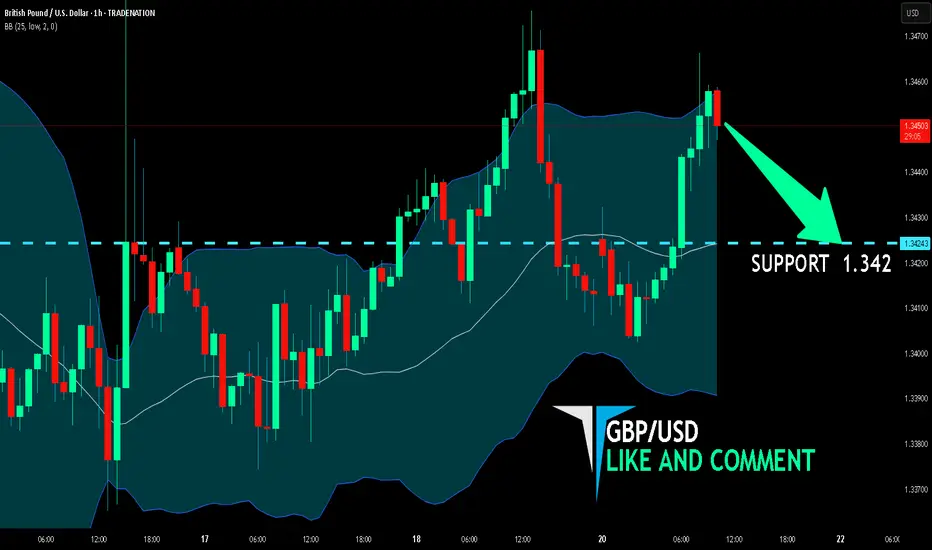
GBP/USD BEARISH BIAS RIGHT NOW| SHORT
Hello, Friends!
We are targeting the 1.342 level area with our short trade on GBP/USD which is based on the fact that the pair is overbought on the BB band scale and is also approaching a resistance line above thus going us a good entry option.
Disclosure: I am part of Trade Nation's Influencer program and receive a monthly fee for using their TradingView charts in my analysis.
✅LIKE AND COMMENT MY IDEAS✅
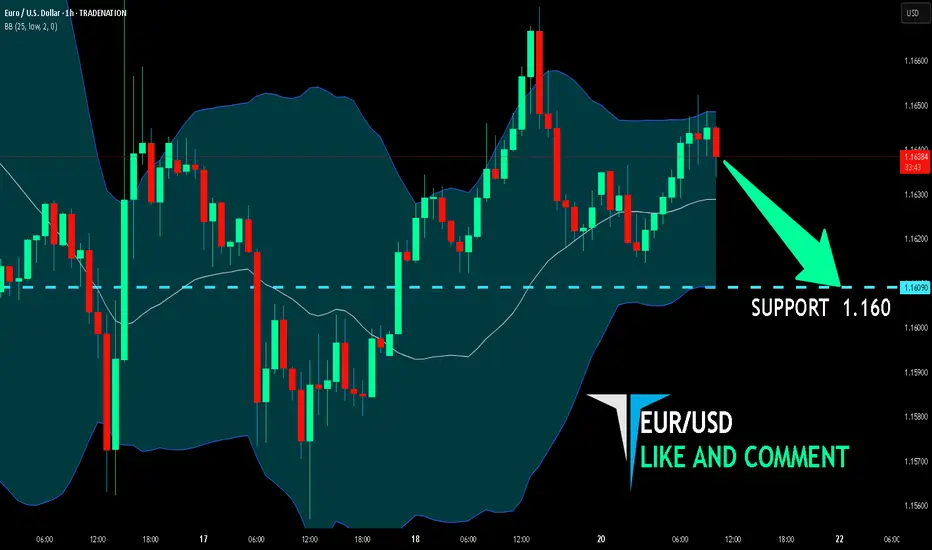
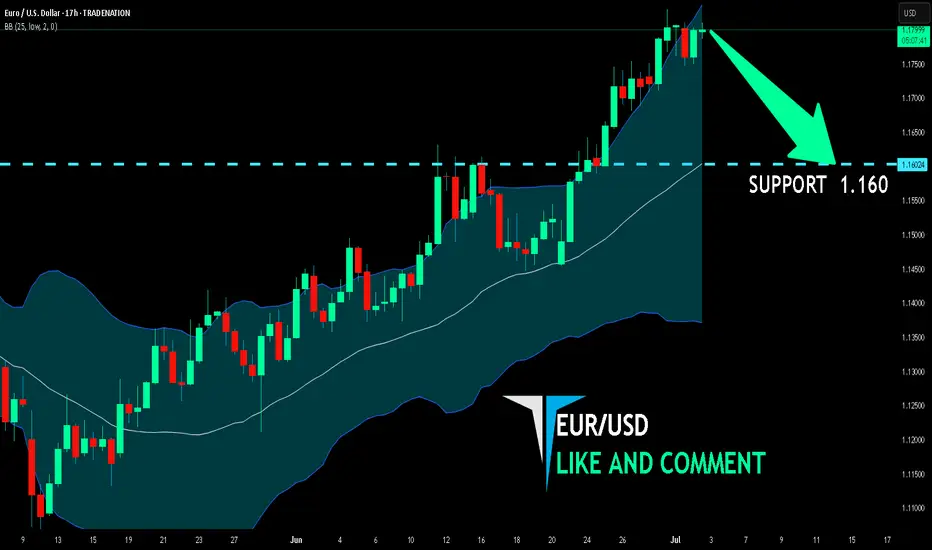
EUR/USD BEST PLACE TO SELL FROM|SHORT
Hello, Friends!
EUR/USD is making a bullish rebound on the 1H TF and is nearing the resistance line above while we are generally bearish biased on the pair due to our previous 1W candle analysis, thus making a trend-following short a good option for us with the target being the 1.160level.
Disclosure: I am part of Trade Nation's Influencer program and receive a monthly fee for using their TradingView charts in my analysis.
✅LIKE AND COMMENT MY IDEAS✅
SILVER SELLERS WILL DOMINATE THE MARKET|SHORT
SILVER SIGNAL
Trade Direction: short
Entry Level: 3,612.8
Target Level: 3,572.6
Stop Loss: 3,639.3
RISK PROFILE
Risk level: medium
Suggested risk: 1%
Timeframe: 2h
Disclosure: I am part of Trade Nation's Influencer program and receive a monthly fee for using their TradingView charts in my analysis.
✅LIKE AND COMMENT MY IDEAS✅

EUR/USD BEST PLACE TO SELL FROM|SHORT
Hello, Friends!
EUR/USD pair is trading in a local downtrend which know by looking at the previous 1W candle which is red. On the 17H timeframe the pair is going up. The pair is overbought because the price is close to the upper band of the BB indicator. So we are looking to sell the pair with the upper BB line acting as resistance. The next target is 1.160 area.
Disclosure: I am part of Trade Nation's Influencer program and receive a monthly fee for using their TradingView charts in my analysis.
✅LIKE AND COMMENT MY IDEAS✅
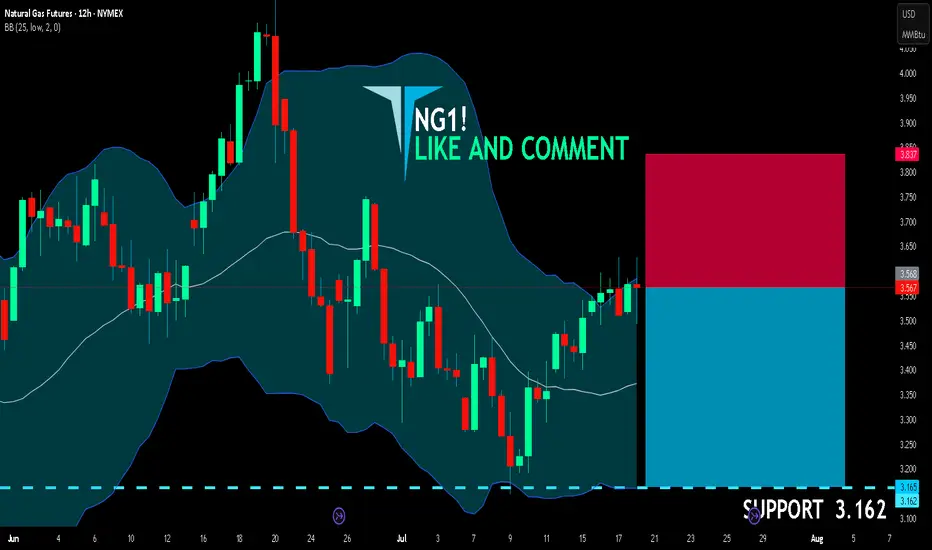
NG1! BEARS ARE GAINING STRENGTH|SHORT
NG1! SIGNAL
Trade Direction: short
Entry Level: 3.737
Target Level: 3.205
Stop Loss: 4.089
RISK PROFILE
Risk level: medium
Suggested risk: 1%
Timeframe: 1D
Disclosure: I am part of Trade Nation's Influencer program and receive a monthly fee for using their TradingView charts in my analysis.
✅LIKE AND COMMENT MY IDEAS✅

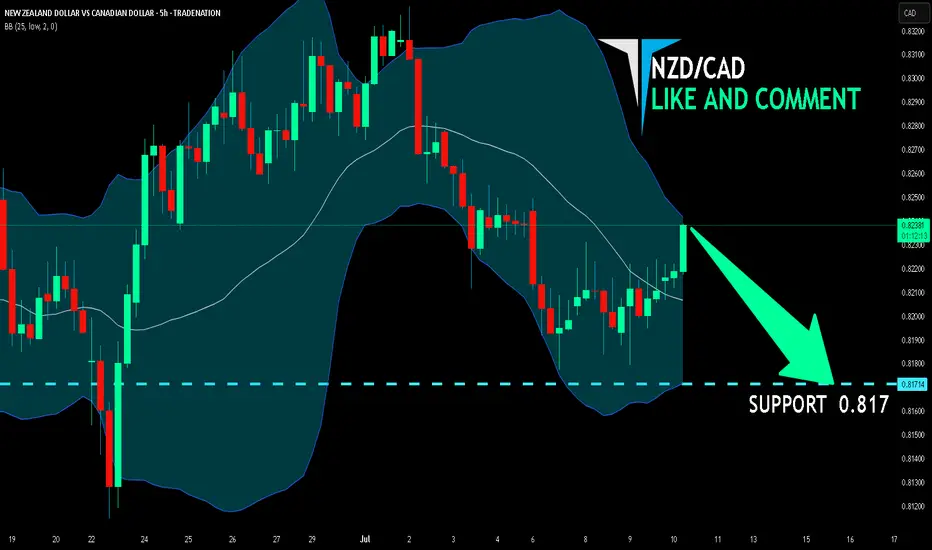
NZD/CAD SELLERS WILL DOMINATE THE MARKET|SHORT
Hello, Friends!
NZD/CAD pair is trading in a local uptrend which we know by looking at the previous 1W candle which is green. On the 5H timeframe the pair is going up too. The pair is overbought because the price is close to the upper band of the BB indicator. So we are looking to sell the pair with the upper BB line acting as resistance. The next target is 0.817 area.
Disclosure: I am part of Trade Nation's Influencer program and receive a monthly fee for using their TradingView charts in my analysis.
✅LIKE AND COMMENT MY IDEAS✅
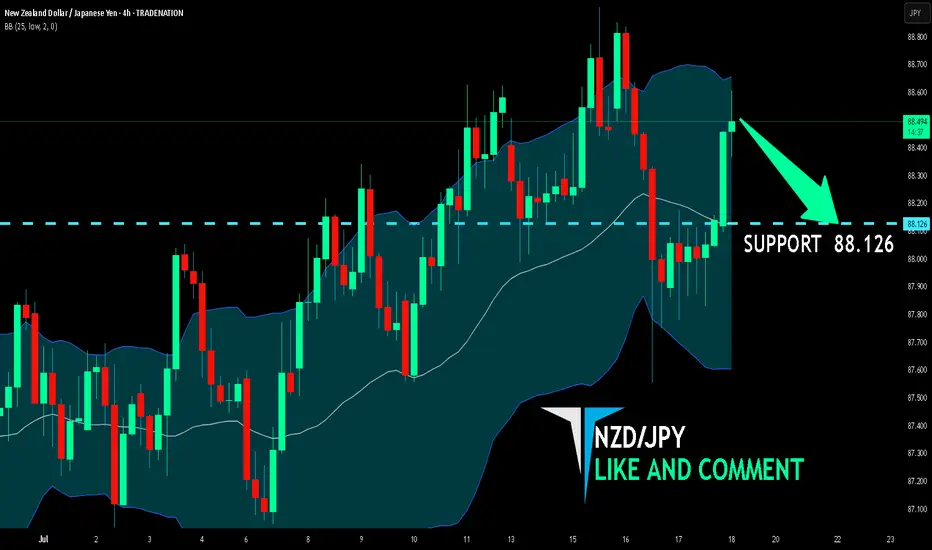
NZD/JPY BEARS ARE STRONG HERE|SHORT
Hello, Friends!
NZD/JPY pair is trading in a local uptrend which we know by looking at the previous 1W candle which is green. On the 4H timeframe the pair is going up too. The pair is overbought because the price is close to the upper band of the BB indicator. So we are looking to sell the pair with the upper BB line acting as resistance. The next target is 88.126 area.
Disclosure: I am part of Trade Nation's Influencer program and receive a monthly fee for using their TradingView charts in my analysis.
✅LIKE AND COMMENT MY IDEAS✅
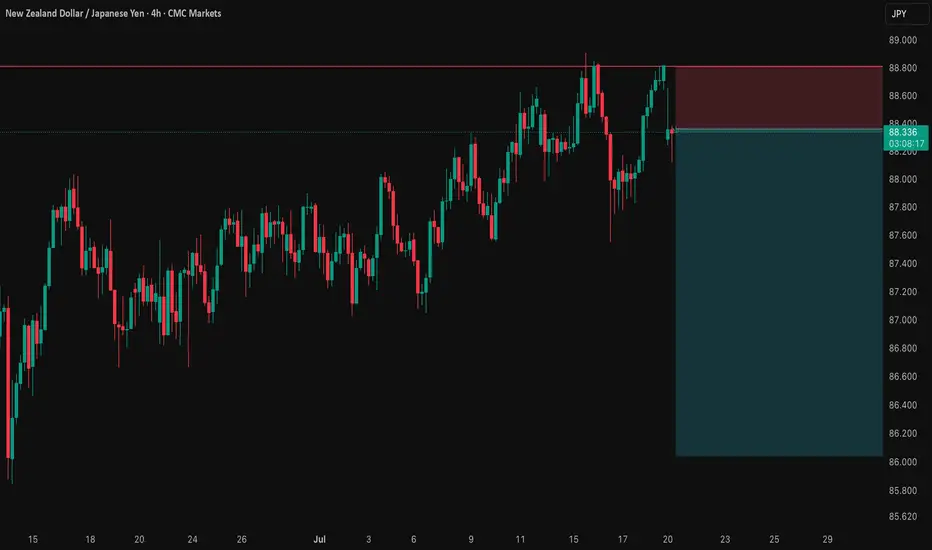
NZD/JPY: A Data-Driven Short SignalBefore I post a trade, I put it through a rigorous, multi-step analysis. Here’s exactly what I did for this NZD/JPY setup to build a data-driven case.
I Started with the 'Why': The Fundamental Story 📰
First, I identified the powerful divergence between the dovish RBNZ and the hawkish BoJ. This gave me my core bearish thesis for the pair.
I Challenged My Idea with Data: The Stress Test 🧠
A good story isn't enough. So, I ran this bearish idea through my mathematical models . My goal was to find any hidden risks and see if the hard data supported my fundamental view.
What My Analysis Revealed: A Warning and a Confirmation ⚠️
The data came back with two critical insights:
Confirmation: The models strongly validated the bearish direction with a high degree of mathematical probability.
Warning: They exposed a hidden danger—a standard entry had a very high probability of getting stopped out in the current market.
I Engineered the Solution: The Optimized Plan 🛠️
This is the most important step. I used these data insights to build a new trade plan from the ground up. The entry, stop loss, and take profit below are not guesses; they are the output of my analysis, specifically designed to navigate the risk the data uncovered.
The result is a trade with a huge 5.15-to-1 Risk-to-Reward ratio , where my fundamental view is now backed by a data-driven execution strategy. Let's get into it. 👇
The Complete Trade Plan
Strategy & Trade Parameters ✅
📉 Pair: NZD/JPY
👉 Direction: Short
⛔️ Entry: 88.35800
🎯 Take Profit: 86.04347
🛡️ Stop Loss: 88.80723
⚖️ Risk-Reward: 5.15
This setup represents my ideal trading approach: forming a strong fundamental thesis and then using disciplined, mathematical analysis to define the execution. The result is a plan where the direction is clear and the risk is precisely managed. Trade safe.
Technical Analysis: NIFTY50 (Closing: ₹24,968.40 on 18-Jul-2025)*Analysis as of 21-Jul-2025 (Monday)*
1. Candlestick Patterns
Daily: A bearish engulfing pattern formed on 18-Jul-2025, closing below the prior candle’s low. Signals short-term reversal risk.
Weekly: Doji formation (indecision) near all-time highs. Weekly close below ₹25,000 warns of exhaustion.
Intraday (4H): Bearish pin bars at ₹25,100 resistance. Watch for follow-through selling below ₹24,900.
2. Harmonic Patterns
Daily: Potential Bearish Bat pattern in development:
XA: ₹23,200 → ₹25,200 (100%)
B: 61.8% retracement at ₹24,400 (pending)
Confirmation below ₹24,400 targets ₹23,800 (0.886XA).
3. Elliott Wave Theory
Weekly: Final waves of Wave 5 (impulse) likely complete at ₹25,200.
Daily: Starting ABC corrective wave:
Wave A: ₹25,200 → ₹24,800 (if breaks ₹24,900)
Wave B: Rally to ₹25,000–25,100 (short opportunity)
Wave C: Target ₹24,300 (1.618xA).
Intraday (1H): Minute wave iii down in progress below ₹24,950.
4. Wyckoff Theory
Phase: Potential distribution near highs:
Upthrust (18-Jul high ₹25,120) failed to hold.
Spring Level: ₹24,900. Break confirms downtrend (test supply).
Downside target: ₹24,500 (fall after distribution).
5. W.D. Gann Analysis
Square of 9:
Key support: √24,968 ≈ 158.0 → 158² = 24,964 (critical pivot).
Close below 24,964 opens ₹24,650 (next square).
Time Cycles:
21-Jul is 180° from 21-Jan 2025 high. Watch for trend change.
Gann Angle: 1x1 angle from Jul-2025 high at ₹25,200 → breaks below imply ₹400/day decline.
6. Ichimoku Kinko Hyo (Daily)
Tenkan: ₹24,950 (resistance)
Kijun: ₹24,800 (support)
Cloud: Lagging span below price; cloud thinning (bearish momentum).
Signal: Price below Kijun → trend weakness.
7. Key Indicators
RSI (Daily): 62 → declining from overbought (70). Bearish divergence.
Bollinger Bands (4H): Price testing lower band (₹24,900). Break targets ₹24,600 (2σ lower).
VWAP (1H): ₹25,050 → intraday resistance.
Moving Averages:
Death Cross (50-DMA/200-DMA): Not triggered, but 5-DMA (₹25,020) crossed below 20-DMA (₹25,050).
Timeframe Summary
Timeframe Key Levels Bias Pattern/Thesis
5M/15M Res: ₹24,990 Bearish Scalp shorts below VWAP (₹25,050)
30M/1H Res: ₹25,050 Sup: ₹24,900 Bearish Bearish EW wave iii; RSI < 50
4H Res: ₹25,100 Sup: ₹24,800 Neutral Break below ₹24,800 confirms Wyckoff distribution
Daily Res: ₹25,200 Sup: ₹24,400 Bearish Bearish Bat + ABC correction
Weekly Res: ₹25,500 Sup: ₹24,000 Neutral Doji warns of reversal; hold ₹24,400 key
Actionable Outlook
Intraday (21-Jul):
Short below ₹24,900 (SL: ₹25,050) → Target ₹24,800.
Break below ₹24,800 extends to ₹24,650.
Swing (1–2 Weeks):
Sell rallies near ₹25,100 (SL: ₹25,250) → Target ₹24,400.
Weekly close > ₹25,200 invalidates bearish view.
Critical Supports: ₹24,800 (Wyckoff spring) → ₹24,400 (Harmonic/EW target) → ₹24,000 (psychological).
Key Resistances: ₹25,050 (VWAP) → ₹25,200 (ATH) → ₹25,500 (Gann square).

RCI, Bear Flag On The Daily As Well As The 4hr Analyzing both the daily and 4-hour charts reveals a very prominent bear flag, which has formed following a steep decline. This pattern is often indicative of further downward movement, and it's hard to ignore the implications.
Word on the street is that they're currently in dire straits. Since the Shaw acquisition, they've hemorrhaged 11 billion in valuation. The situation is exacerbated by declining revenues and missed growth targets. In short, it's not looking promising.
If the trend continues downward, we might see the price testing the $19 USD mark sooner rather than later.
For those who are currently long on this or have any vested interest, it might be prudent to reconsider your position and cut your losses before it's too late.

USD/JPY: The 150.00 Rejection SignalThe chart for USD/JPY looks like a simple one-way street going up. But underneath the surface, my quantitative models are in a state of conflict, and that's a high-clarity signal that something is about to change.
This isn't a signal to short right now. This is a signal to be patient and watch for a very specific setup that the "smart money" models are anticipating.
The Quant Conflict 🤖
My analysis involves several different mathematical models. Here's the situation:
One model, which is great at tracking trends, is still signaling BUY , following the obvious upward momentum.
However, two other, more complex models that analyze the relationships between economic data are now flashing a SELL signal. They are detecting underlying weakness that the price chart isn't showing yet.
When the simple trend model and the complex structural models disagree, it often means a major turning point is near. We are siding with the smarter models, but we need price action to confirm their warning.
The Game Plan 📊
We will use the 150.00 level as our "line in the sand." We are waiting for the market to fail at this level and then break down, which would confirm the bearish quant signal. This is our high-probability entry trigger.
Here is the exact setup we are waiting for:
📉 THE SETUP: A patient short position, waiting for confirmation of a breakdown.
👉 ENTRY: We enter only on a confirmed daily close below 148.00.
⛔️ STOP LOSS: Place the stop just above the psychological wall at 150.25.
🎯 TAKE PROFIT: Our primary target is the major support level at 145.00.
This is a setup where patience pays. We are letting the market do the hard work and show its hand before we commit. Let's watch this one closely.

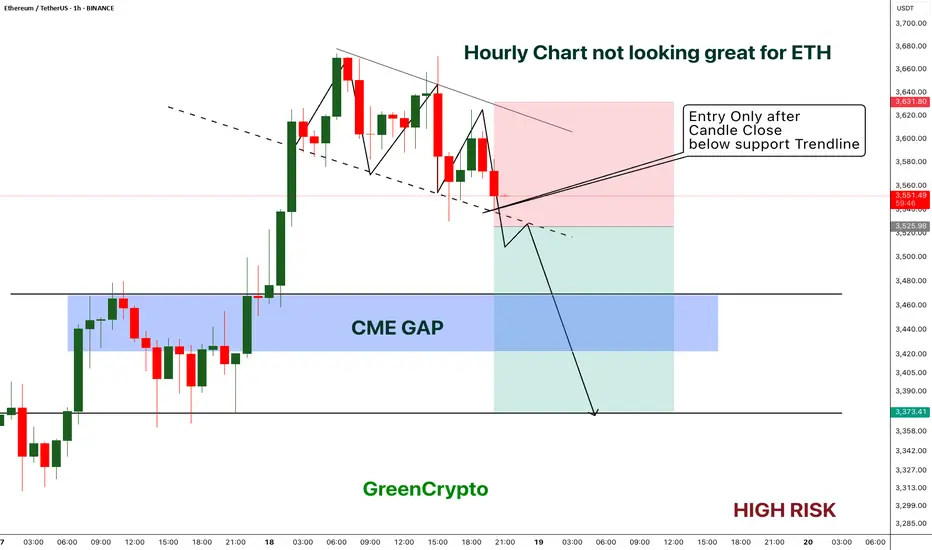
ETH - Short Trade with HIGH RISK- ETH got reject from resistance multiple times on 1H timeframe and now the price is playing near the support.
- I'm expecting overall market to cooldown this weekend, this could push the ETH to break the support
- ETH has CME gap around 3422 - 3467 range, im expecting this CME gap to be filled soon.
Entry Price: Below 3525
Stop Loss: 3631
TP1: 3471.15
TP2: 3381.76
Move SL to breakeven on TP1 hit.
Don't forget to keep stoploss.
Cheers
GreenCrypto
NG1! BEARS ARE STRONG HERE|SHORT
NG1! SIGNAL
Trade Direction: short
Entry Level: 3.568
Target Level: 3.162
Stop Loss: 3.837
RISK PROFILE
Risk level: medium
Suggested risk: 1%
Timeframe: 12h
Disclosure: I am part of Trade Nation's Influencer program and receive a monthly fee for using their TradingView charts in my analysis.
✅LIKE AND COMMENT MY IDEAS✅
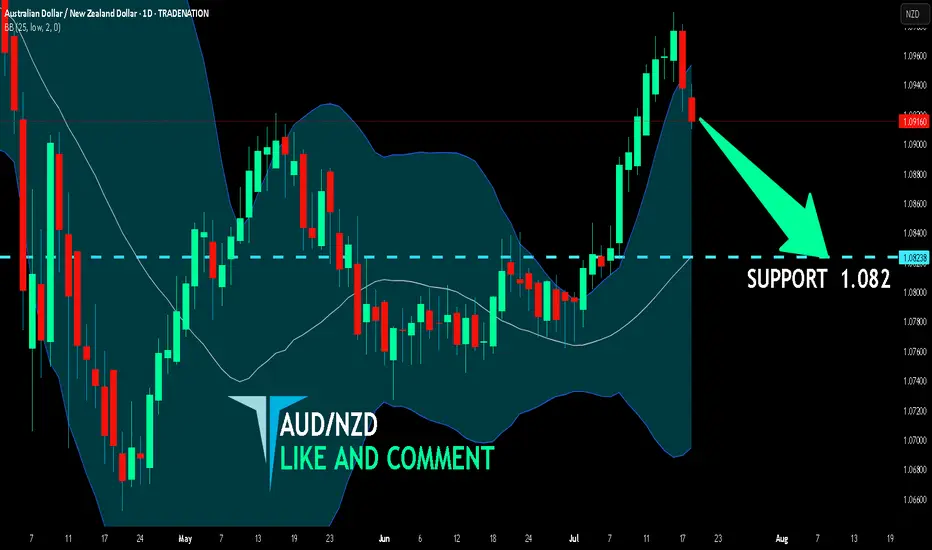
AUD/NZD SHORT FROM RESISTANCE
Hello, Friends!
The BB upper band is nearby so AUD/NZD is in the overbought territory. Thus, despite the uptrend on the 1W timeframe I think that we will see a bearish reaction from the resistance line above and a move down towards the target at around 1.082.
Disclosure: I am part of Trade Nation's Influencer program and receive a monthly fee for using their TradingView charts in my analysis.
✅LIKE AND COMMENT MY IDEAS✅
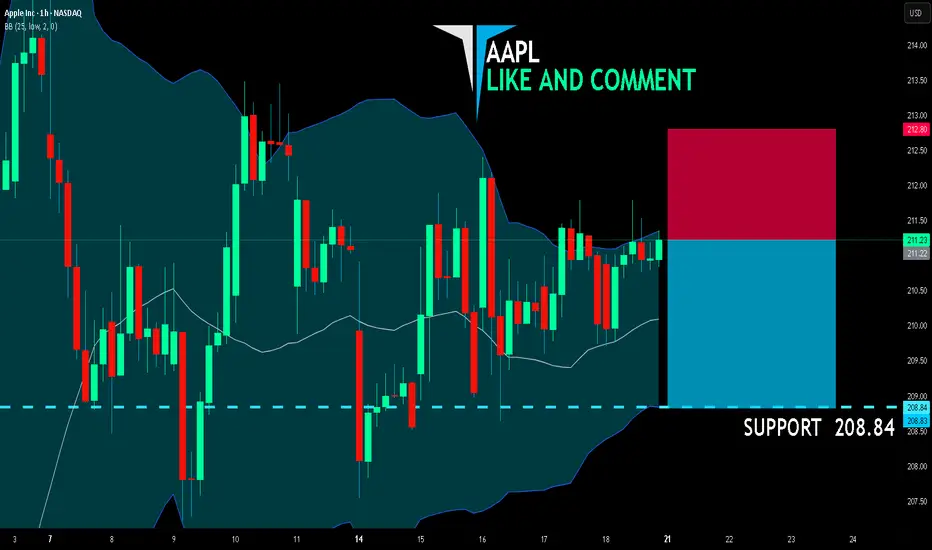
AAPL BEARS WILL DOMINATE THE MARKET|SHORT
AAPL SIGNAL
Trade Direction: short
Entry Level: 211.22
Target Level: 208.84
Stop Loss: 212.80
RISK PROFILE
Risk level: medium
Suggested risk: 1%
Timeframe: 1h
Disclosure: I am part of Trade Nation's Influencer program and receive a monthly fee for using their TradingView charts in my analysis.
✅LIKE AND COMMENT MY IDEAS✅
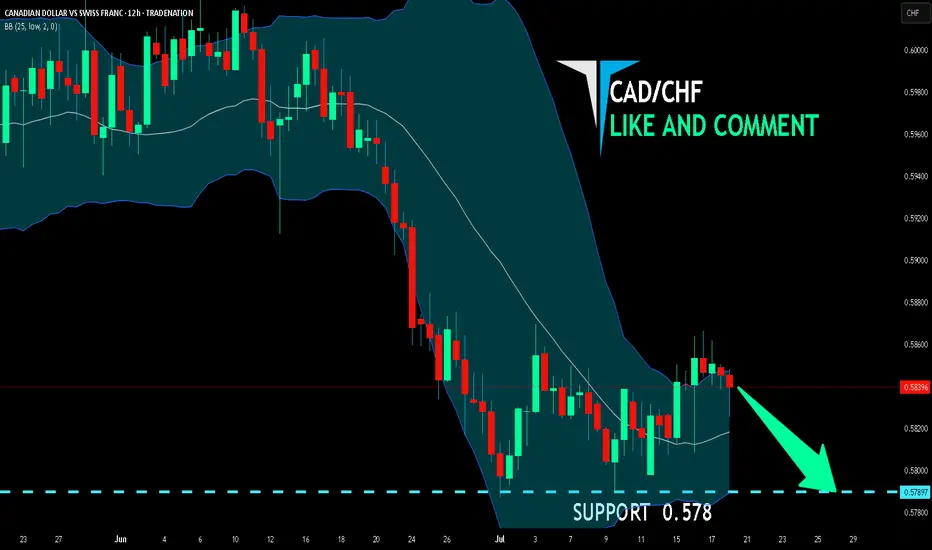
CAD/CHF SENDS CLEAR BEARISH SIGNALS|SHORT
Hello, Friends!
Previous week’s green candle means that for us the CAD/CHF pair is in the uptrend. And the current movement leg was also up but the resistance line will be hit soon and upper BB band proximity will signal an overbought condition so we will go for a counter-trend short trade with the target being at 0.578.
Disclosure: I am part of Trade Nation's Influencer program and receive a monthly fee for using their TradingView charts in my analysis.
✅LIKE AND COMMENT MY IDEAS✅