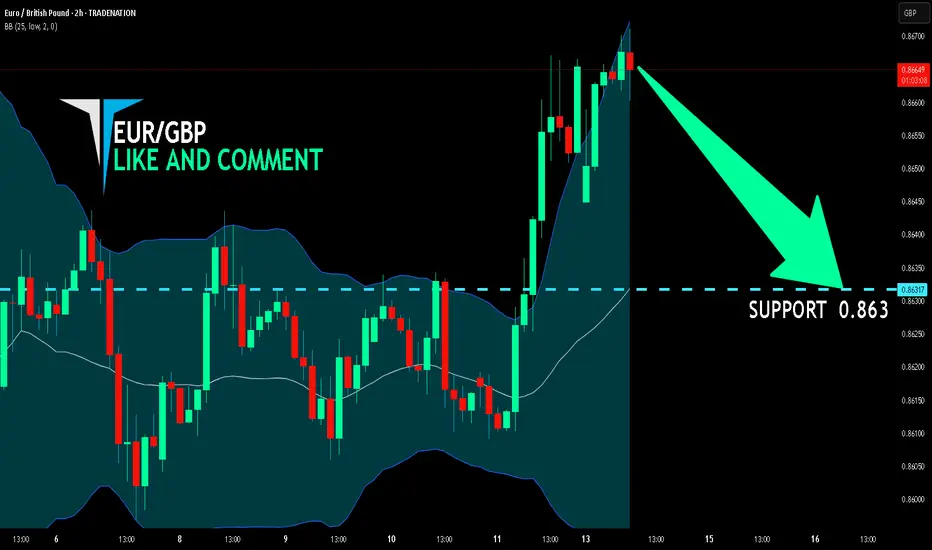
EUR/GBP BEARS ARE STRONG HERE|SHORT
Hello, Friends!
We are going short on the EUR/GBP with the target of 0.863 level, because the pair is overbought and will soon hit the resistance line above. We deduced the overbought condition from the price being near to the upper BB band. However, we should use low risk here because the 1W TF is green and gives us a counter-signal.
Disclosure: I am part of Trade Nation's Influencer program and receive a monthly fee for using their TradingView charts in my analysis.
✅LIKE AND COMMENT MY IDEAS✅
Bearish Patterns
GBP/AUD SHORT FROM RESISTANCE
GBP/AUD SIGNAL
Trade Direction: short
Entry Level: 2.098
Target Level: 2.062
Stop Loss: 2.122
RISK PROFILE
Risk level: medium
Suggested risk: 1%
Timeframe: 1D
Disclosure: I am part of Trade Nation's Influencer program and receive a monthly fee for using their TradingView charts in my analysis.
✅LIKE AND COMMENT MY IDEAS✅

Bitcoin’s Incoming Bear Market!🚀 Bitcoin’s Bullish Phase: The Final Push Before the Fall?
Bitcoin is currently in the parabolic uptrend phase of its halving cycle, with price action closely following historical patterns. Since the last halving on April 15, 2024, Bitcoin has mined approximately 42,480 blocks, pushing the market closer to the 70,000-block threshold where the trend historically reverses into a deep bear market.
Based on historical patterns, Bitcoin’s next major bull market peak is expected around 150,000 USD, approximately 70,000 blocks post-halving (projected for August 2025). However, investors must prepare for what follows—a severe bear market fuelled by miner capitulation.
🔥The 70,000-Block Bearish Reversal: Why It Happens Every Cycle
1. The Mining Difficulty Trap & Rising Costs
Bitcoin’s mining difficulty adjusts every 2,016 blocks (~2 weeks) to maintain the 10-minute block interval.
As BTC price surges in the bull market, more miners join the network, driving competition and difficulty higher.
This raises mining costs and squeezes profit margins, making it harder for smaller miners to stay afloat.
✅ Bull Market (~0-70,000 Blocks Post-Halving)
High BTC prices offset increased difficulty, allowing miners to hold rather than sell.
Low sell pressure from miners keeps Bitcoin in an uptrend.
❌ Bear Market (~70,000 Blocks Post-Halving)
After BTC peaks, prices decline but difficulty remains high.
Mining costs remain constant, while block rewards drop.
Weaker miners can’t afford to mine at a loss and are forced to sell their BTC holdings to cover operational expenses.
2. The Snowball Effect: How Miner Capitulation Triggers a Crash
Once inefficient miners begin selling, a chain reaction unfolds:
1️⃣ Bitcoin price starts declining after the cycle peak (~12-18 months post-halving).
2️⃣ Miners struggle to remain profitable due to high difficulty and lower block rewards.
3️⃣ Miners begin offloading BTC to cover expenses, increasing supply in the market.
4️⃣ More BTC supply leads to further price drops, triggering panic selling.
5️⃣ Additional miners shut down operations, selling off reserves, further flooding the market.
6️⃣ Capitulation accelerates, causing a cascading effect similar to leveraged liquidations seen in past bear markets.
🔄 This cycle repeats until enough miners exit, difficulty adjusts downward, and BTC stabilizes.
3. Historical Proof: How Miner Capitulation Has Marked Every Bear Market
Each Bitcoin bear market aligns with major miner capitulation events. Here’s how past cycles have played out:
📌 2012 Halving: Bull top in late 2013, miner capitulation in 2014, BTC fell -80%.
📌 2016 Halving: Bull top in late 2017, miner capitulation in 2018, BTC fell -84%.
📌 2020 Halving: Bull top in late 2021, miner capitulation in 2022, BTC fell -78%.
📌 2024 Halving: Expected bull top in late 2025, miner capitulation likely in 2026?, BTC decline TBD but estimated to be around -60%.
🔹 In all cases, BTC topped ~70,000 blocks after the halving, followed by a deep drawdown driven by miner capitulation.
🔹 The selling pressure from miners perfectly aligns with the start of major market crashes.
4. The Accumulation Phase: What Follows the Crash?
After miners capitulate and difficulty adjusts downward, Bitcoin enters a sideways accumulation phase (~140,000-210,000 blocks post-halving).
Weaker miners have already exited, reducing sell pressure.
Surviving miners adjust to lower rewards and stop mass selling BTC.
Smart money (whales & institutions) begin accumulating at undervalued prices.
The MVRV ratio drops below 1, signalling a market bottom.
Bitcoin stabilizes, setting the stage for the next bull cycle.
This predictable recovery cycle lays the groundwork for Bitcoin’s next exponential rally into the next halving period.
The Bitcoin Bear Market Prediction for 2025-2026
✅ Bitcoin is currently on track to peak near ~$150,000 around 70,000 blocks post-halving (August 2025).
✅ Following this, BTC is expected to enter its bear market, with prices potentially falling to ~$60,000 (by December 2026).
✅ The primary catalyst for this crash will be miner capitulation, just as it has been in every prior cycle.
Final Thoughts
If history repeats, the Bitcoin market is set to follow a sharp parabolic rise to ~$150,000 before undergoing a 70,000-block miner-driven selloff into a multi-month bear market. Investors should be aware of this pattern and plan accordingly.
Sources & Data Validation
The insights presented in this article are based on historical Bitcoin price cycles, on-chain analytics, and mining difficulty trends from various sources, including:
Blockchain Data (Glassnode, CoinMetrics)
Historical BTC Halving Data (Bitcoin Whitepaper, Blockchain Explorers)
Market Analysis Reports (Messari, Arcane Research)
Macroeconomic Influences (Federal Reserve Reports, Global Liquidity Cycles)
Disclaimer: Not an Investment Recommendation
This article is for informational purposes only and should not be considered financial or investment advice. Bitcoin and cryptocurrency markets are highly volatile, and past performance is not indicative of future results. Conduct your own research and consult with a financial professional before making any investment decisions.

NG1! SHORT FROM RESISTANCE
NG1! SIGNAL
Trade Direction: short
Entry Level: 3.356
Target Level: 3.150
Stop Loss: 3.493
RISK PROFILE
Risk level: medium
Suggested risk: 1%
Timeframe: 2h
Disclosure: I am part of Trade Nation's Influencer program and receive a monthly fee for using their TradingView charts in my analysis.
✅LIKE AND COMMENT MY IDEAS✅

USOIL SENDS CLEAR BEARISH SIGNALS|SHORT
USOIL SIGNAL
Trade Direction: short
Entry Level: 68.66
Target Level: 67.34
Stop Loss: 69.53
RISK PROFILE
Risk level: medium
Suggested risk: 1%
Timeframe: 2h
Disclosure: I am part of Trade Nation's Influencer program and receive a monthly fee for using their TradingView charts in my analysis.
✅LIKE AND COMMENT MY IDEAS✅

EUR/USD SELLERS WILL DOMINATE THE MARKET|SHORT
Hello, Friends!
Previous week’s green candle means that for us the EUR/USD pair is in the uptrend. And the current movement leg was also up but the resistance line will be hit soon and upper BB band proximity will signal an overbought condition so we will go for a counter-trend short trade with the target being at 1.133.
Disclosure: I am part of Trade Nation's Influencer program and receive a monthly fee for using their TradingView charts in my analysis.
✅LIKE AND COMMENT MY IDEAS✅

GOLD BEARISH BIAS RIGHT NOW| SHORT
GOLD SIGNAL
Trade Direction: short
Entry Level: 3,346.66
Target Level: 3,283.88
Stop Loss: 3,388.42
RISK PROFILE
Risk level: medium
Suggested risk: 1%
Timeframe: 9h
Disclosure: I am part of Trade Nation's Influencer program and receive a monthly fee for using their TradingView charts in my analysis.
✅LIKE AND COMMENT MY IDEAS✅

NZD/CHF BEARS ARE STRONG HERE|SHORT
Hello, Friends!
NZD/CHF is trending down which is clear from the red colour of the previous weekly candle. However, the price has locally surged into the overbought territory. Which can be told from its proximity to the BB upper band. Which presents a classical trend following opportunity for a short trade from the resistance line above towards the demand level of 0.475.
Disclosure: I am part of Trade Nation's Influencer program and receive a monthly fee for using their TradingView charts in my analysis.
✅LIKE AND COMMENT MY IDEAS✅

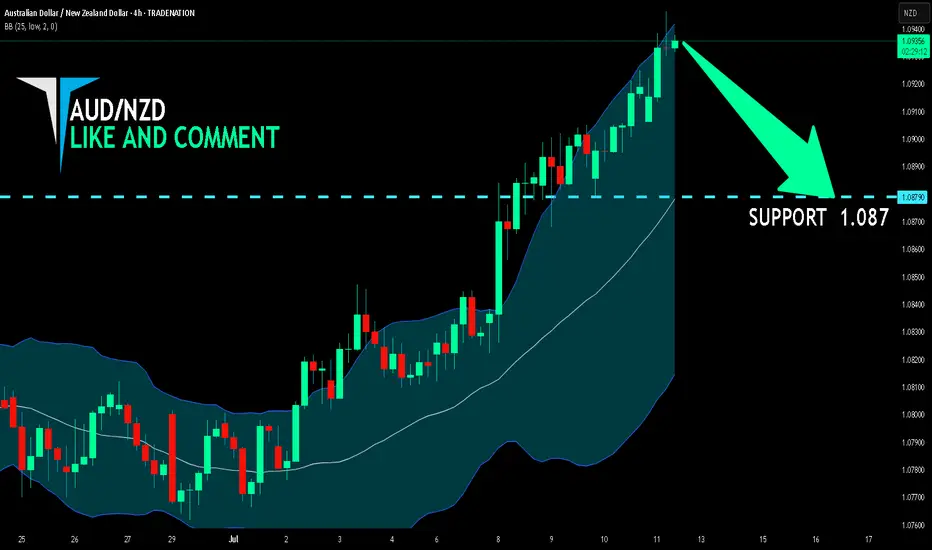
AUD/NZD SHORT FROM RESISTANCE
Hello, Friends!
AUD/NZD pair is in the downtrend because previous week’s candle is red, while the price is clearly rising on the 4H timeframe. And after the retest of the resistance line above I believe we will see a move down towards the target below at 1.087 because the pair is overbought due to its proximity to the upper BB band and a bearish correction is likely.
Disclosure: I am part of Trade Nation's Influencer program and receive a monthly fee for using their TradingView charts in my analysis.
✅LIKE AND COMMENT MY IDEAS✅
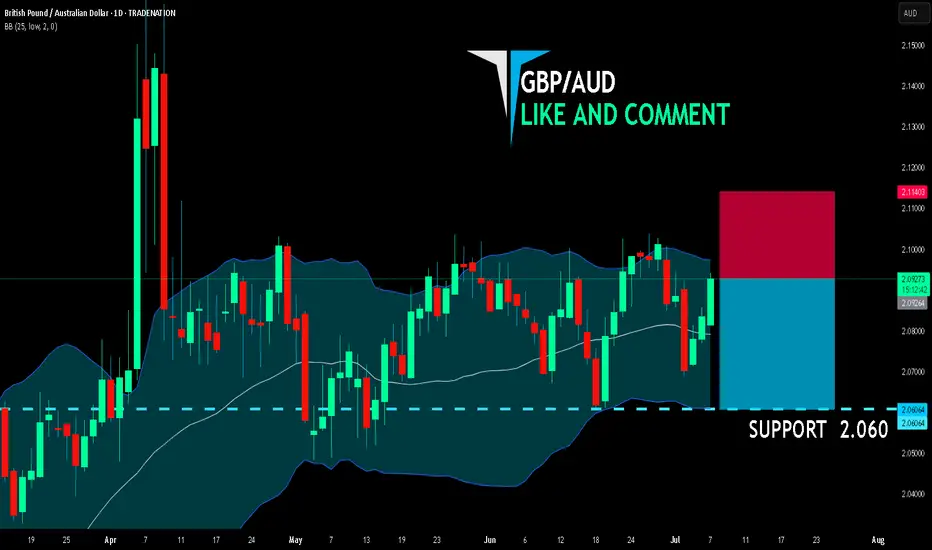
GBP/AUD BEARS ARE STRONG HERE|SHORT
GBP/AUD SIGNAL
Trade Direction: short
Entry Level: 2.092
Target Level: 2.060
Stop Loss: 2.114
RISK PROFILE
Risk level: medium
Suggested risk: 1%
Timeframe: 1D
Disclosure: I am part of Trade Nation's Influencer program and receive a monthly fee for using their TradingView charts in my analysis.
✅LIKE AND COMMENT MY IDEAS✅
GBP/NZD BEARISH BIAS RIGHT NOW| SHORT
Hello, Friends!
GBP-NZD uptrend evident from the last 1W green candle makes short trades more risky, but the current set-up targeting 2.251 area still presents a good opportunity for us to sell the pair because the resistance line is nearby and the BB upper band is close which indicates the overbought state of the GBP/NZD pair.
Disclosure: I am part of Trade Nation's Influencer program and receive a monthly fee for using their TradingView charts in my analysis.
✅LIKE AND COMMENT MY IDEAS✅

EURUSD - Bears Are on the MoveHello TradingView Family / Fellow Traders. This is Richard, also known as theSignalyst.
📈EURUSD has been overall bearish trading within the falling wedge pattern marked in red. And it is currently retesting the upper bound of the wedge.
Moreover, the blue zone is a strong structure.
🏹 Thus, the highlighted red circle is a strong area to look for sell setups as it is the intersection of the upper red trendline and structure.
📚 As per my trading style:
As #EURUSD approaches the red circle zone, I will be looking for bearish reversal setups (like a double top pattern, trendline break , and so on...)
📚 Always follow your trading plan regarding entry, risk management, and trade management.
Good luck!
All Strategies Are Good; If Managed Properly!
~Rich
Disclosure: I am part of Trade Nation's Influencer program and receive a monthly fee for using their TradingView charts in my analysis.

AUD/USD: Short Setup to 0.6450This trade idea is rooted in a data-driven approach, leveraging a rare asymmetry in the economic calendar and specific quantitative models to identify a high-clarity opportunity.
📊 The Thesis by the Numbers
My model assigns clear probabilities to the potential scenarios for this week, based on the scheduled U.S. data releases.
60% Probability: Base Case (USD Strength). Triggered by a U.S. Core CPI reading at or above 0.3% MoM.
30% Probability: Alternative Case (USD Weakness).
10% Probability: Wildcard Scenario (Risk-On Rally).
🧠 The Data-Driven Rationale
This setup scored a -5 on my quantitative thesis model, indicating a strong bearish conviction. The core of this is the one-sided event risk. With Australia's calendar completely empty, the AUD is a sitting duck. Meanwhile, a volley of tier-one U.S. data (CPI, PPI, Retail Sales) is expected to confirm a robust economy. This fundamental divergence, combined with a technical picture of price coiling below long-term resistance, creates the conditions for a catalyst-driven drop.
⛓️ Intermarket & Statistical Edge
Further analysis of market correlations and forward-looking models reinforces the bearish bias.
🌐 Correlations: The positive correlation of AUD/USD with equities (SPY: +0.31) suggests that a strong USD report, which could pressure stocks, would create a direct headwind for the Aussie.
🎲 Monte Carlo Simulation: While the mean outcome is neutral, the model's 5th percentile for price is down at 0.6503 , highlighting the statistical risk of a significant downside move if the catalyst fires.
✅ The Trade Setup
📉 Bias: Bearish / Short
👉 Entry: Watch for a bearish reversal pattern on the 1H or 4H chart within the $0.6550 resistance zone.
⛔️ Stop Loss: A decisive daily close above the 0.6622 resistance level.
🎯 Target: 0.6458 (June low-day close).
Good luck, and trade safe.

GBP/USD: Path to 1.3200 on Policy DivergenceThis trade idea outlines a high-conviction bearish thesis for GBP/USD. The core of this analysis is a significant and growing divergence between the fundamental outlooks of the UK and US economies, which is now being confirmed by a bearish technical structure. We anticipate the upcoming UK economic data releases during the week of July 14-18 to act as a catalyst for the next leg down.
The Fundamental Why 📰
The primary driver for this trade is the widening policy and economic divergence. The UK is facing a triad of headwinds while the US economy exhibits greater resilience. This fundamental imbalance favors the US Dollar and is expected to intensify.
Dovish Bank of England: The BoE is clearly signaling a dovish pivot towards monetary easing in response to a weakening labor market and sluggish growth prospects. This contrasts with the Federal Reserve's more patient, data-dependent stance.
Widening Rate Differentials: The divergence in central bank policy is leading to a widening interest rate differential that favors the US Dollar.
Geopolitical Headwinds: Fiscal policy from the new UK government and ongoing trade tensions are creating additional headwinds for the Pound.
The Technical Picture 📊
Price action provides strong confirmation of the bearish fundamental thesis, showing a clear loss of upward momentum and the formation of a new downtrend.
📉 Death Cross: The 50-day moving average has crossed below the 200-day moving average, forming a "death cross," which is a strong bearish indicator.
📉 Key Level Lost: The price has recently broken and is holding below the critical 200-day moving average, a classic bearish signal.
📉 Bearish Momentum: Both the RSI (below 50) and the MACD (below its signal line and zero) indicate that bearish momentum is in control.
The Trade Setup 📉
👉 Entry: 1.3540 - 1.3610
🎯 Take Profit: 1.3200
⛔️ Stop Loss: 1.3665

ETH POTENTIAL BULLISH GARTLEY Seeing a potential bullish gartley forming on ETH if it is unable to break above the .886 of the AB wave. Targets would be $2004 to $1786 for the .786 or 1.618 of the BC leg

BITCOIN BEARS WILL DOMINATE THE MARKET|SHORT
BITCOIN SIGNAL
Trade Direction: short
Entry Level: 111,047.38
Target Level: 109,294.85
Stop Loss: 112,211.89
RISK PROFILE
Risk level: medium
Suggested risk: 1%
Timeframe: 2h
Disclosure: I am part of Trade Nation's Influencer program and receive a monthly fee for using their TradingView charts in my analysis.
✅LIKE AND COMMENT MY IDEAS✅

CHF/JPY BEARISH BIAS RIGHT NOW| SHORT
Hello, Friends!
We are going short on the CHF/JPY with the target of 179.028 level, because the pair is overbought and will soon hit the resistance line above. We deduced the overbought condition from the price being near to the upper BB band. However, we should use low risk here because the 1W TF is green and gives us a counter-signal.
Disclosure: I am part of Trade Nation's Influencer program and receive a monthly fee for using their TradingView charts in my analysis.
✅LIKE AND COMMENT MY IDEAS✅

EUR/USD: A High-Probability Short Setup at 1.1829At its core, this trade is driven by a powerful and growing divergence between the US and European economies. While technicals tell us where to trade, fundamentals tell us why we're trading.
1️⃣ The Interest Rate Gap: The U.S. currently offers significantly higher interest rates (4.25% - 4.50%) compared to the Eurozone (2.15%). This makes holding the US Dollar more attractive, creating natural downward pressure on the EUR/USD.
2️⃣ Central Bank Policy: The US Federal Reserve remains hawkish, focused on strength and fighting inflation. Meanwhile, the European Central Bank is dovish, signaling a willingness to keep conditions loose to support a weaker economy.
3️⃣ Labor Market Strength: The US enjoys a robust labor market with unemployment at just 4.1%, while the Eurozone's is significantly higher at 6.3%. This points to a stronger US economy.
In simple terms, the US economy is strong, and its central bank is acting like it. The Eurozone economy is weaker, and its central bank is acting accordingly. This fundamental imbalance is the fuel for a potential significant move down in EUR/USD.
The Technical Picture: The Wall at 1.1829
As you can see on the 4H chart, the price has run into a major wall of resistance at the 52-week high of 1.1829 . After a long uptrend, the momentum has stalled, and the price is now consolidating inside a symmetrical triangle . This coiling of price action often precedes a strong breakout.
Our strategy is not to guess the breakout, but to act on a high-probability retest of resistance. We are looking to enter a short position as the price pulls back towards the upper boundary of this triangle, anticipating a failure at resistance and a subsequent break to the downside.
The Actionable Trade Plan
This setup offers an excellent risk/reward profile.
📉 Asset: EUR/USD
👉 Entry (Limit Sell): 1.1780
⛔️ Stop Loss: 1.1850
🎯 Take Profit: 1.1600
📈 Risk/Reward Ratio: ~2.57:1
Trade safe and manage your risk.

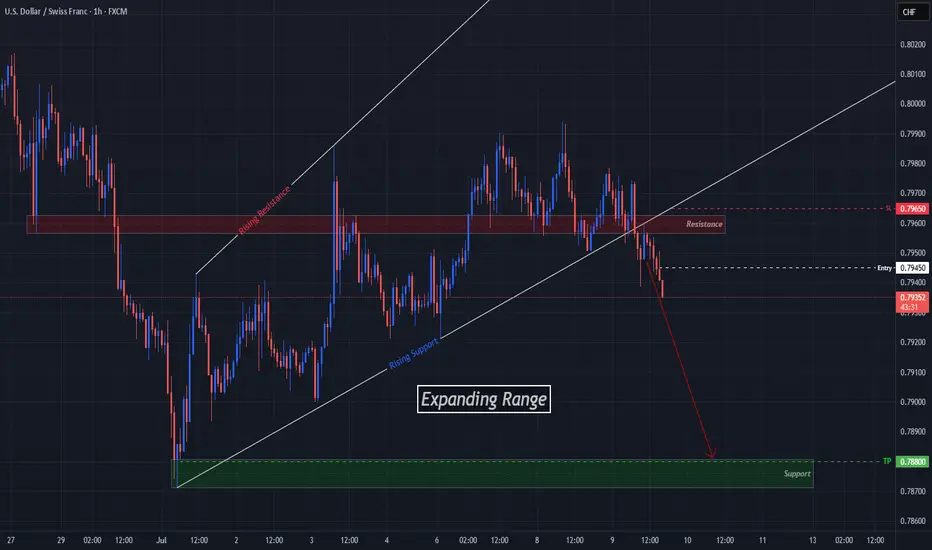
USDCHF Breaks Expansion, Aims For Next Support LevelOANDA:USDCHF has given us a Breakout of the Expanding Range it has been traveling in since the Low @ .78712 created on July 1st.
Now Price has already Retested the Breakout of the Rising Support of the Expansion and a Past Support Level, now turned Resistance @ .7960!
Hourly candles are continuing to close Lower signaling further potential to the downside!
Short Entry @ .7945
SL @ .7965 ( Above Retest of Breakout )
TP @ .7880
AUDJPY Ready To "Drop A Shoulder"? Multi-Timeframe May Help!OANDA:AUDJPY is beginning to form a very convincingly strong Reversal Pattern, the Head & Shoulders!
Starting with the Daily Chart we can see that Price is Forming a Doji Candle just after trying to Breakout of a Major Resistance Zone created from the Highs of March 18th and if Price is unable to close above this level, this strengthens the Bearish and Reversal Bias.
Now the 4 Hr Chart shows both the "First Shoulder" or Previous Higher High that was surpassed by the "Head" which is the New Higher High, has formed quite quickly with a slightly Ascending "Neckline" or Support Line where Bulls were able to make their Last Stand.
With a Reversal Pattern, you want to see a Change in Trend, in this case, would be a Lower High then that of the Higher High or "Head" @ 96.204.
*If Bulls are able to Push Price above the "Left Shoulder" or Previous Higher High @ 95.952, this will Invalidate the Head & Shoulders Set-up!
**If Bulls are unable to Break Above 95.952 and Price is pushed back down to the Confirmation or "Neckline" for a 3rd time, this Confirms the Head & Shoulders Set-up!!
Based on the Distance between the Head and Neckline, we can project a potential drop down to the next Support Level as a Price Target @ 95.00 once:
1) Pattern is Confirmed
2) Breakout is Validated

Bears On The Prowl, Key Supports In FocusAnalysis
USDJPY has faced downward pressure recently and is currently trading below a key resistance level around 152.250. This level acts as a significant barrier to upward movements, and the inability to decisively break above it reinforces our bearish outlook.
Key Observations
🔹 Dominant Bearish Pressure: Despite fluctuations, bulls (buyers) seem to be struggling to maintain higher levels, while bears (sellers) are asserting pressure.
🔹 Key Resistance: The 152.250 level serves as a strong resistance. As long as the price remains below this level, the bearish view will prevail.
🔹 Crucial Supports: The levels of 141.710 and 137.410 are acting as critical support zones for this pair. A break below either of these levels could pave the way for further declines.
🔹 Momentum Indicators: (Here, you can add details about specific indicators that confirm your bearish view. For example: "The RSI is moving towards oversold territory, suggesting continued downside momentum," or "The MACD is showing a bearish crossover, indicating potential for further weakness.")
Potential Scenarios
🔴 Primary Scenario (Bearish): As long as USDJPY remains below the 152.250 resistance, we anticipate continued downward pressure. The bears' initial target will be to test and break the 141.710 support.
🔻 Break of First Support: If the 141.710 support is broken decisively (with strong candles and significant volume), this would be a strong bearish signal. In this scenario, the next target for the price would be to test the lower support at 137.410. A break below this level could lead to even deeper declines.
🟢 Alternative Scenario (Bullish): Should USDJPY manage to decisively break above the 152.250 resistance and sustain itself above it, our bearish view would be temporarily invalidated, and we might see a corrective upward movement. However, until this occurs, the focus remains on the bearish scenario.
Fundamental Considerations
🔘 US-Japan Interest Rate Differential: The significant interest rate differential between the US Federal Reserve and the Bank of Japan continues to be a major factor. Any shift in market expectations regarding the monetary policies of these two central banks could impact USDJPY.
🔘 Bank of Japan (BoJ) Policy: Any signs of a change in the BoJ's ultra-loose monetary policy (e.g., an interest rate hike or a reduction in asset purchases) could strengthen the JPY and put downward pressure on USDJPY.
🔘 US Economic Data: Upcoming US economic data, particularly inflation figures and statements from Federal Reserve officials, could influence the dollar's value and, consequently, USDJPY.
🍀HAVE PROFITABLE TRADES🍻

USOIL BEST PLACE TO SELL FROM|SHORT
USOIL SIGNAL
Trade Direction: short
Entry Level: 68.26
Target Level: 63.78
Stop Loss: 71.23
RISK PROFILE
Risk level: medium
Suggested risk: 1%
Timeframe: 9h
Disclosure: I am part of Trade Nation's Influencer program and receive a monthly fee for using their TradingView charts in my analysis.
✅LIKE AND COMMENT MY IDEAS✅

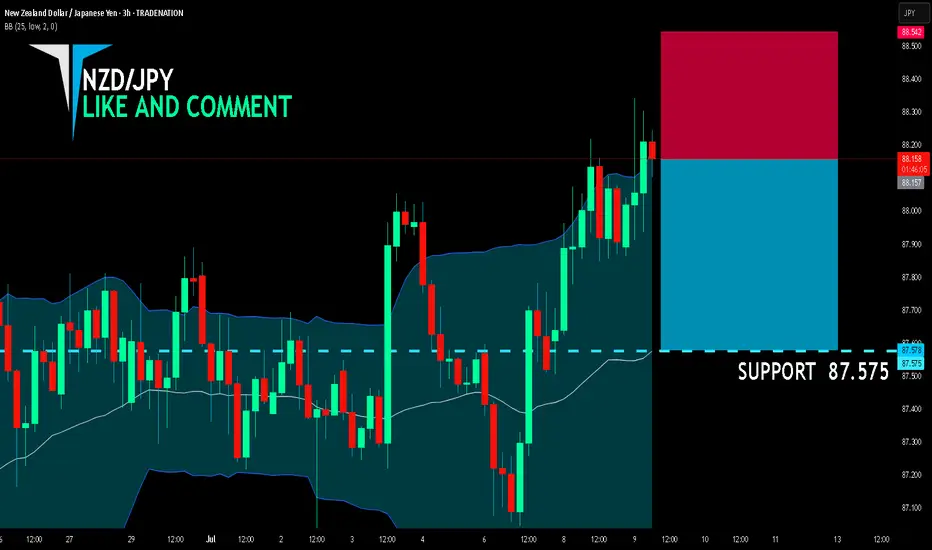
NZD/JPY BEARS ARE STRONG HERE|SHORT
NZD/JPY SIGNAL
Trade Direction: short
Entry Level: 88.157
Target Level: 87.575
Stop Loss: 88.542
RISK PROFILE
Risk level: medium
Suggested risk: 1%
Timeframe: 3h
Disclosure: I am part of Trade Nation's Influencer program and receive a monthly fee for using their TradingView charts in my analysis.
✅LIKE AND COMMENT MY IDEAS✅