Gold is Pushing Bullish but is it really ready???This looks like a early move to move full on bullish. I feel like it might need to sweep the low from mid week before they really ready to go bullish. waiting for things to show a bit more clear during the Kill Zone.
Bearish Patterns

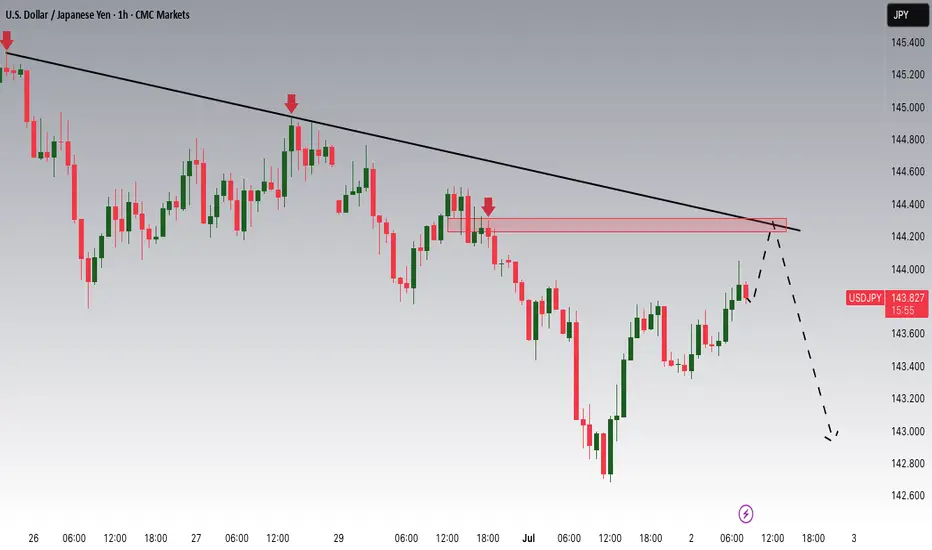
USDJPY Potential DownsidesHey Traders, in today's trading session we are monitoring USDJPY for a selling opportunity around 144.200 zone, USDJPY is trading in a downtrend and currently is in a correction phase in which it is approaching the trend at 144.200 support and resistance area.
Trade safe, Joe.
US30 Pullback then LongLooking for the pullback then on on bullish PA look for the entry. Wait for breach below then push back up and bullish PA close then plan entries.

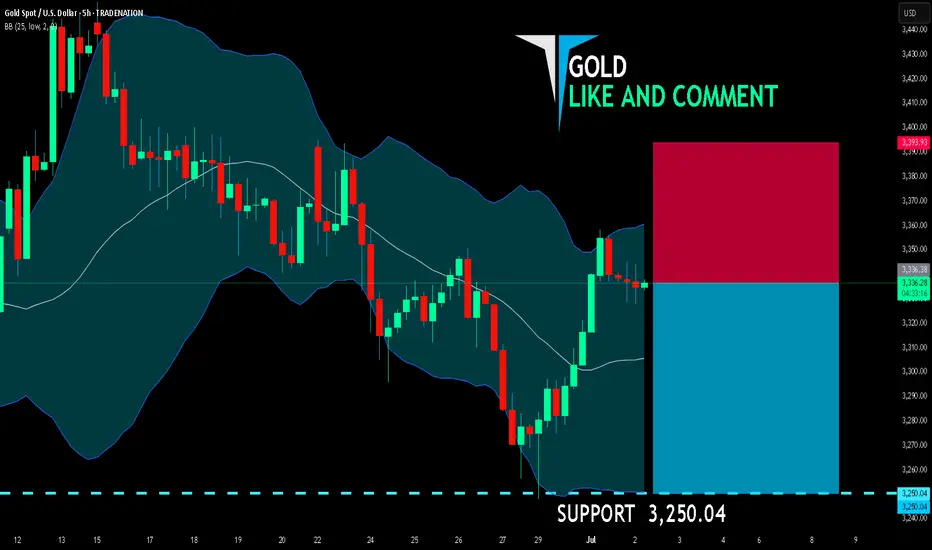
GOLD BEARS ARE STRONG HERE|SHORT
GOLD SIGNAL
Trade Direction: short
Entry Level: 3,336.38
Target Level: 3,250.04
Stop Loss: 3,393.93
RISK PROFILE
Risk level: medium
Suggested risk: 1%
Timeframe: 5h
Disclosure: I am part of Trade Nation's Influencer program and receive a monthly fee for using their TradingView charts in my analysis.
✅LIKE AND COMMENT MY IDEAS✅
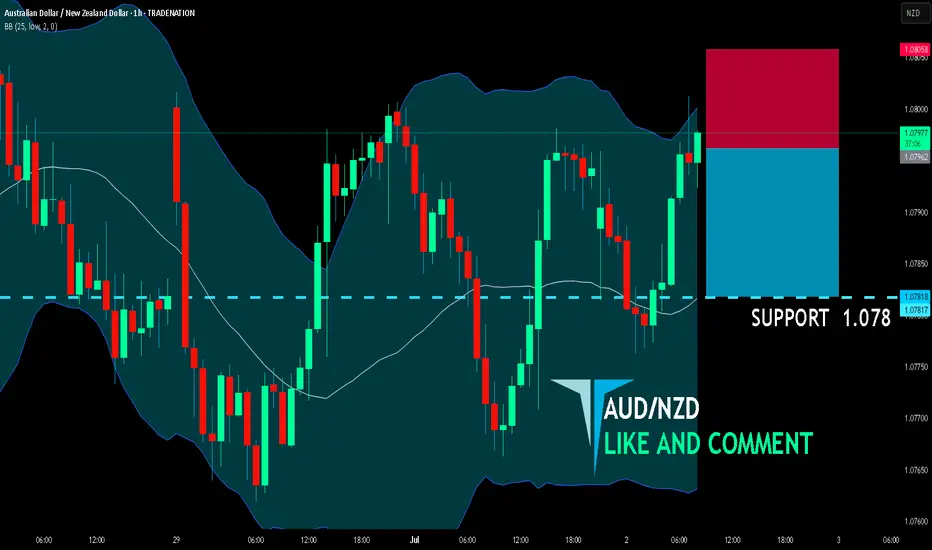
AUD/NZD SHORT FROM RESISTANCE
AUD/NZD SIGNAL
Trade Direction: short
Entry Level: 1.079
Target Level: 1.078
Stop Loss: 1.080
RISK PROFILE
Risk level: medium
Suggested risk: 1%
Timeframe: 1h
Disclosure: I am part of Trade Nation's Influencer program and receive a monthly fee for using their TradingView charts in my analysis.
✅LIKE AND COMMENT MY IDEAS✅
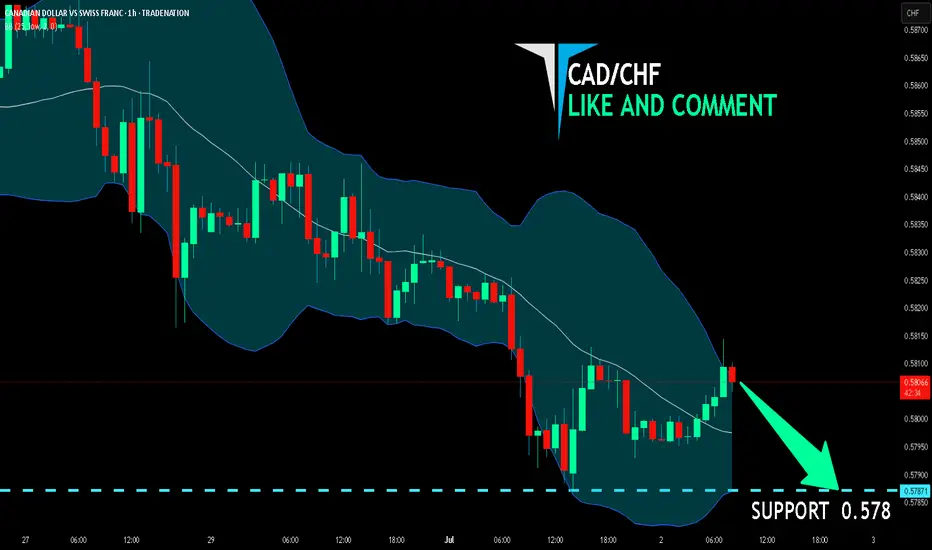
CAD/CHF BEARS WILL DOMINATE THE MARKET|SHORT
Hello, Friends!
We are targeting the 0.578 level area with our short trade on CAD/CHF which is based on the fact that the pair is overbought on the BB band scale and is also approaching a resistance line above thus going us a good entry option.
Disclosure: I am part of Trade Nation's Influencer program and receive a monthly fee for using their TradingView charts in my analysis.
✅LIKE AND COMMENT MY IDEAS✅
AUD/JPY SENDS CLEAR BEARISH SIGNALS|SHORT
Hello, Friends!
We are now examining the AUD/JPY pair and we can see that the pair is going up locally while also being in a uptrend on the 1W TF. But there is also a powerful signal from the BB upper band being nearby, indicating that the pair is overbought so we can go short from the resistance line above and a target at 93.578 level.
Disclosure: I am part of Trade Nation's Influencer program and receive a monthly fee for using their TradingView charts in my analysis.
✅LIKE AND COMMENT MY IDEAS✅

BITCOIN BEARS ARE GAINING STRENGTH|SHORT
BITCOIN SIGNAL
Trade Direction: short
Entry Level: 106,743.04
Target Level: 99,806.18
Stop Loss: 111,349.12
RISK PROFILE
Risk level: medium
Suggested risk: 1%
Timeframe: 1D
Disclosure: I am part of Trade Nation's Influencer program and receive a monthly fee for using their TradingView charts in my analysis.
✅LIKE AND COMMENT MY IDEAS✅

SELL FIBERAfter yesterdays stop out we are at it again, we believe EURUSD bears will step in at current prices. Our sell entry is at 1.17100 our TIGHT stop loss is at 1.17500 and target is as low as 1.14500 . Use proper risk management and always risk what you can afford to loose. Cheers gang

EURJPY Readies Triangle Breakout w/ Elliot WaveOANDA:EURJPY has formed a Triangle Pattern with a Rising Support and Resistance Zone @ 169.5 - 169.7 area.
After the False Breakout last week on Friday, we see Price falls back within the Pattern and finds strong Resistance from the zone.
Now based from the High - to Low - to Lower High where price made a 50% - 61.8% Retracement, we can plot the Trend Based-Fib Tool that suggests with the change of trend ( Price printing a Lower High ) we can expect Lower Prices to come and potentially a Bearish Breakout to the pattern!
First we will want to see where the next Lower Low will be ( currently @ 168.934 ) then wait for a Retracement to a favorable Fibonacci Level based from the Lower High to Lower Low.
Fundamentally, the EUR will have CPI Flash Estimates on Tuesday, and multiple Services PMI on Thursday with ECB President Lagarde speaking Tuesday and Wednesday. This could add volatility!!
Stay Tuned!

DXY USD Dollar Bearish Short term, then bullishI am not a financial advisor. This is not meant to be and does not constitute financial, investment, trading, or any other types of advice or recommendation.

SILVER BEARS ARE STRONG HERE|SHORT
SILVER SIGNAL
Trade Direction: short
Entry Level: 3,607.1
Target Level: 3,250.7
Stop Loss: 3,843.0
RISK PROFILE
Risk level: medium
Suggested risk: 1%
Timeframe: 1D
Disclosure: I am part of Trade Nation's Influencer program and receive a monthly fee for using their TradingView charts in my analysis.
✅LIKE AND COMMENT MY IDEAS✅

GOLD SELLERS WILL DOMINATE THE MARKET|SHORT
GOLD SIGNAL
Trade Direction: short
Entry Level: 3,339.37
Target Level: 3,313.04
Stop Loss: 3,356.82
RISK PROFILE
Risk level: medium
Suggested risk: 1%
Timeframe: 1h
Disclosure: I am part of Trade Nation's Influencer program and receive a monthly fee for using their TradingView charts in my analysis.
✅LIKE AND COMMENT MY IDEAS✅

USD/CHF SENDS CLEAR BEARISH SIGNALS|SHORT
USD/CHF SIGNAL
Trade Direction: short
Entry Level: 0.817
Target Level: 0.805
Stop Loss: 0.824
RISK PROFILE
Risk level: medium
Suggested risk: 1%
Timeframe: 5h
Disclosure: I am part of Trade Nation's Influencer program and receive a monthly fee for using their TradingView charts in my analysis.
✅LIKE AND COMMENT MY IDEAS✅

GOLD SHORT FROM RESISTANCE
GOLD SIGNAL
Trade Direction: long
Entry Level: 3,380.73
Target Level: 3,335.74
Stop Loss: 3,410.56
RISK PROFILE
Risk level: medium
Suggested risk: 1%
Timeframe: 3h
Disclosure: I am part of Trade Nation's Influencer program and receive a monthly fee for using their TradingView charts in my analysis.
✅LIKE AND COMMENT MY IDEAS✅

GOLD BEARS WILL DOMINATE THE MARKET|SHORT
GOLD SIGNAL
Trade Direction: short
Entry Level: 3,419.53
Target Level: 3,348.85
Stop Loss: 3,466.65
RISK PROFILE
Risk level: medium
Suggested risk: 1%
Timeframe: 6h
Disclosure: I am part of Trade Nation's Influencer program and receive a monthly fee for using their TradingView charts in my analysis.
✅LIKE AND COMMENT MY IDEAS✅

EUR/NZD SELLERS WILL DOMINATE THE MARKET|SHORT
Hello, Friends!
EUR/NZD pair is trading in a local uptrend which we know by looking at the previous 1W candle which is green. On the 17H timeframe the pair is going up too. The pair is overbought because the price is close to the upper band of the BB indicator. So we are looking to sell the pair with the upper BB line acting as resistance. The next target is 1.915 area.
Disclosure: I am part of Trade Nation's Influencer program and receive a monthly fee for using their TradingView charts in my analysis.
✅LIKE AND COMMENT MY IDEAS✅

H4 Outlook | XAUUSD Monday • June 30 • 2025Hey fam,
Fresh week on gold — clean structure, clean levels, clean execution ahead. Forget the noise. We trade price, we trust precision.
🔍 Market Flow & Bias
Gold remains bearish on the H4 timeframe.
Lower highs, lower lows, clean rejection from supply, and all EMAs (21/50/200) aligned down. RSI hovers near 30, showing heavy momentum — not exhaustion yet.
Price is coiled, not crushed. If structure holds, we follow the short flow into deeper zones.
📌 Bias: Bearish below 3325. Pullbacks into supply = opportunity.
—
🧱 Zones of Interest (Clean & Confluent)
🔺 Zone 1 – 3380–3405 | Extreme Supply
Top OB zone with resting liquidity above. If price sweeps this level and fails, expect a sharp reversal. Only valid with reaction (CHoCH or bearish engulfing).
🔺 Zone 2 – 3325–3350 | Main Supply
Strong H4 breaker block. Origin of the last major selloff. Already defended once — if it holds again, look for sniper shorts from within.
🔺 Zone 3 – 3285–3305 | Frontline Supply
First inducement zone. Clean micro-OB that could give early fade trades. If bulls break through, Zone 2 becomes magnet.
⚖️ Zone 4 – 3260–3240 | Flip Shelf
Range base. If price holds, bulls might step in short-term. But a clean break below shifts momentum fully toward lower demand.
🟢 Zone 5 – 3215–3195 | Main Demand
Unmitigated OB with imbalance. If gold drops here with momentum and forms rejection wicks or CHoCH on LTF → long opportunity for bounce.
🟢 Zone 6 – 3150–3120 | Extreme Demand
Macro swing demand. Deepest discount level on the chart. Valid only if market flushes — this is the “last stand” for buyers.
—
🎯 Key Levels Zone Cheat-Sheet
Above
• 3380–3405 → Extreme Supply (trap zone)
• 3325–3350 → Main Supply block
• 3285–3305 → Micro OB inducement
Below
• 3260–3240 → Flip shelf (structural pivot)
• 3215–3195 → Main buy zone
• 3150–3120 → Deep macro demand
—
⚔️ Execution Plan
We sell from reaction zones, not assumptions.
We buy from confluence, not hope.
Every zone above comes with condition: no confirmation, no entry.
—
📣 Found this useful?
Drop a ⚔️ in the comments, tag your bias, 🚀and follow GoldFxMinds for sniper-level execution.
This isn’t guessing. This is structure. This is clarity.

USDCAD RT of Supply Zone then ShortPrice has retraced back into a key supply zone just under the June High. We are now watching for strong bearish price action (PA) to confirm a potential short entry from this area.
Key Zone to Watch:
Supply Zone: 1.3756 – 1.3796
Optimistic stops can be placed above the zone if strong rejection occurs
Plan:
Seek bearish PA within the highlighted supply zone
Wait for confirmation via a bearish candle close
Enter below the trigger candle once setup forms
Targets:
Target 1: 1.3622
Extended Target / June Low: 1.3543
If no rejection occurs and price breaks above the zone with conviction, the setup becomes invalid and we reassess.
Execution will be reactive, not predictive — we trade confirmation, not speculation.

US30 looking for the short on Bearish PAI believe we can expect a pull back down to JuBias: Short-term Bearish (Contingent Setup)
Context: Price is currently trading just below a high-probability supply zone between 44,048 – 44,277. This area aligns with prior highs and liquidity, making it a prime zone to look for a short-term rejection if strong bearish price action (PA) appears on the 4H or Daily timeframes.
We are currently seeing strong bullish momentum on the Weekly, Daily, and H4 candles. Any short positions from this zone must be reactive — not anticipatory. A clear bearish signal (e.g., engulfing, structure break, supply confirmation) is required to consider entry.
Key Zone:
Seek bearish PA between 44,048 – 44,277
Contingency: If price breaks and closes above 44,250 (2024 highs), expect continuation toward 45,000
Short Targets if Rejection Occurs:
Target 1: 43,350
Target 2: 42,500
Extended Target: 41,734 (June Low)
Post-Rejection Bullish Scenario:
If we do get a rejection and targets are met, we will then look for bullish PA in the demand zones (42,500 or 41,700) to consider long setups back toward the 2024 highs and potentially beyond.
Breakout Scenario:
If price breaks and closes above the 44,277 zone early this week, we anticipate the next leg to 45,000 before any meaningful reversal.
At this stage, it’s a waiting game — let price action lead. We don’t predict, we react.ne lows before an

USDJPY Potential DownsidesHey Traders, in today's trading session we are monitoring USDJPY for a selling opportunity around 146.700 zone, USDJPY is trading in a downtrend and currently is in a correction phase in which it is approaching the trend at 146.700 support and resistance area.
Trade safe, Joe.

US100 BEARISH BIAS RIGHT NOW| SHORT
US100 SIGNAL
Trade Direction: short
Entry Level: 22,518.7
Target Level: 21,870.2
Stop Loss: 22,949.8
RISK PROFILE
Risk level: medium
Suggested risk: 1%
Timeframe: 9h
Disclosure: I am part of Trade Nation's Influencer program and receive a monthly fee for using their TradingView charts in my analysis.
✅LIKE AND COMMENT MY IDEAS✅

EUR/AUD BEST PLACE TO SELL FROM|SHORT
Hello, Friends!
We are going short on the EUR/AUD with the target of 1.772 level, because the pair is overbought and will soon hit the resistance line above. We deduced the overbought condition from the price being near to the upper BB band. However, we should use low risk here because the 1W TF is green and gives us a counter-signal.
Disclosure: I am part of Trade Nation's Influencer program and receive a monthly fee for using their TradingView charts in my analysis.
✅LIKE AND COMMENT MY IDEAS✅
